| Param | Original file | Final file |
|---|---|---|
| Filename | modeM0/AS1A02_098T01_9000000736_05707cztM0_level2.evt | modeM0/AS1A02_098T01_9000000736_05707cztM0_level2_quad_clean.evt |
| Size (bytes) | 520,738,560 | 93,219,840 |
| Size | 496.6 MB | 88.9 MB |
| Events in quadrant A | 3,510,579 | 577,899 |
| Events in quadrant B | 4,476,390 | 570,758 |
| Events in quadrant C | 3,533,733 | 581,208 |
| Events in quadrant D | 3,730,698 | 561,144 |
| Mode SS | |||
|---|---|---|---|
| Quadrant | BADHDUFLAG | Total packets | Discarded packets |
| A | 0 | 154 | 0 |
| B | 0 | 154 | 0 |
| C | 0 | 154 | 0 |
| D | 0 | 154 | 0 |
| Mode M0 | |||
|---|---|---|---|
| Quadrant | BADHDUFLAG | Total packets | Discarded packets |
| A | 0 | 15869 | 2 |
| B | 0 | 18464 | 1 |
| C | 0 | 15933 | 1 |
| D | 0 | 16524 | 1 |
| Quadrant | Total seconds | Saturated seconds | Saturation percentage |
|---|---|---|---|
| A | 7645 | 58 | 0.758666% |
| B | 7645 | 194 | 2.537606% |
| C | 7645 | 19 | 0.248528% |
| D | 7645 | 36 | 0.470896% |
Noise dominated data is calculated using 1-second bins in cleaned event files. If a bin has >2000 counts, and if more than 50% of those come from <1% of pixels, then it is considered to be noise-dominated and hence unusable.
| Quadrant | # 1 sec bins | Bins with >0 counts | Bins with >2000 counts | High rate bins dominated by noise | Noise dominated (total time) | Noise dominated (detector-on time) | Marked lightcurve |
|---|---|---|---|---|---|---|---|
| A | 7685 | 7646 | 10 | 10 | 0.13% | 0.13% | 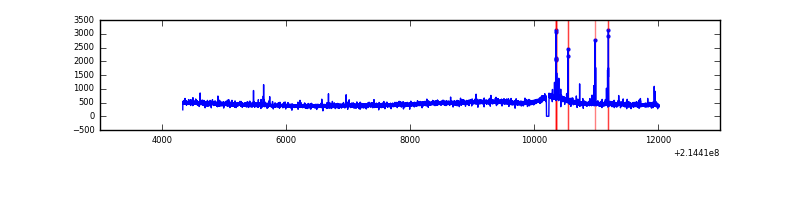 |
| B | 7685 | 7646 | 112 | 112 | 1.46% | 1.46% | 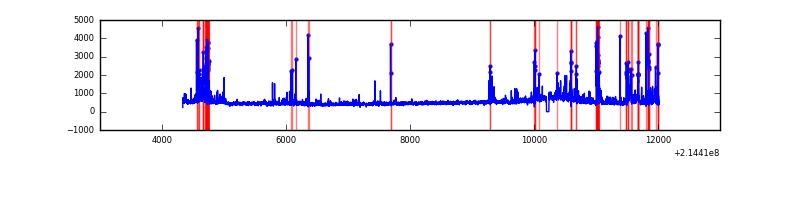 |
| C | 7685 | 7646 | 4 | 4 | 0.05% | 0.05% |  |
| D | 7685 | 7646 | 20 | 20 | 0.26% | 0.26% | 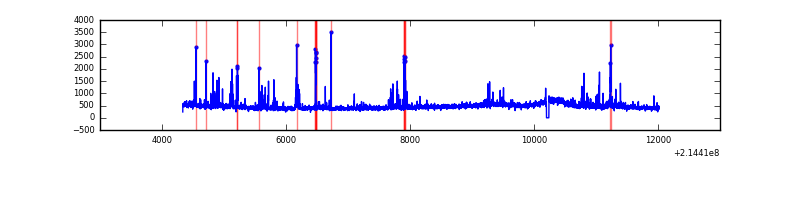 |
Top three noisy pixels from each quadrant. If the there are fewer than three noisy pixels in the level2.evt file, extra rows are filled as -1
| Pixel properties | Quadrant properties | ||||||
|---|---|---|---|---|---|---|---|
| Quadrant | DetID | PixID | Counts | Sigma | Mean | Median | Sigma |
| A | 0 | 50 | 77732 | 418.31 | 888 | 868 | 183.7 |
| A | 0 | 226 | 8779 | 43.05 | 888 | 868 | 183.7 |
| A | 12 | 194 | 8688 | 42.56 | 888 | 868 | 183.7 |
| B | 5 | 172 | 523607 | 3029.08 | 888 | 866 | 172.6 |
| B | 15 | 204 | 153145 | 882.4 | 888 | 866 | 172.6 |
| B | 11 | 51 | 122856 | 706.89 | 888 | 866 | 172.6 |
| C | 9 | 16 | 89113 | 443.92 | 856 | 861 | 198.8 |
| C | 5 | 250 | 57116 | 282.97 | 856 | 861 | 198.8 |
| C | 8 | 128 | 11153 | 51.77 | 856 | 861 | 198.8 |
| D | 2 | 152 | 182844 | 860.24 | 858 | 831 | 211.6 |
| D | 8 | 195 | 91979 | 430.79 | 858 | 831 | 211.6 |
| D | 12 | 233 | 88272 | 413.27 | 858 | 831 | 211.6 |
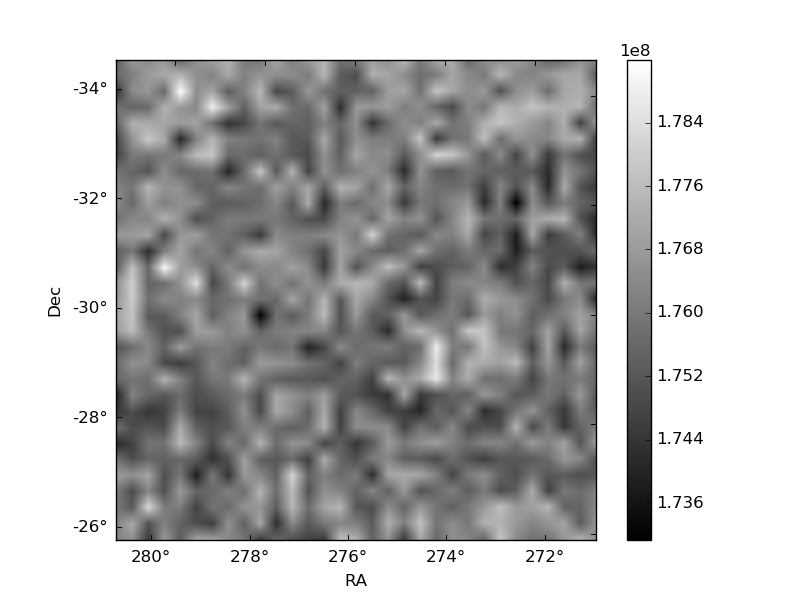
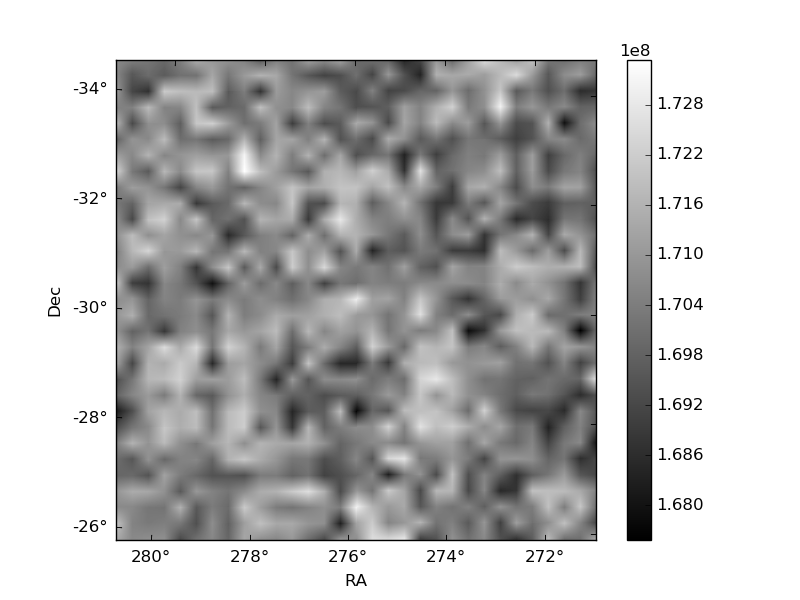
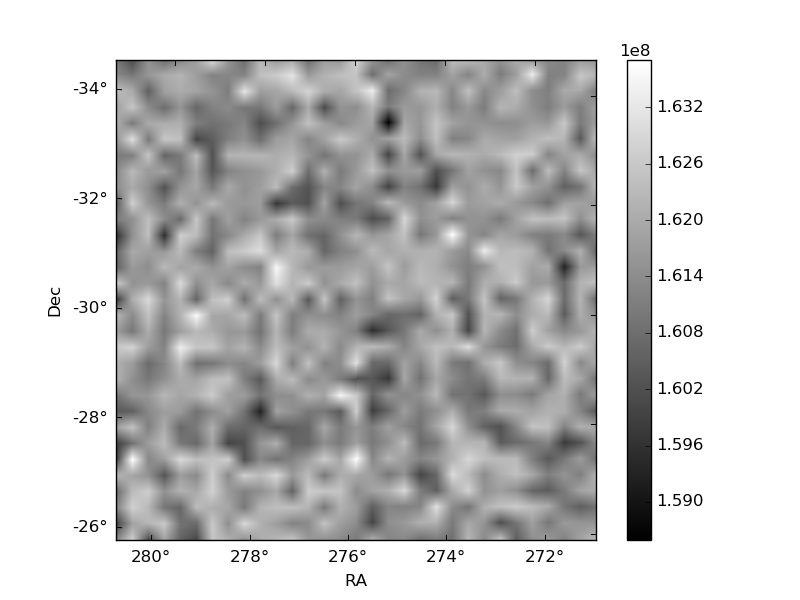
Histogram calculated using DETX and DETY for each event in the final _common_clean file
| Quadrant A | 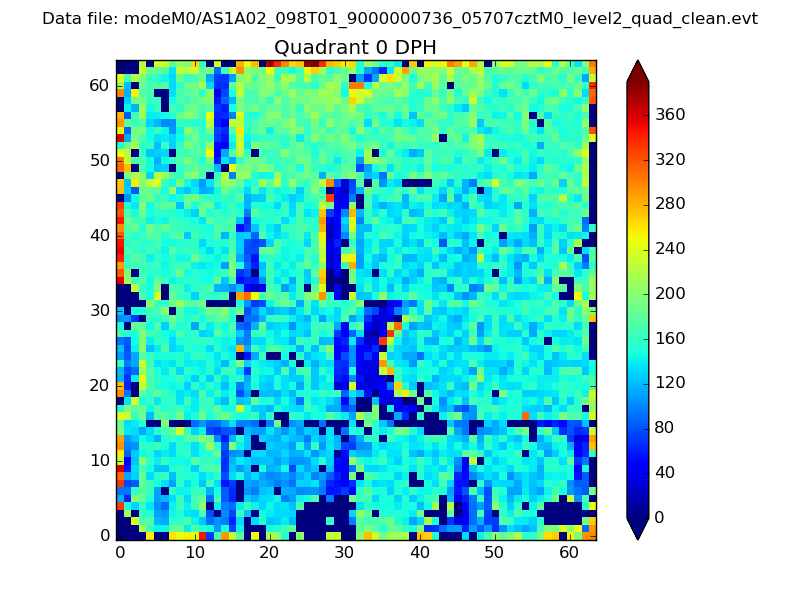 |
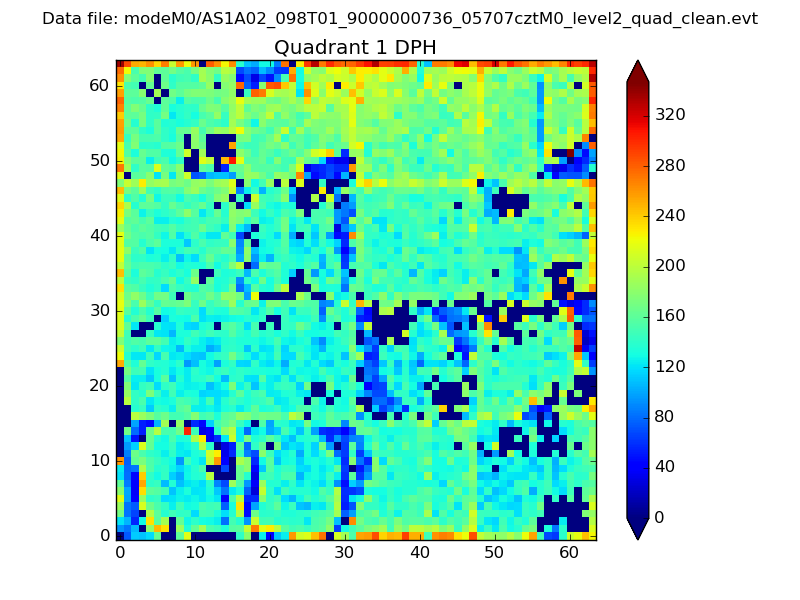 |
Quadrant B |
|---|---|---|---|
| Quadrant D |  |
 |
Quadrant C |
| Plot type | Count rate plots | Images |
|---|---|---|
| Comparison with Poisson distribution Blue bars denote a histogram of data divided into 1 sec bins. Red curve is a Poisson curve with rate = median count rate of data. |
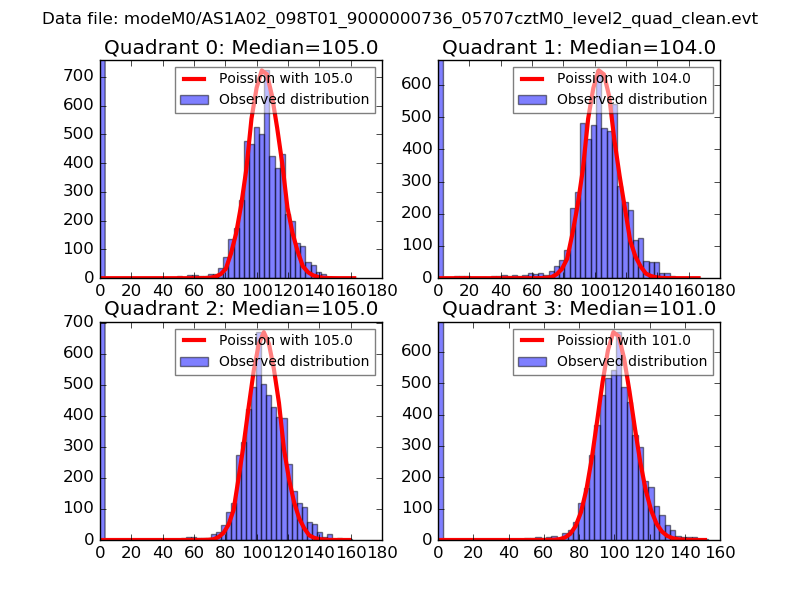 |
 |
| Quadrant-wise count rates Data is divided into 100 sec bins |
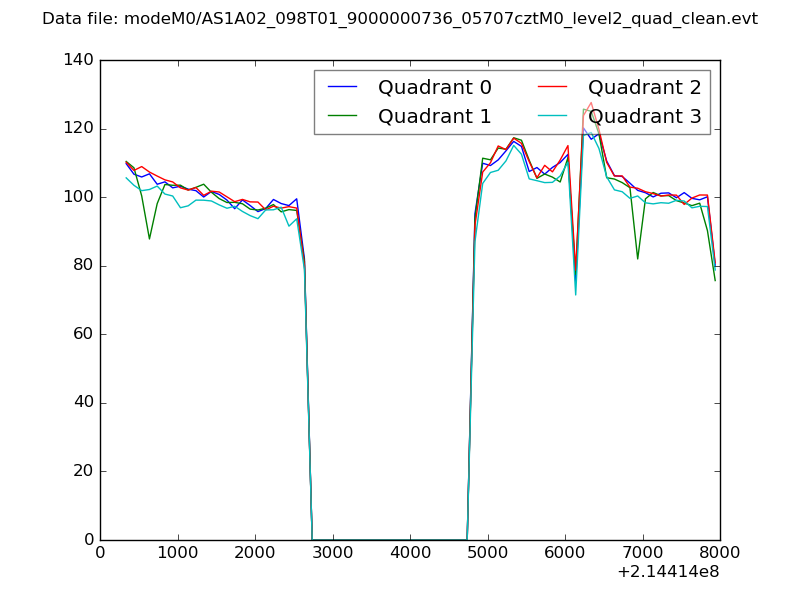 |
|
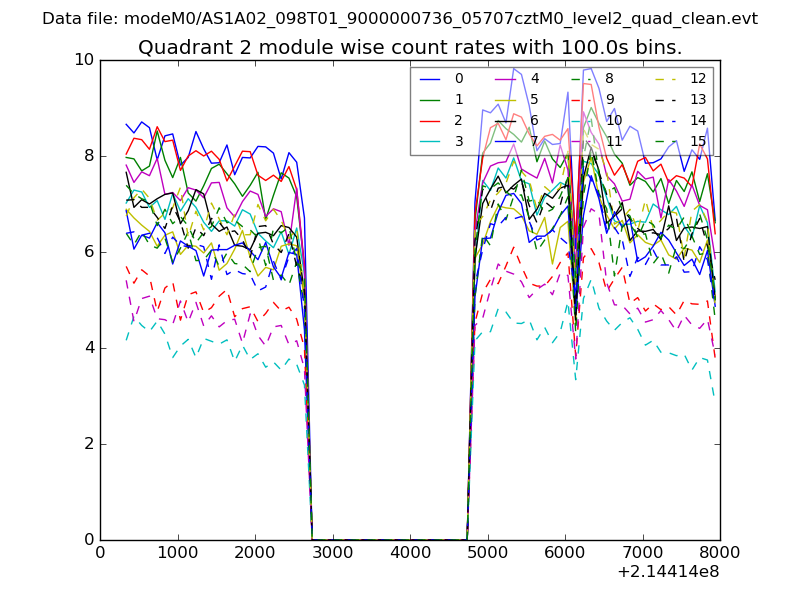
| Module-wise count rates for Quadrant A Data is divided into 100 sec bins |
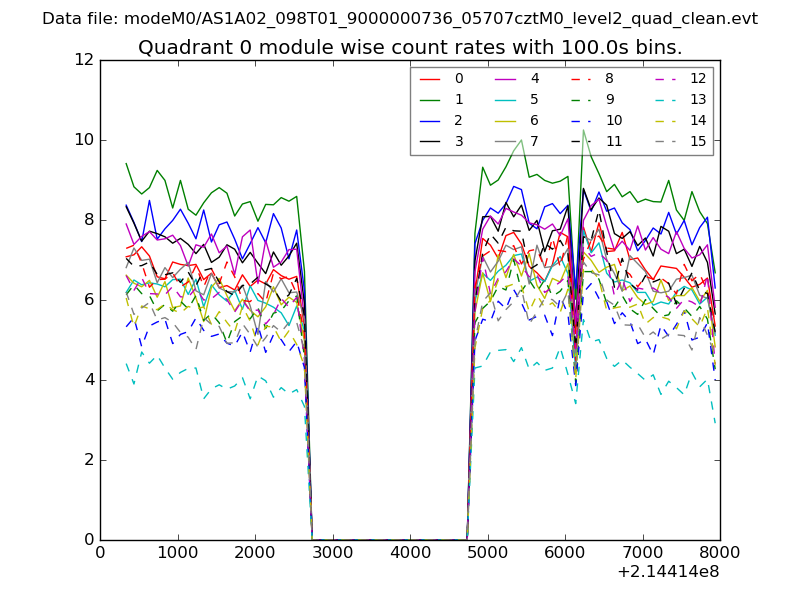 |
 |
| Module-wise count rates for Quadrant B Data is divided into 100 sec bins |
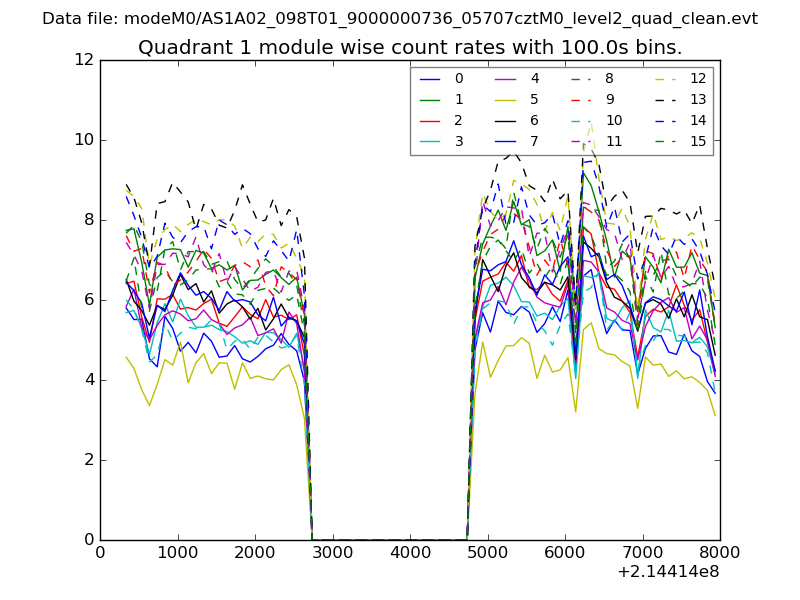 |
 |
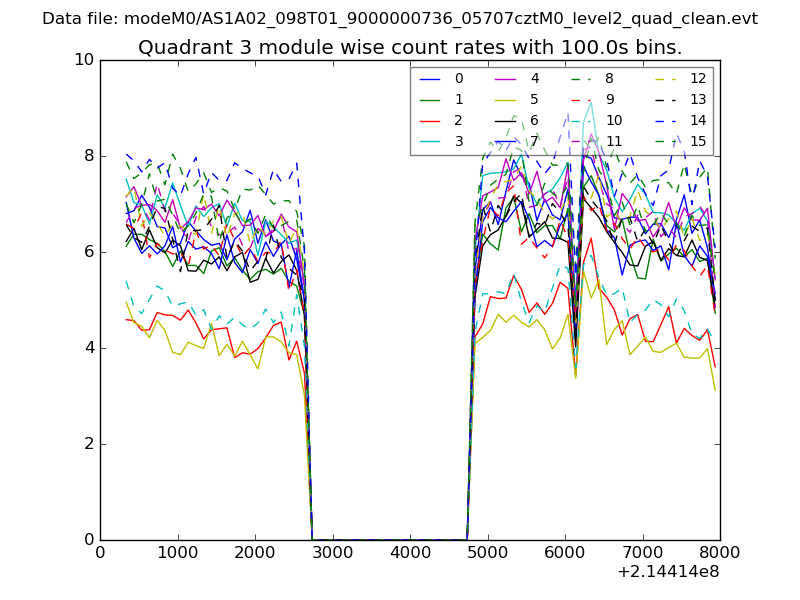
| Module-wise count rates for Quadrant C Data is divided into 100 sec bins |
 |
 |
| Module-wise count rates for Quadrant D Data is divided into 100 sec bins |
 |
 |
| Parameter | Plot |
|---|---|
| CZT HV Monitor | 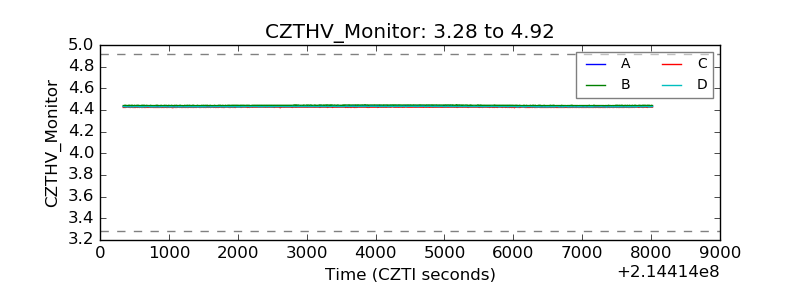 |
| D_VDD | 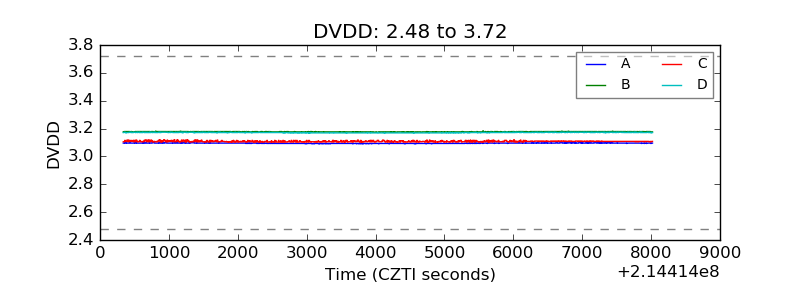 |
| Temperature 1 | 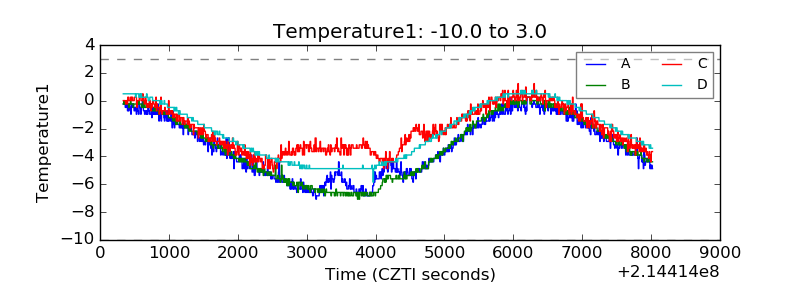 |
| Veto HV Monitor | 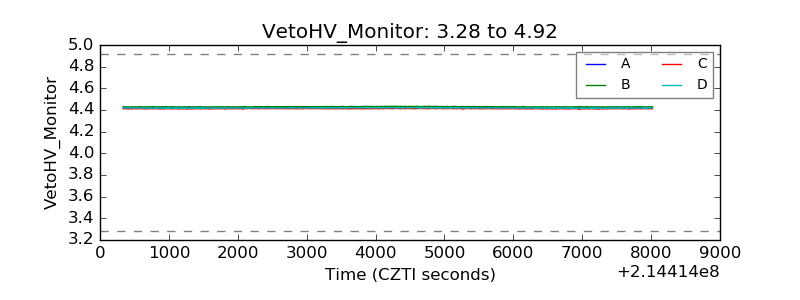 |
| Veto LLD | 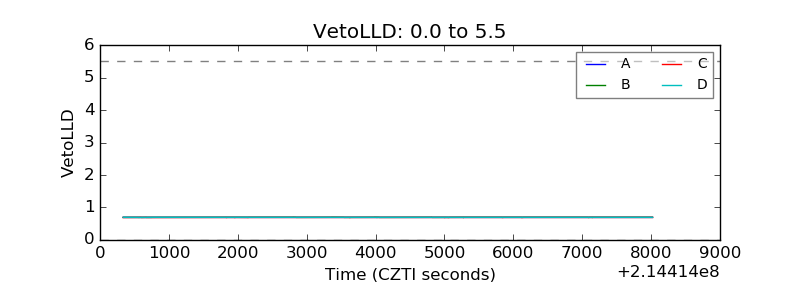 |
| Alpha Counter | 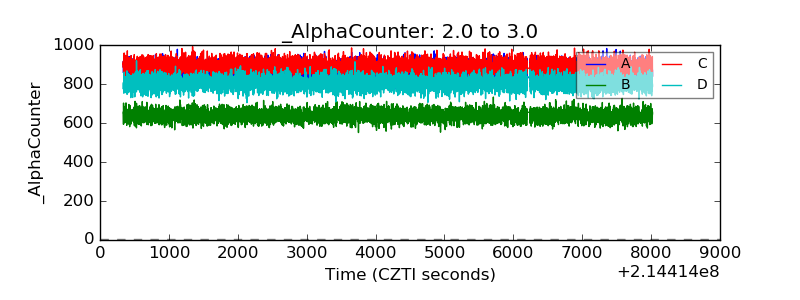 |
| _CPM_Rate | 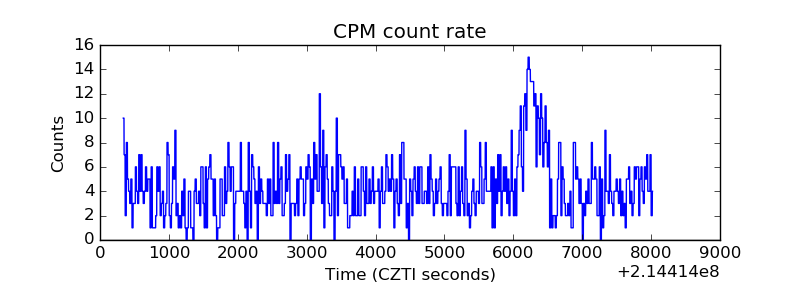 |
| CZT Counter | 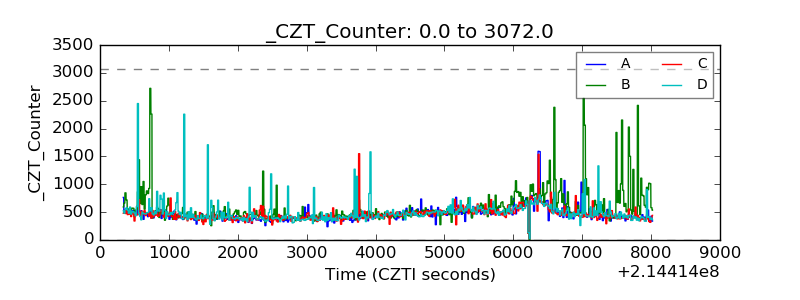 |
| +2.5 Volts monitor | 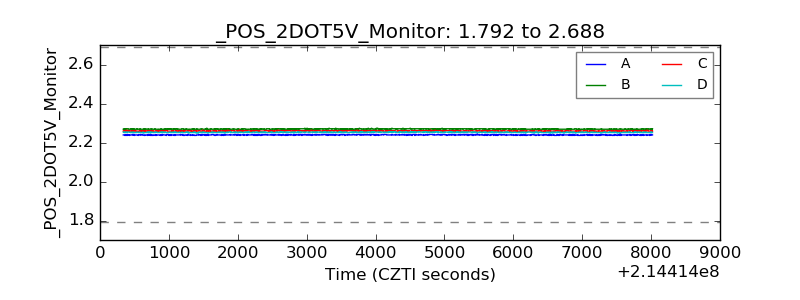 |
| +5 Volts monitor |  |
| _ROLL_ROT | 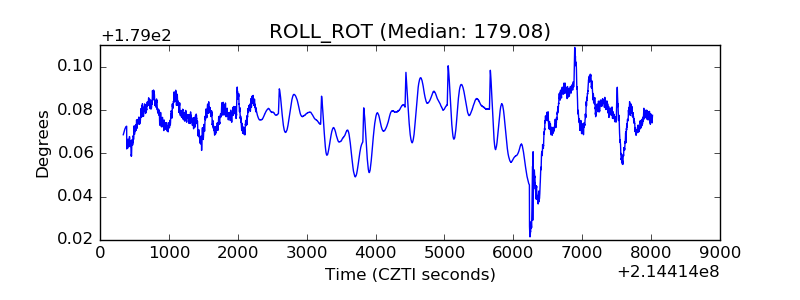 |
| _Roll_DEC | 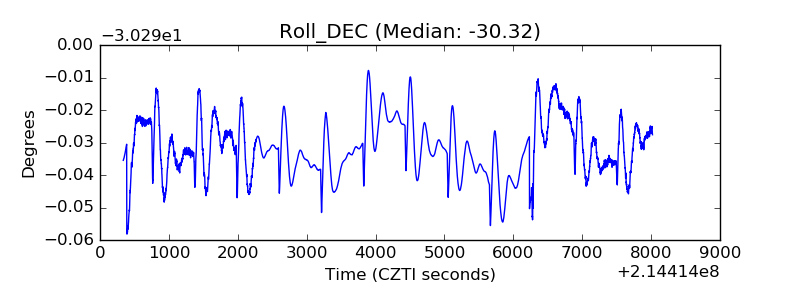 |
| _Roll_RA | 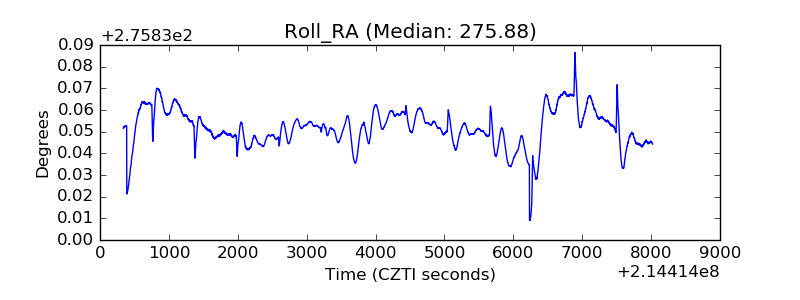 |
| Veto Counter | 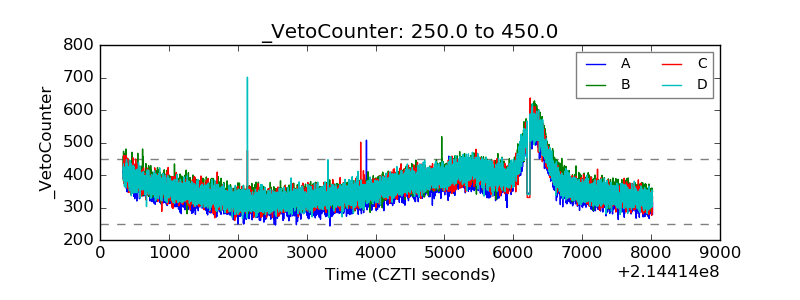 |