| Param | Original file | Final file |
|---|---|---|
| Filename | modeM0/AS1A02_098T01_9000000736_05711cztM0_level2.evt | modeM0/AS1A02_098T01_9000000736_05711cztM0_level2_quad_clean.evt |
| Size (bytes) | 1,273,544,640 | 190,992,960 |
| Size | 1.2 GB | 182.1 MB |
| Events in quadrant A | 8,413,301 | 1,136,319 |
| Events in quadrant B | 11,212,066 | 1,118,532 |
| Events in quadrant C | 8,282,466 | 1,152,826 |
| Events in quadrant D | 9,410,324 | 1,100,953 |
| Mode SS | |||
|---|---|---|---|
| Quadrant | BADHDUFLAG | Total packets | Discarded packets |
| A | 0 | 378 | 0 |
| B | 0 | 378 | 0 |
| C | 0 | 378 | 0 |
| D | 0 | 378 | 0 |
| Mode M0 | |||
|---|---|---|---|
| Quadrant | BADHDUFLAG | Total packets | Discarded packets |
| A | 0 | 38204 | 5 |
| B | 0 | 45642 | 4 |
| C | 0 | 38044 | 4 |
| D | 0 | 41067 | 4 |
| Mode M9 | |||
|---|---|---|---|
| Quadrant | BADHDUFLAG | Total packets | Discarded packets |
| A | 0 | 18 | 0 |
| B | 0 | 18 | 0 |
| C | 0 | 18 | 0 |
| D | 0 | 18 | 0 |
| Quadrant | Total seconds | Saturated seconds | Saturation percentage |
|---|---|---|---|
| A | 18499 | 142 | 0.767609% |
| B | 18499 | 555 | 3.000162% |
| C | 18499 | 104 | 0.562193% |
| D | 18499 | 160 | 0.864912% |
Noise dominated data is calculated using 1-second bins in cleaned event files. If a bin has >2000 counts, and if more than 50% of those come from <1% of pixels, then it is considered to be noise-dominated and hence unusable.
| Quadrant | # 1 sec bins | Bins with >0 counts | Bins with >2000 counts | High rate bins dominated by noise | Noise dominated (total time) | Noise dominated (detector-on time) | Marked lightcurve |
|---|---|---|---|---|---|---|---|
| A | 20409 | 18502 | 31 | 31 | 0.15% | 0.17% | 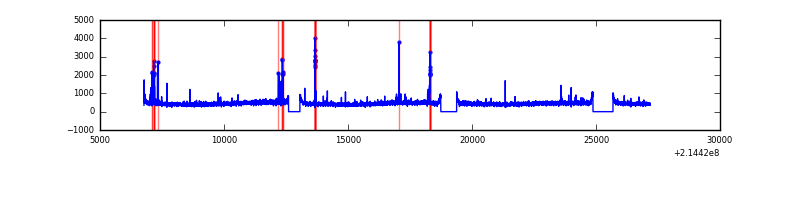 |
| B | 20409 | 18502 | 252 | 252 | 1.23% | 1.36% | 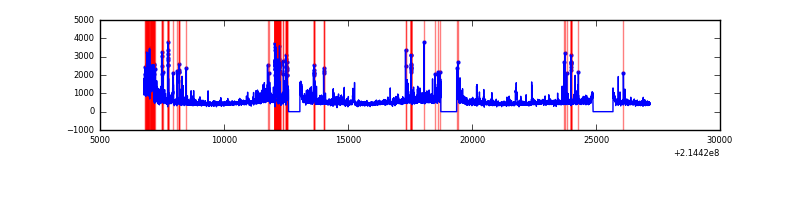 |
| C | 20409 | 18502 | 9 | 9 | 0.04% | 0.05% | 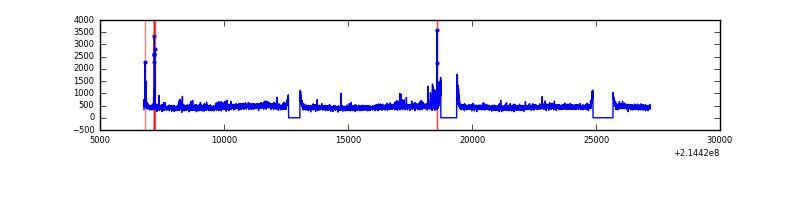 |
| D | 20409 | 18502 | 69 | 69 | 0.34% | 0.37% | 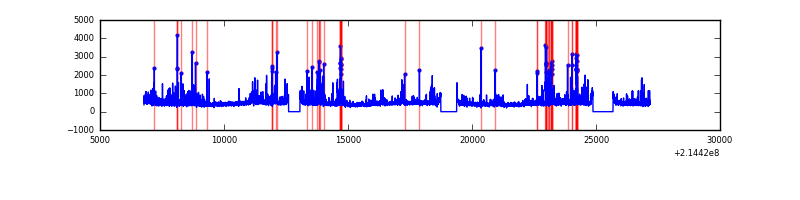 |
Top three noisy pixels from each quadrant. If the there are fewer than three noisy pixels in the level2.evt file, extra rows are filled as -1
| Pixel properties | Quadrant properties | ||||||
|---|---|---|---|---|---|---|---|
| Quadrant | DetID | PixID | Counts | Sigma | Mean | Median | Sigma |
| A | 0 | 50 | 209197 | 477.15 | 2117 | 2073 | 434.1 |
| A | 15 | 174 | 31800 | 68.48 | 2117 | 2073 | 434.1 |
| A | 12 | 194 | 20390 | 42.2 | 2117 | 2073 | 434.1 |
| B | 15 | 204 | 1149850 | 2849.36 | 2124 | 2075 | 402.8 |
| B | 5 | 172 | 993950 | 2462.34 | 2124 | 2075 | 402.8 |
| B | 11 | 51 | 208518 | 512.5 | 2124 | 2075 | 402.8 |
| C | 9 | 16 | 207356 | 432.22 | 2051 | 2055 | 475.0 |
| C | 3 | 9 | 28002 | 54.63 | 2051 | 2055 | 475.0 |
| C | 14 | 67 | 20054 | 37.89 | 2051 | 2055 | 475.0 |
| D | 2 | 152 | 1004059 | 1997.1 | 2048 | 1985 | 501.8 |
| D | 8 | 195 | 141709 | 278.47 | 2048 | 1985 | 501.8 |
| D | 12 | 110 | 137215 | 269.51 | 2048 | 1985 | 501.8 |
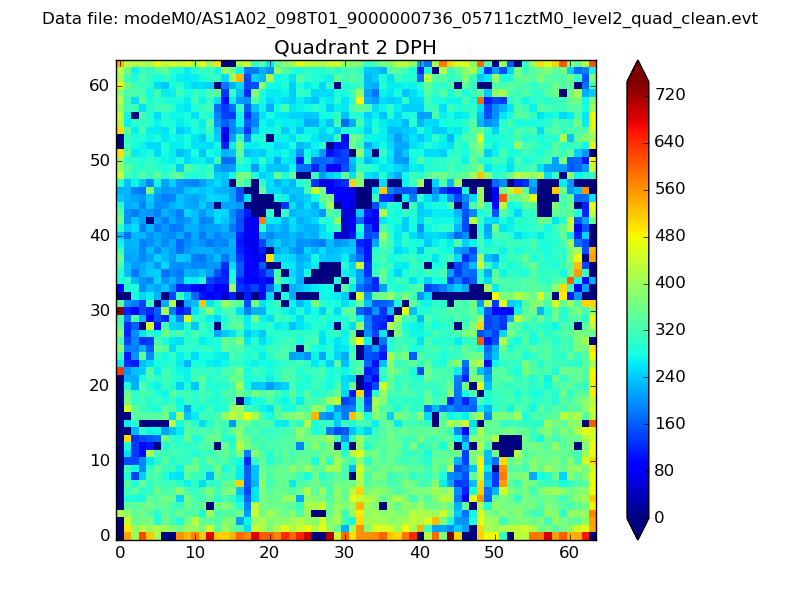
Histogram calculated using DETX and DETY for each event in the final _common_clean file
| Quadrant A | 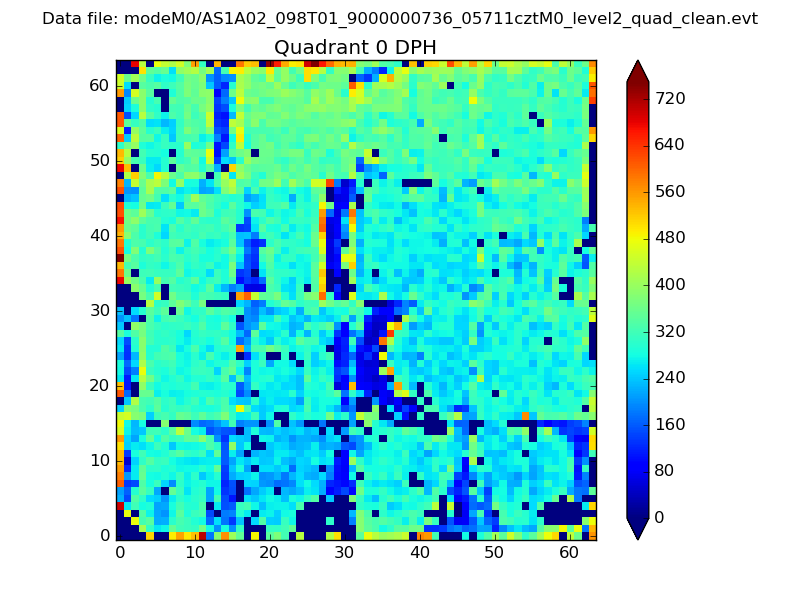 |
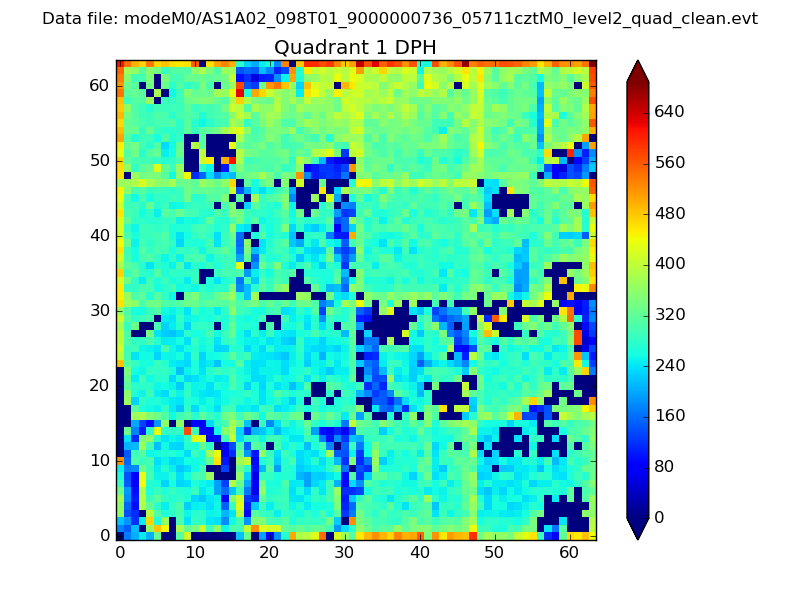 |
Quadrant B |
|---|---|---|---|
| Quadrant D | 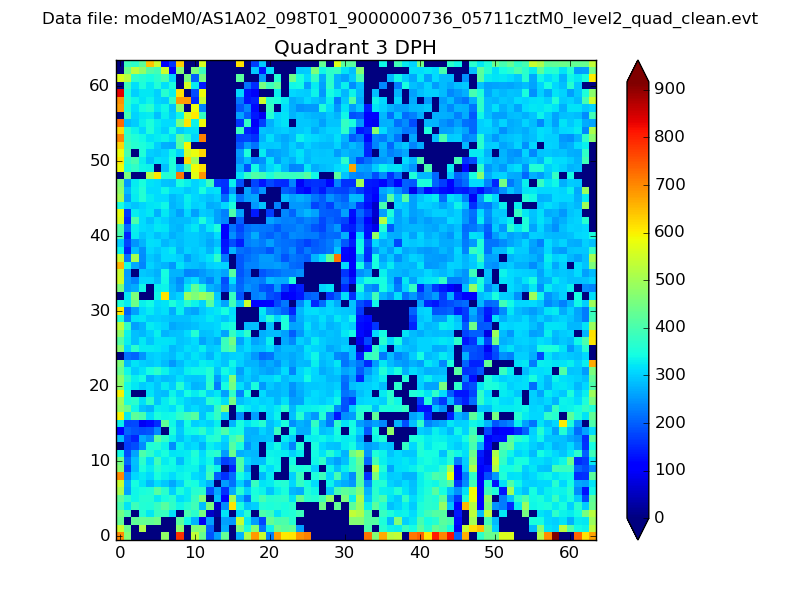 |
 |
Quadrant C |
| Plot type | Count rate plots | Images |
|---|---|---|
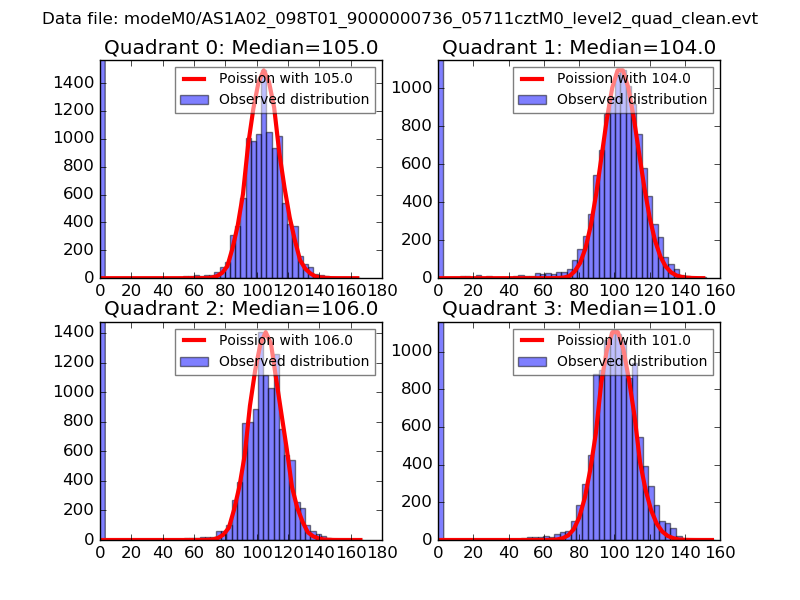
| Comparison with Poisson distribution Blue bars denote a histogram of data divided into 1 sec bins. Red curve is a Poisson curve with rate = median count rate of data. |
 |
 |
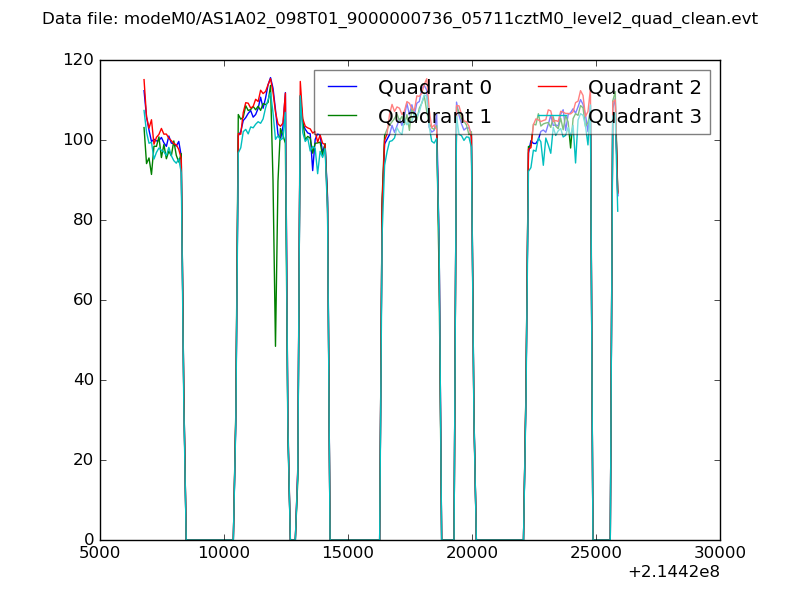
| Quadrant-wise count rates Data is divided into 100 sec bins |
 |
|
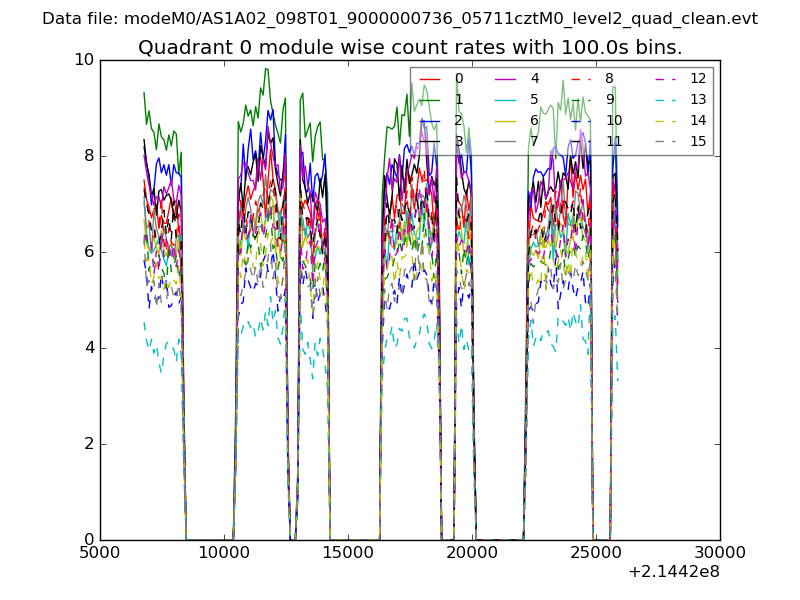
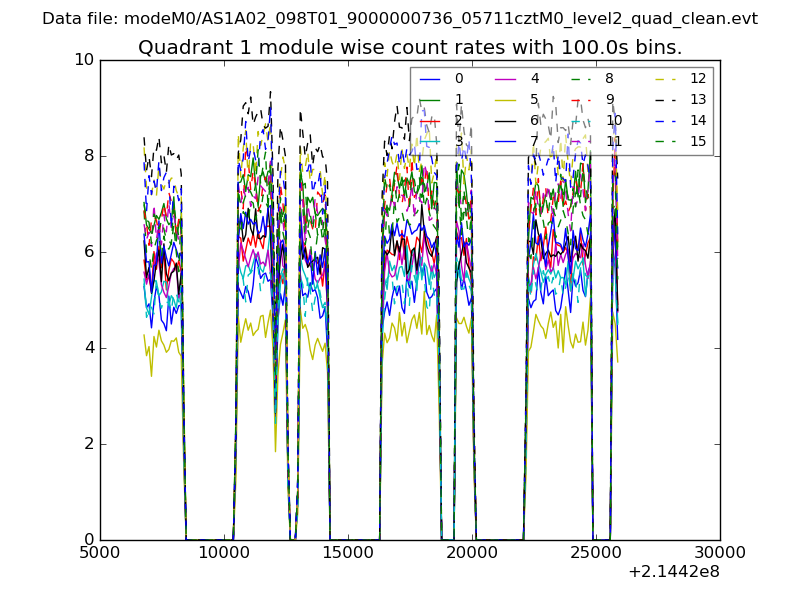
| Module-wise count rates for Quadrant A Data is divided into 100 sec bins |
 |
 |
| Module-wise count rates for Quadrant B Data is divided into 100 sec bins |
 |
 |
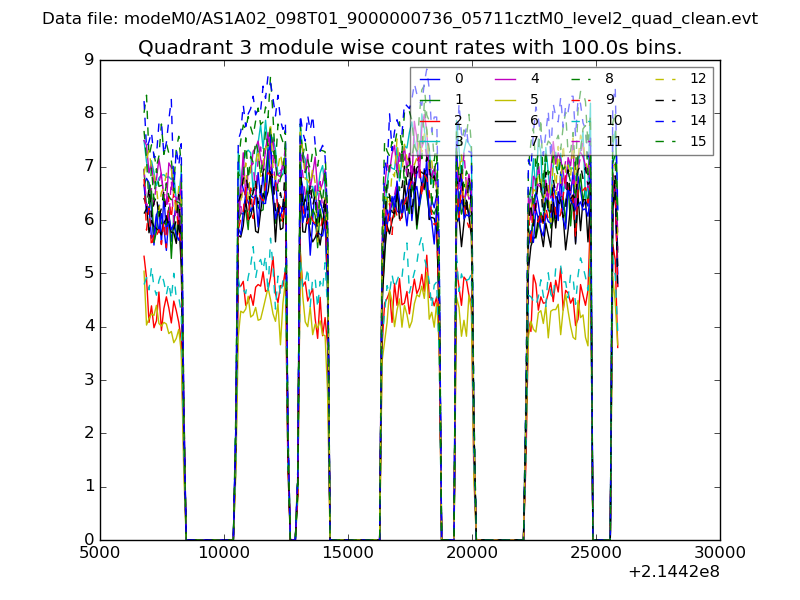
| Module-wise count rates for Quadrant C Data is divided into 100 sec bins |
 |
 |
| Module-wise count rates for Quadrant D Data is divided into 100 sec bins |
 |
 |
| Parameter | Plot |
|---|---|
| CZT HV Monitor | 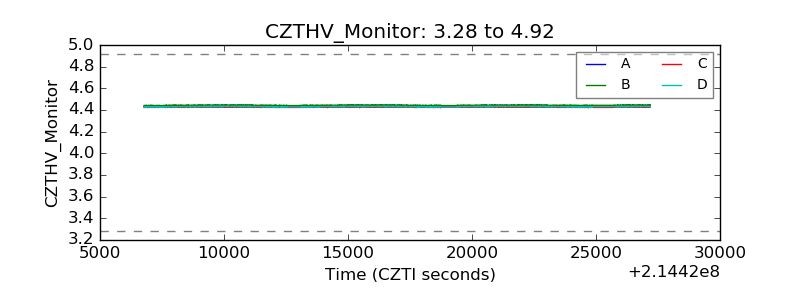 |
| D_VDD | 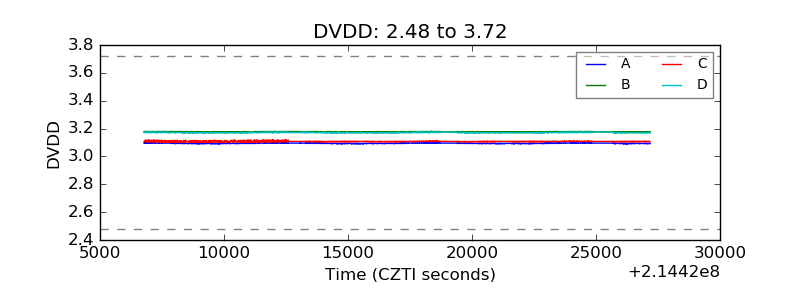 |
| Temperature 1 | 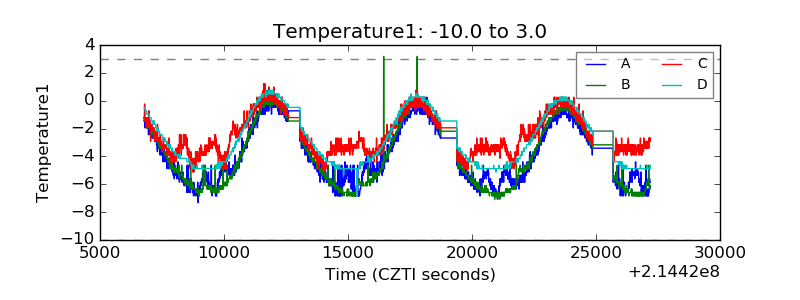 |
| Veto HV Monitor | 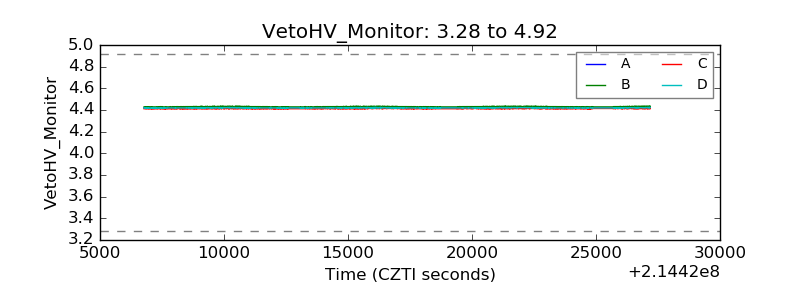 |
| Veto LLD | 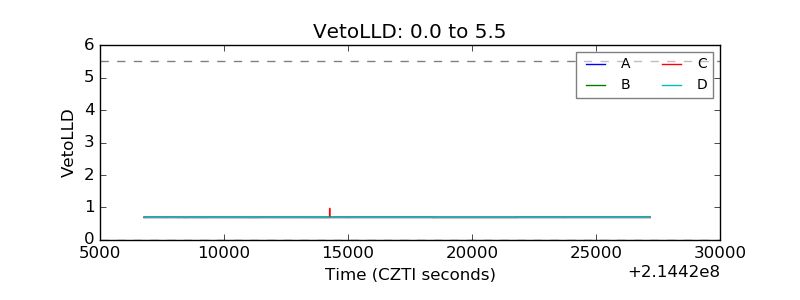 |
| Alpha Counter | 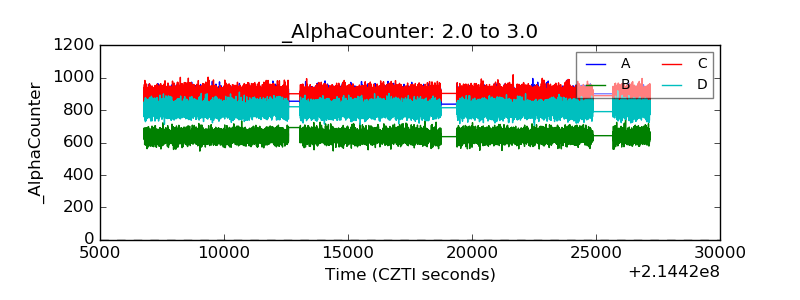 |
| _CPM_Rate | 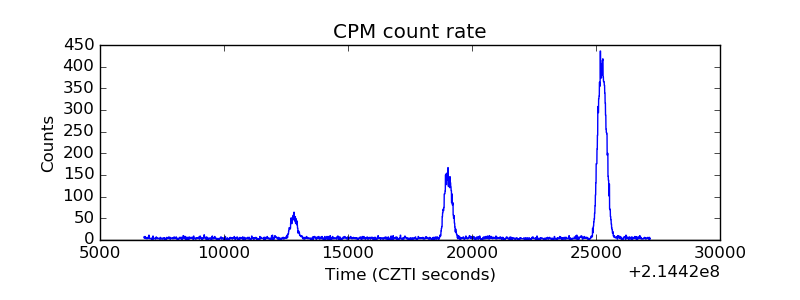 |
| CZT Counter | 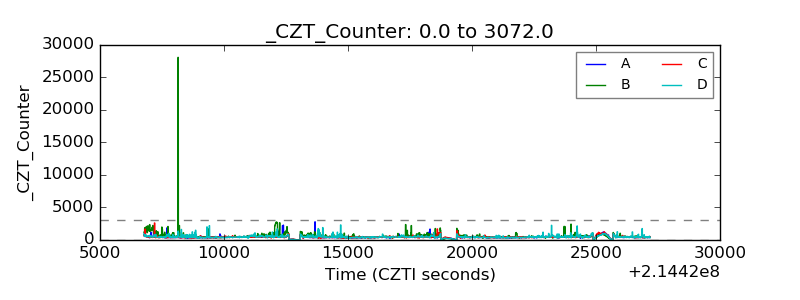 |
| +2.5 Volts monitor |  |
| +5 Volts monitor |  |
| _ROLL_ROT | 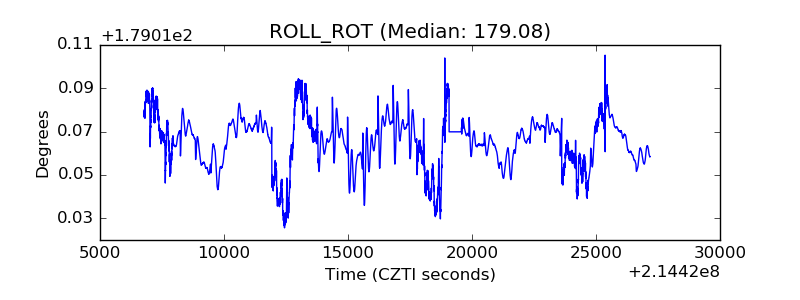 |
| _Roll_DEC | 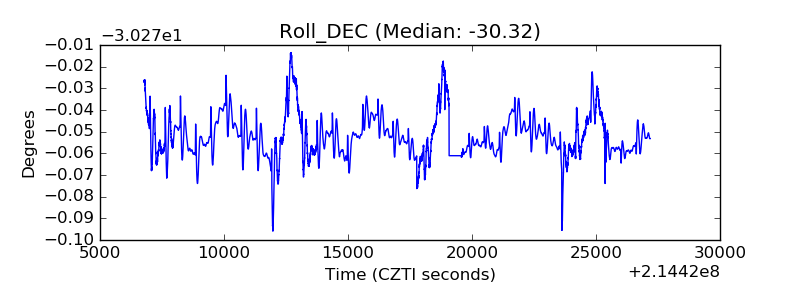 |
| _Roll_RA | 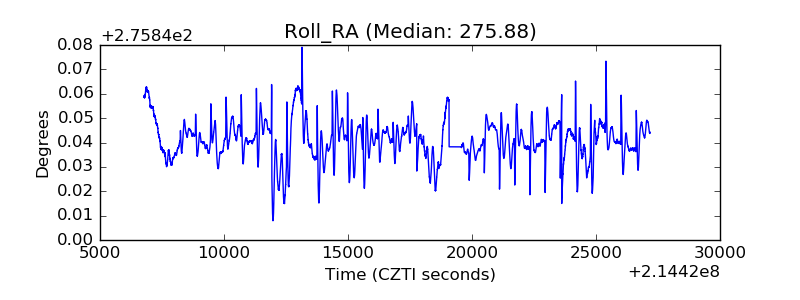 |
| Veto Counter |  |