| Param | Original file | Final file |
|---|---|---|
| Filename | modeM0/AS1A02_098T01_9000000736_05712cztM0_level2.evt | modeM0/AS1A02_098T01_9000000736_05712cztM0_level2_quad_clean.evt |
| Size (bytes) | 453,695,040 | 59,100,480 |
| Size | 432.7 MB | 56.4 MB |
| Events in quadrant A | 3,030,598 | 332,139 |
| Events in quadrant B | 3,680,180 | 328,740 |
| Events in quadrant C | 3,012,145 | 339,323 |
| Events in quadrant D | 3,562,923 | 323,032 |
| Mode SS | |||
|---|---|---|---|
| Quadrant | BADHDUFLAG | Total packets | Discarded packets |
| A | 0 | 136 | 0 |
| B | 0 | 136 | 0 |
| C | 0 | 136 | 0 |
| D | 0 | 136 | 0 |
| Mode M0 | |||
|---|---|---|---|
| Quadrant | BADHDUFLAG | Total packets | Discarded packets |
| A | 0 | 13652 | 3 |
| B | 0 | 15265 | 2 |
| C | 0 | 13659 | 2 |
| D | 0 | 15174 | 2 |
| Mode M9 | |||
|---|---|---|---|
| Quadrant | BADHDUFLAG | Total packets | Discarded packets |
| A | 0 | 10 | 0 |
| B | 0 | 10 | 0 |
| C | 0 | 10 | 0 |
| D | 0 | 10 | 0 |
| Quadrant | Total seconds | Saturated seconds | Saturation percentage |
|---|---|---|---|
| A | 6682 | 48 | 0.718348% |
| B | 6682 | 149 | 2.229871% |
| C | 6682 | 47 | 0.703382% |
| D | 6683 | 86 | 1.286847% |
Noise dominated data is calculated using 1-second bins in cleaned event files. If a bin has >2000 counts, and if more than 50% of those come from <1% of pixels, then it is considered to be noise-dominated and hence unusable.
| Quadrant | # 1 sec bins | Bins with >0 counts | Bins with >2000 counts | High rate bins dominated by noise | Noise dominated (total time) | Noise dominated (detector-on time) | Marked lightcurve |
|---|---|---|---|---|---|---|---|
| A | 7652 | 6683 | 0 | 0 | 0.00% | 0.00% | 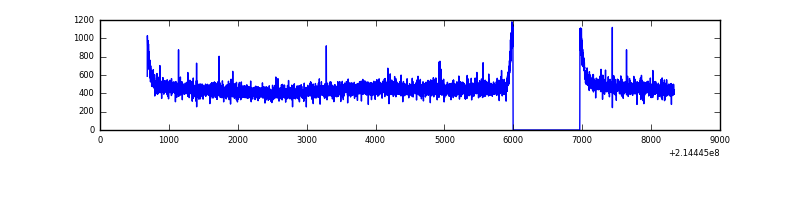 |
| B | 7652 | 6683 | 69 | 69 | 0.90% | 1.03% | 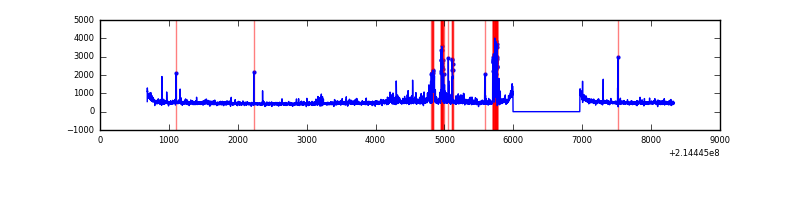 |
| C | 7652 | 6683 | 0 | 0 | 0.00% | 0.00% | 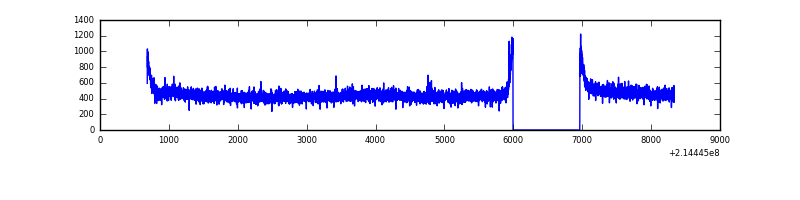 |
| D | 7653 | 6684 | 30 | 30 | 0.39% | 0.45% | 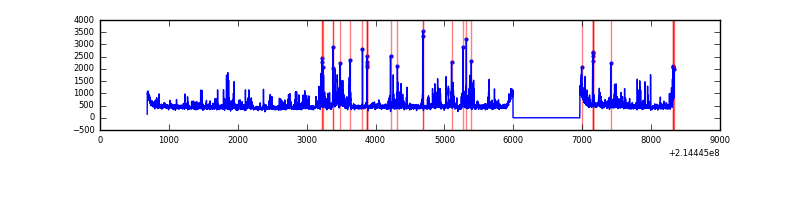 |
Top three noisy pixels from each quadrant. If the there are fewer than three noisy pixels in the level2.evt file, extra rows are filled as -1
| Pixel properties | Quadrant properties | ||||||
|---|---|---|---|---|---|---|---|
| Quadrant | DetID | PixID | Counts | Sigma | Mean | Median | Sigma |
| A | 0 | 226 | 7595 | 42.5 | 783 | 765 | 160.7 |
| A | 12 | 194 | 7418 | 41.4 | 783 | 765 | 160.7 |
| A | 13 | 6 | 6475 | 35.53 | 783 | 765 | 160.7 |
| B | 15 | 204 | 185255 | 1224.49 | 790 | 771 | 150.7 |
| B | 0 | 214 | 177384 | 1172.25 | 790 | 771 | 150.7 |
| B | 5 | 172 | 135857 | 896.62 | 790 | 771 | 150.7 |
| C | 14 | 67 | 17329 | 92.66 | 764 | 768 | 178.7 |
| C | 13 | 61 | 6264 | 30.75 | 764 | 768 | 178.7 |
| C | 8 | 128 | 5583 | 26.94 | 764 | 768 | 178.7 |
| D | 2 | 152 | 498516 | 2673.47 | 757 | 734 | 186.2 |
| D | 5 | 233 | 40054 | 211.18 | 757 | 734 | 186.2 |
| D | 12 | 233 | 35986 | 189.33 | 757 | 734 | 186.2 |
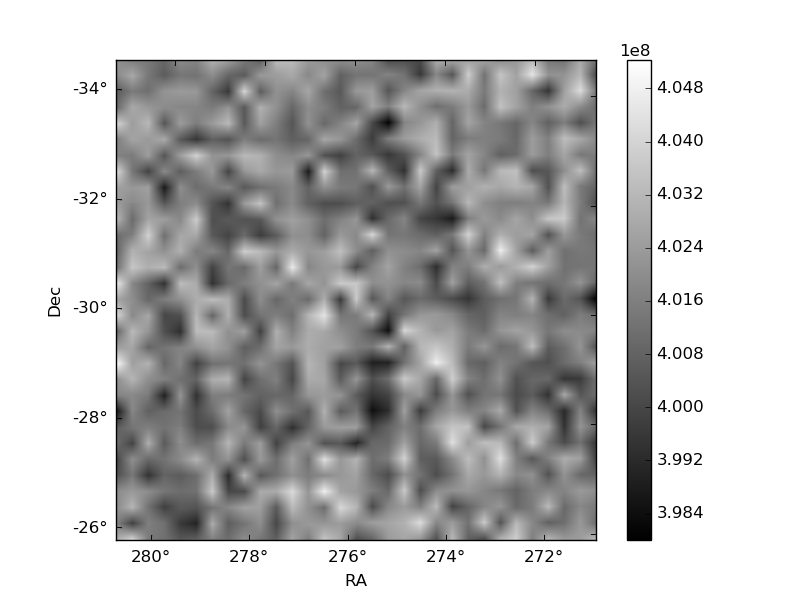
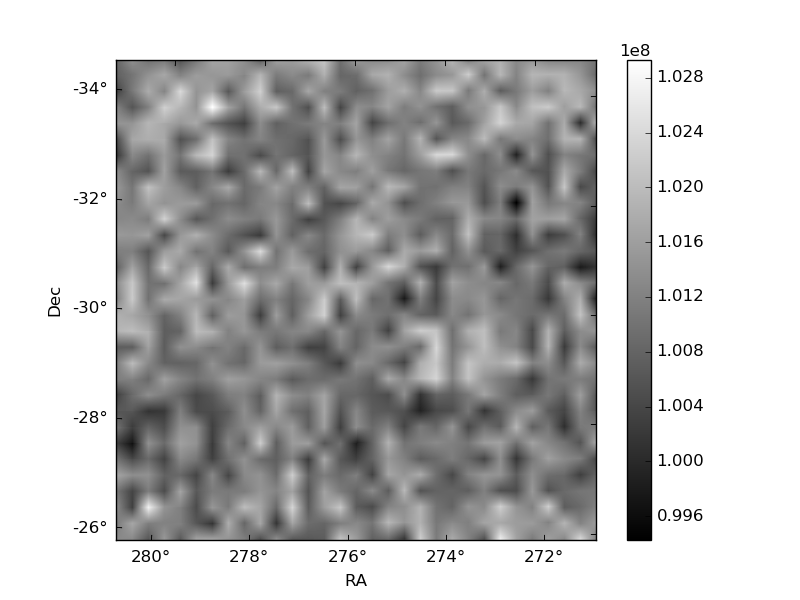
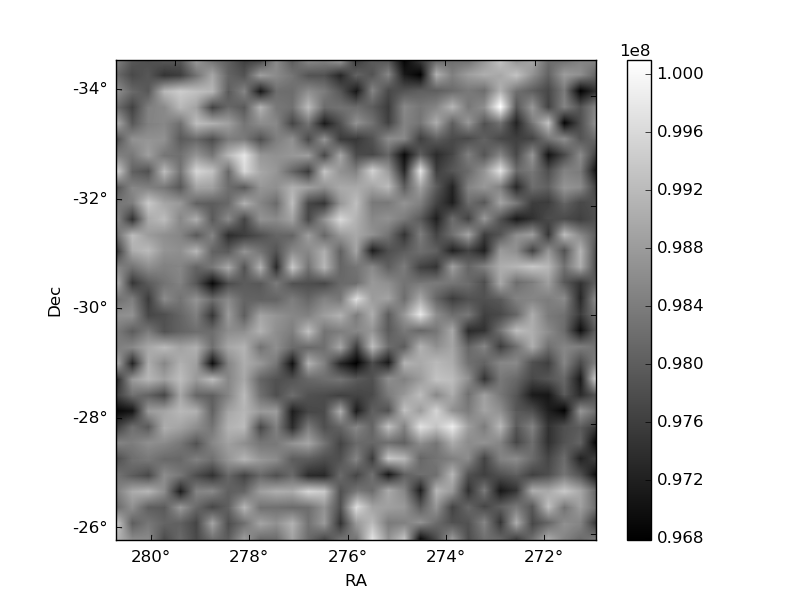
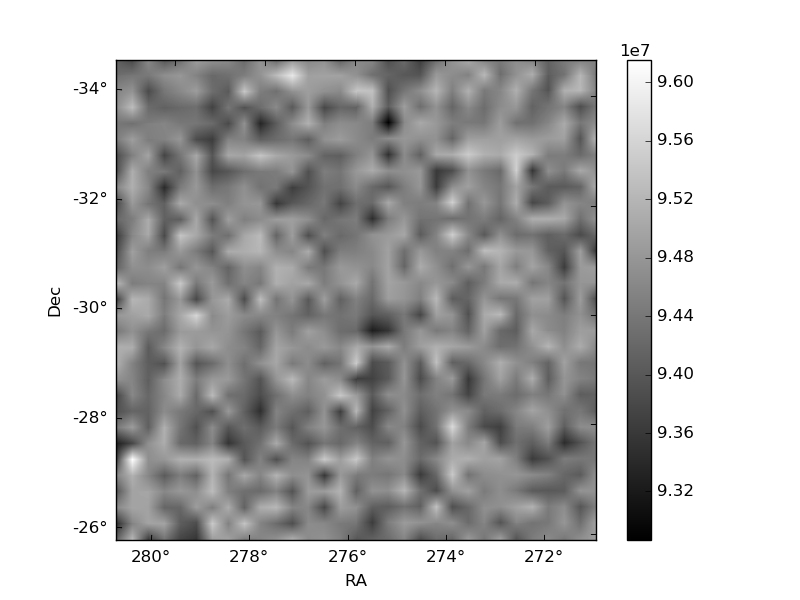
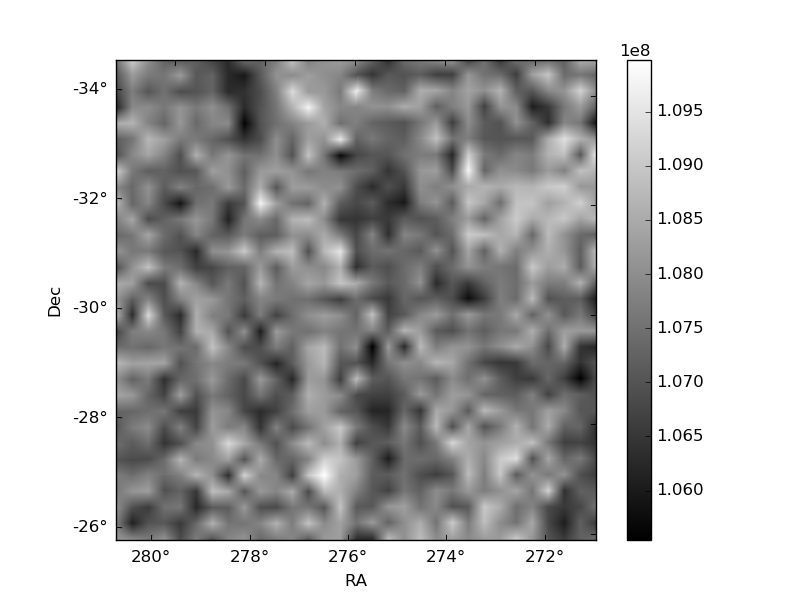
Histogram calculated using DETX and DETY for each event in the final _common_clean file
| Quadrant A | 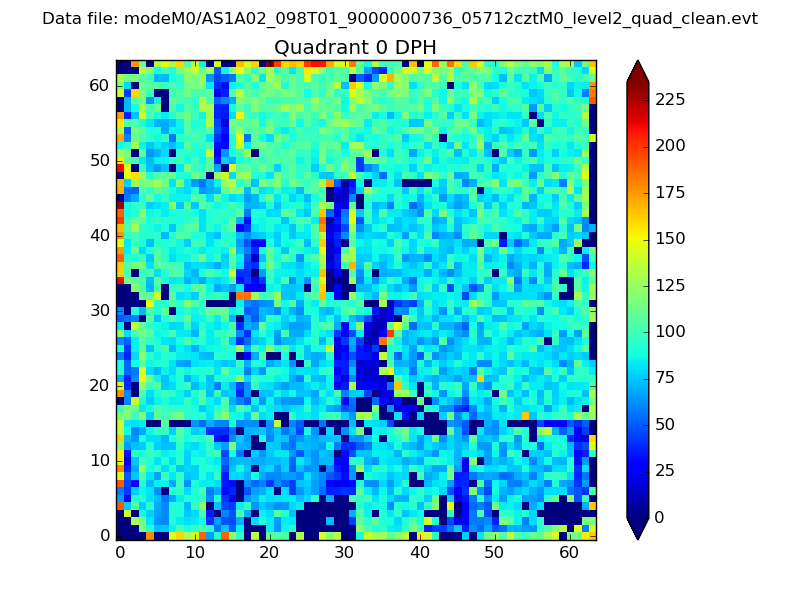 |
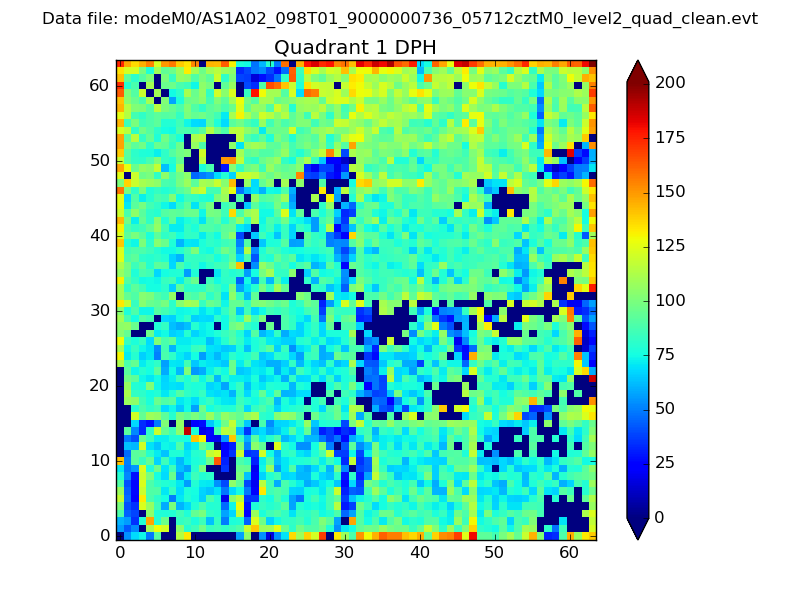 |
Quadrant B |
|---|---|---|---|
| Quadrant D | 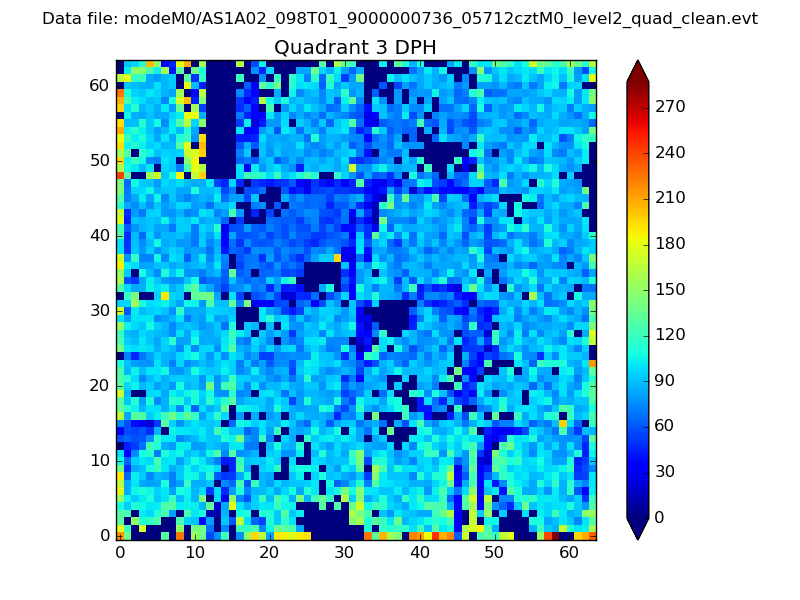 |
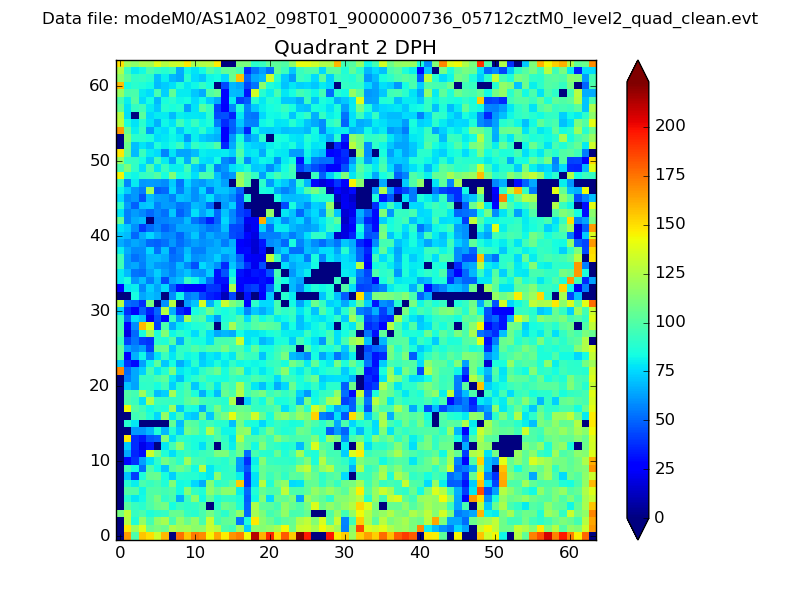 |
Quadrant C |
| Plot type | Count rate plots | Images |
|---|---|---|
| Comparison with Poisson distribution Blue bars denote a histogram of data divided into 1 sec bins. Red curve is a Poisson curve with rate = median count rate of data. |
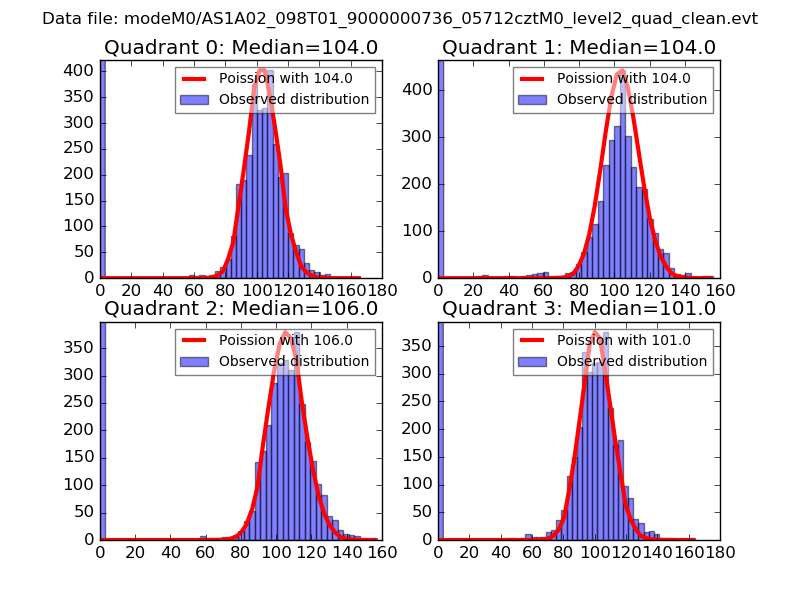 |
 |
| Quadrant-wise count rates Data is divided into 100 sec bins |
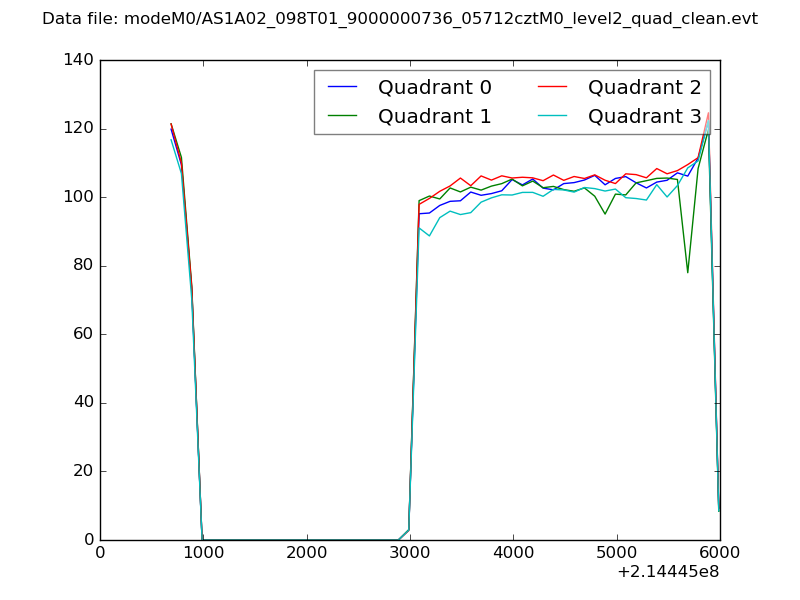 |
|
| Module-wise count rates for Quadrant A Data is divided into 100 sec bins |
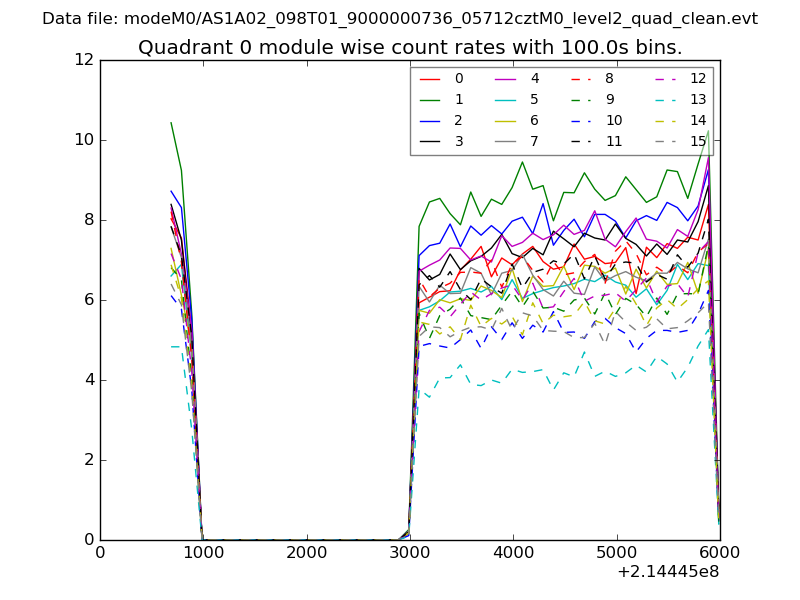 |
 |
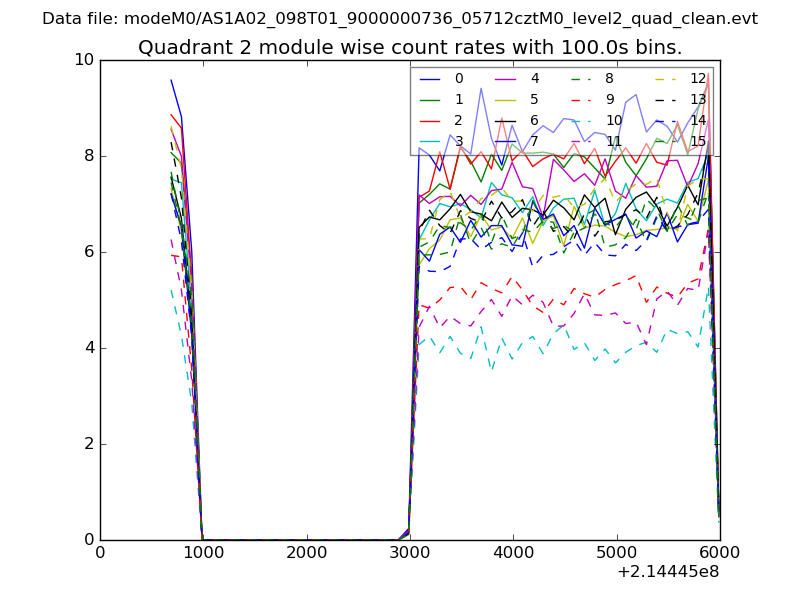
| Module-wise count rates for Quadrant B Data is divided into 100 sec bins |
 |
 |
| Module-wise count rates for Quadrant C Data is divided into 100 sec bins |
 |
 |
| Module-wise count rates for Quadrant D Data is divided into 100 sec bins |
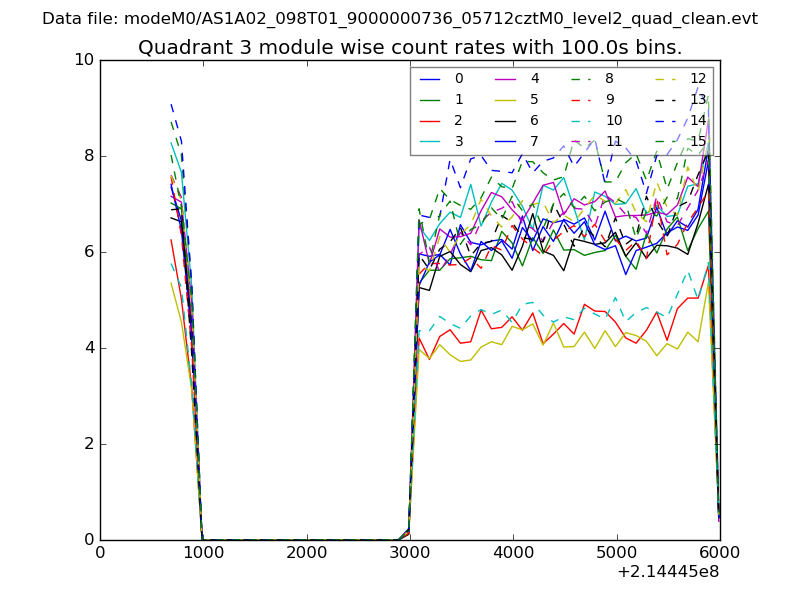 |
 |
| Parameter | Plot |
|---|---|
| CZT HV Monitor | 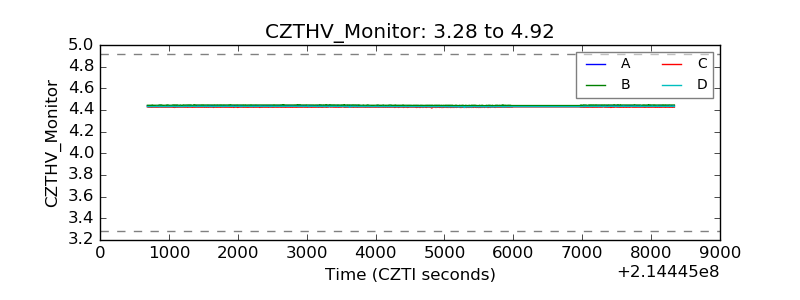 |
| D_VDD | 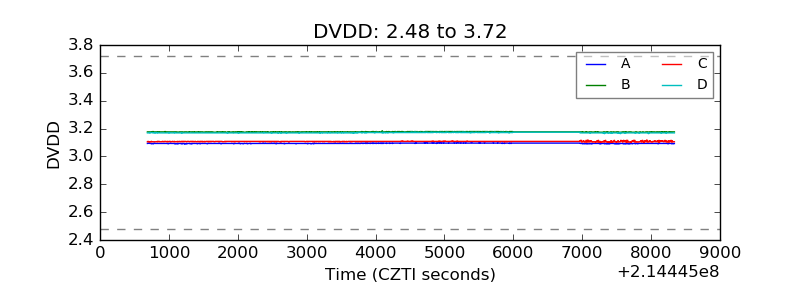 |
| Temperature 1 | 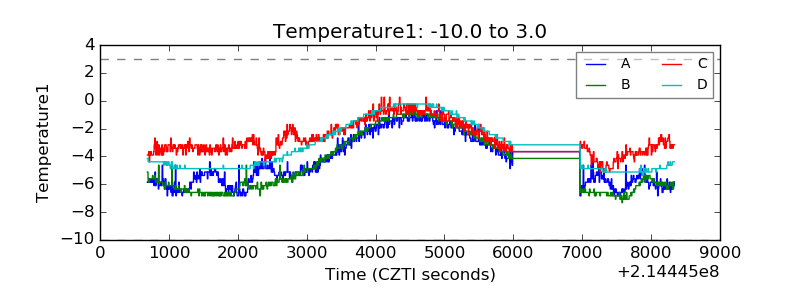 |
| Veto HV Monitor | 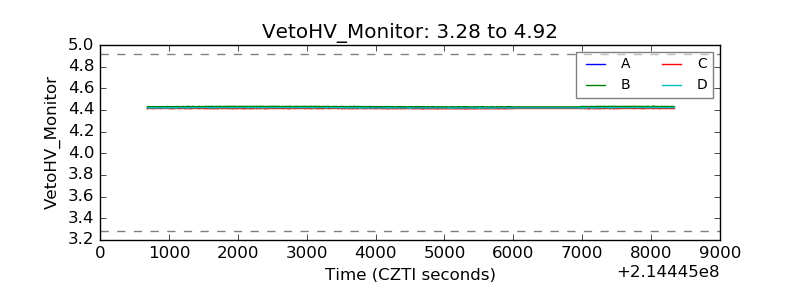 |
| Veto LLD | 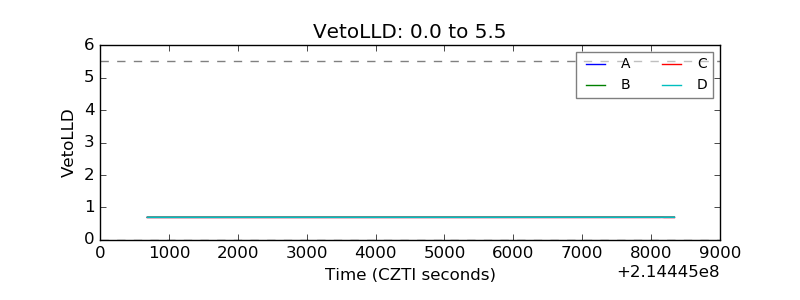 |
| Alpha Counter | 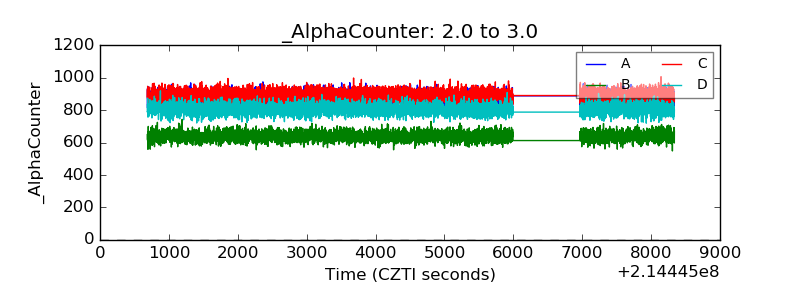 |
| _CPM_Rate | 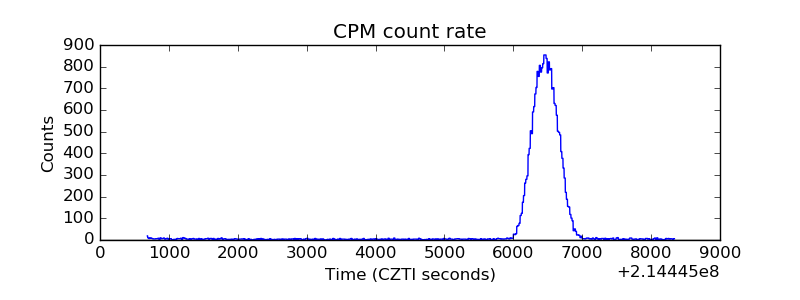 |
| CZT Counter | 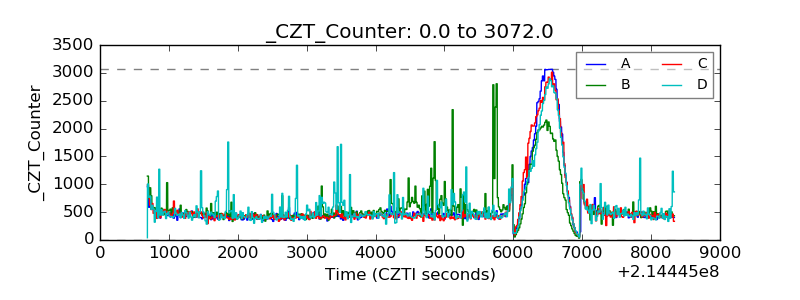 |
| +2.5 Volts monitor |  |
| +5 Volts monitor |  |
| _ROLL_ROT | 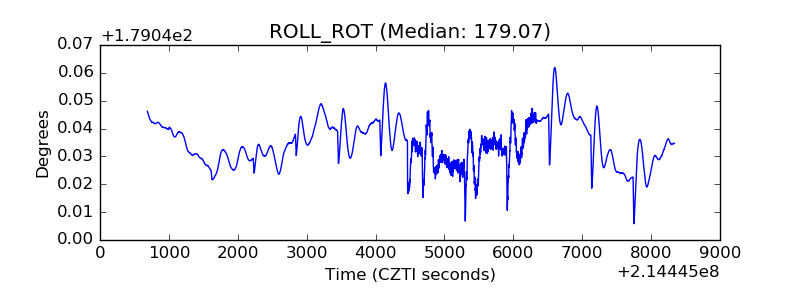 |
| _Roll_DEC | 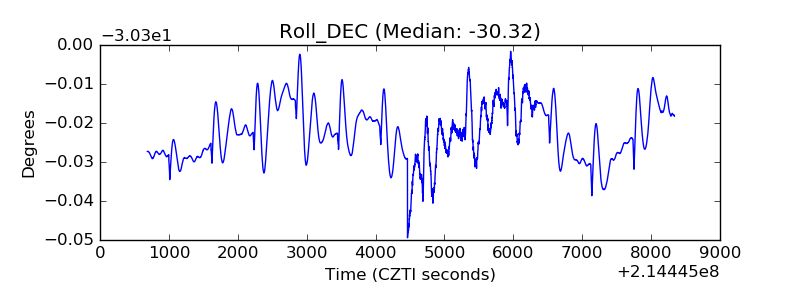 |
| _Roll_RA | 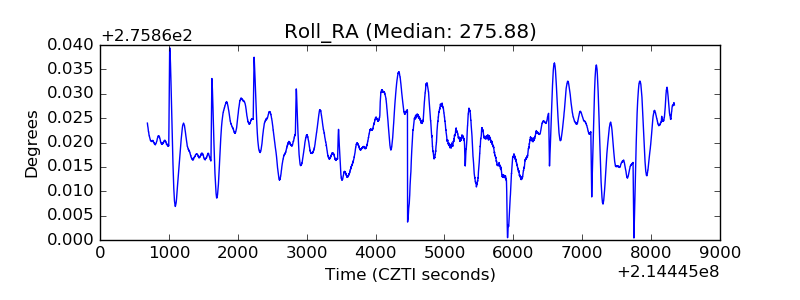 |
| Veto Counter | 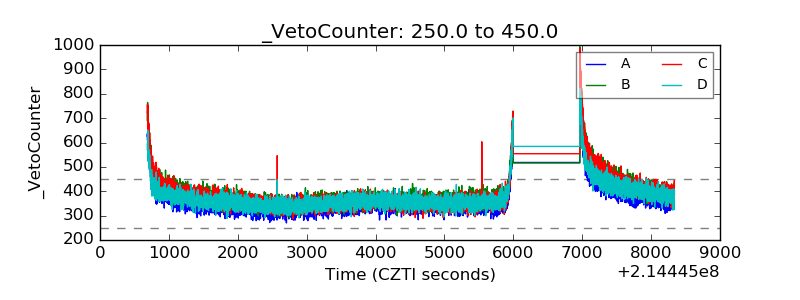 |