| Param | Original file | Final file |
|---|---|---|
| Filename | modeM0/AS1A02_098T01_9000000736_05714cztM0_level2.evt | modeM0/AS1A02_098T01_9000000736_05714cztM0_level2_quad_clean.evt |
| Size (bytes) | 443,030,400 | 59,270,400 |
| Size | 422.5 MB | 56.5 MB |
| Events in quadrant A | 3,020,888 | 336,601 |
| Events in quadrant B | 3,602,911 | 334,028 |
| Events in quadrant C | 3,019,121 | 343,436 |
| Events in quadrant D | 3,333,557 | 328,213 |
| Mode SS | |||
|---|---|---|---|
| Quadrant | BADHDUFLAG | Total packets | Discarded packets |
| A | 0 | 132 | 0 |
| B | 0 | 132 | 0 |
| C | 0 | 132 | 0 |
| D | 0 | 132 | 0 |
| Mode M0 | |||
|---|---|---|---|
| Quadrant | BADHDUFLAG | Total packets | Discarded packets |
| A | 0 | 13311 | 3 |
| B | 0 | 14797 | 2 |
| C | 0 | 13341 | 2 |
| D | 0 | 14303 | 2 |
| Mode M9 | |||
|---|---|---|---|
| Quadrant | BADHDUFLAG | Total packets | Discarded packets |
| A | 0 | 14 | 0 |
| B | 0 | 14 | 0 |
| C | 0 | 14 | 0 |
| D | 0 | 15 | 0 |
| Quadrant | Total seconds | Saturated seconds | Saturation percentage |
|---|---|---|---|
| A | 6479 | 64 | 0.987807% |
| B | 6479 | 166 | 2.562124% |
| C | 6479 | 61 | 0.941503% |
| D | 6479 | 103 | 1.589752% |
Noise dominated data is calculated using 1-second bins in cleaned event files. If a bin has >2000 counts, and if more than 50% of those come from <1% of pixels, then it is considered to be noise-dominated and hence unusable.
| Quadrant | # 1 sec bins | Bins with >0 counts | Bins with >2000 counts | High rate bins dominated by noise | Noise dominated (total time) | Noise dominated (detector-on time) | Marked lightcurve |
|---|---|---|---|---|---|---|---|
| A | 7600 | 6480 | 0 | 0 | 0.00% | 0.00% | 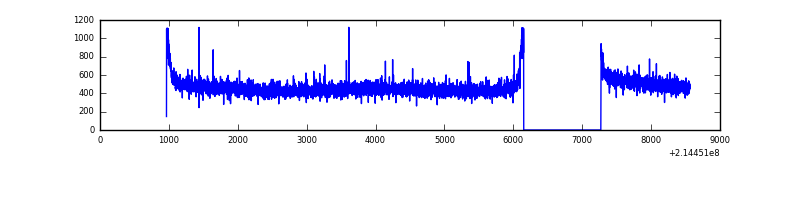 |
| B | 7600 | 6480 | 85 | 85 | 1.12% | 1.31% | 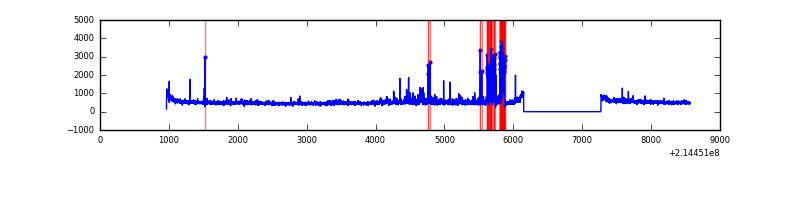 |
| C | 7600 | 6480 | 0 | 0 | 0.00% | 0.00% |  |
| D | 7600 | 6480 | 27 | 27 | 0.36% | 0.42% | 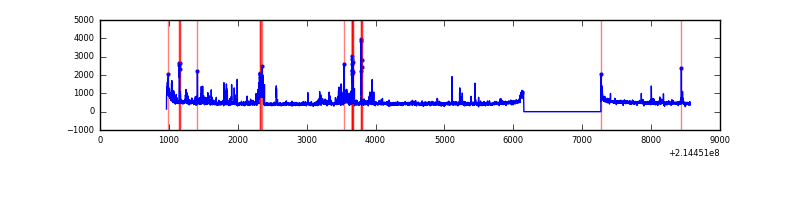 |
Top three noisy pixels from each quadrant. If the there are fewer than three noisy pixels in the level2.evt file, extra rows are filled as -1
| Pixel properties | Quadrant properties | ||||||
|---|---|---|---|---|---|---|---|
| Quadrant | DetID | PixID | Counts | Sigma | Mean | Median | Sigma |
| A | 0 | 226 | 7621 | 42.94 | 782 | 764 | 159.7 |
| A | 12 | 194 | 7474 | 42.01 | 782 | 764 | 159.7 |
| A | 0 | 50 | 3566 | 17.54 | 782 | 764 | 159.7 |
| B | 5 | 143 | 245563 | 1639.61 | 787 | 769 | 149.3 |
| B | 15 | 204 | 162763 | 1085.02 | 787 | 769 | 149.3 |
| B | 11 | 51 | 53277 | 351.69 | 787 | 769 | 149.3 |
| C | 8 | 128 | 13565 | 72.1 | 764 | 767 | 177.5 |
| C | 9 | 16 | 6887 | 34.48 | 764 | 767 | 177.5 |
| C | 8 | 112 | 6884 | 34.46 | 764 | 767 | 177.5 |
| D | 2 | 152 | 267812 | 1438.3 | 757 | 734 | 185.7 |
| D | 12 | 233 | 45005 | 238.41 | 757 | 734 | 185.7 |
| D | 2 | 14 | 38020 | 200.8 | 757 | 734 | 185.7 |
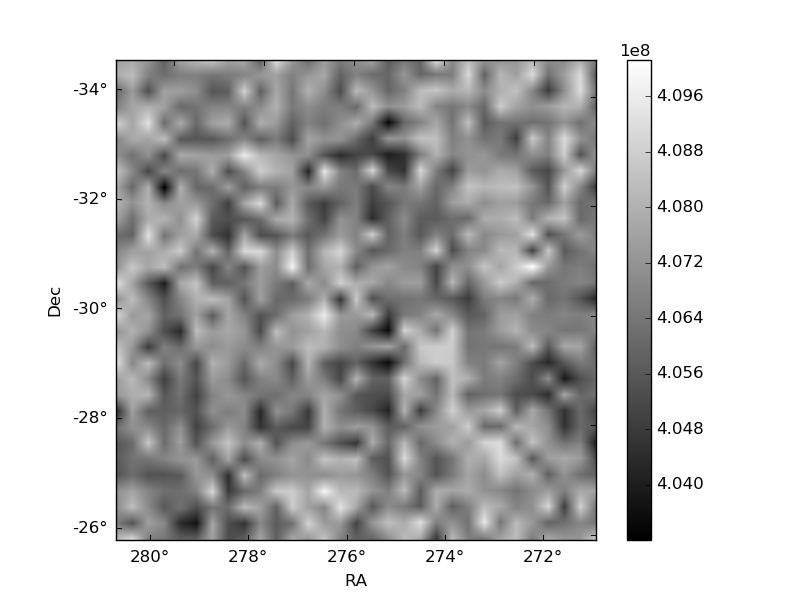
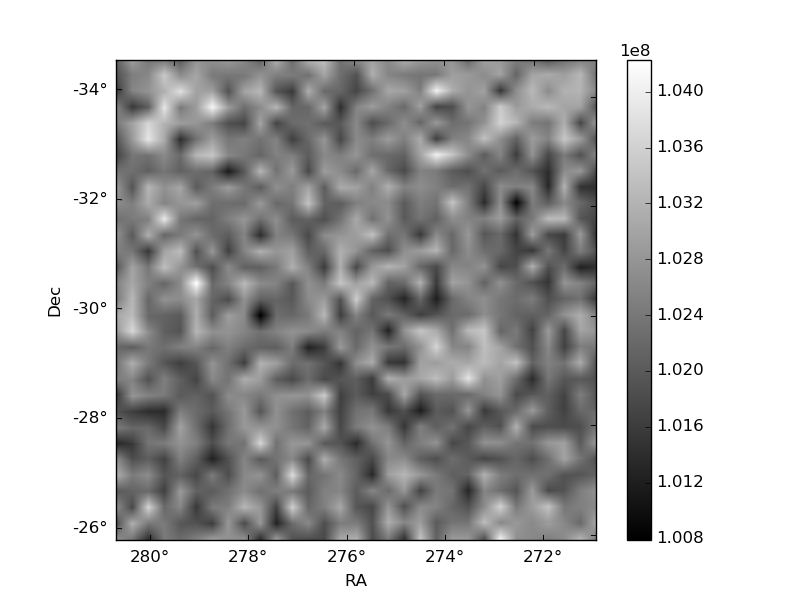
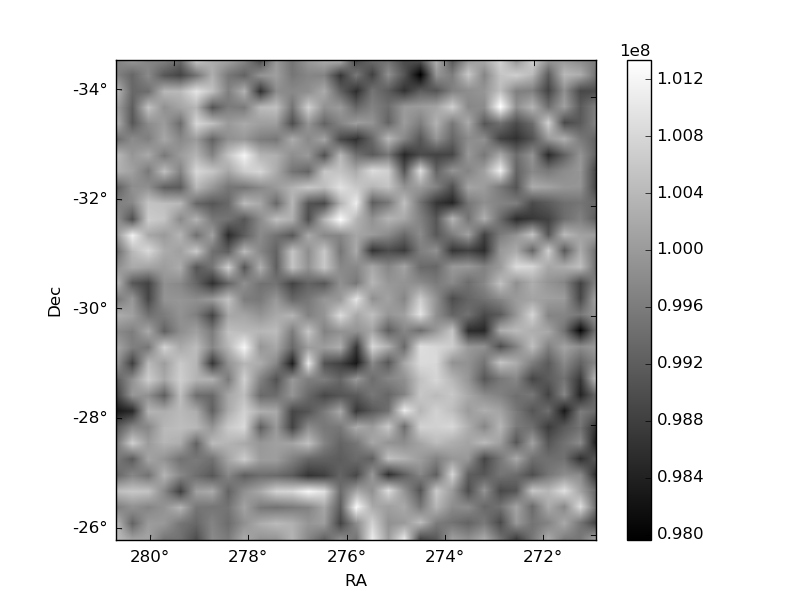
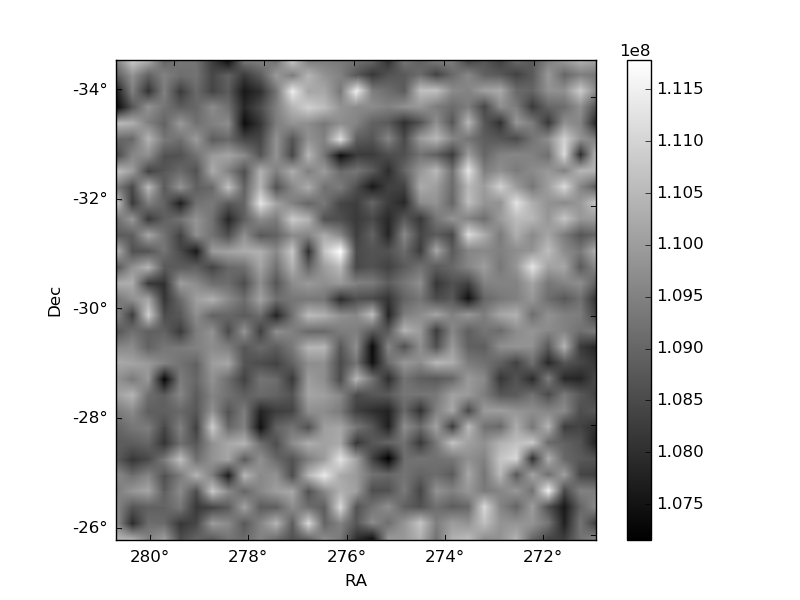
Histogram calculated using DETX and DETY for each event in the final _common_clean file
| Quadrant A | 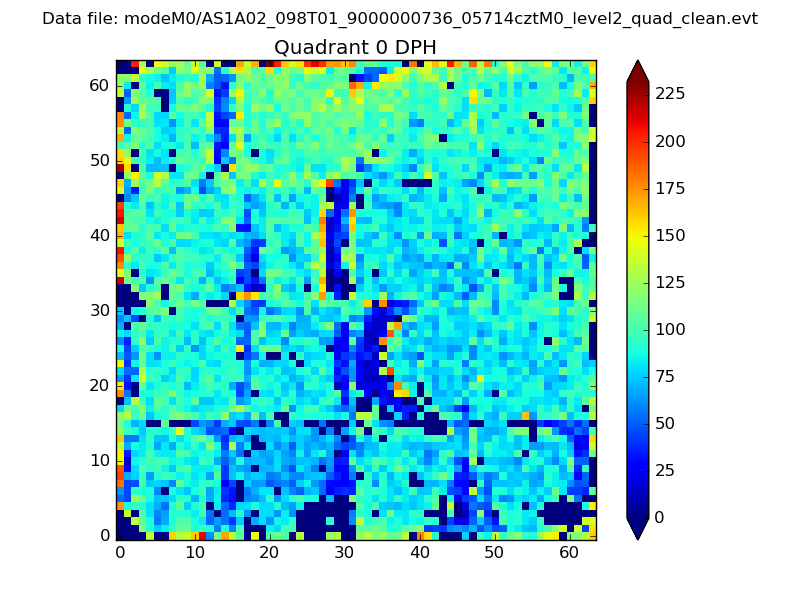 |
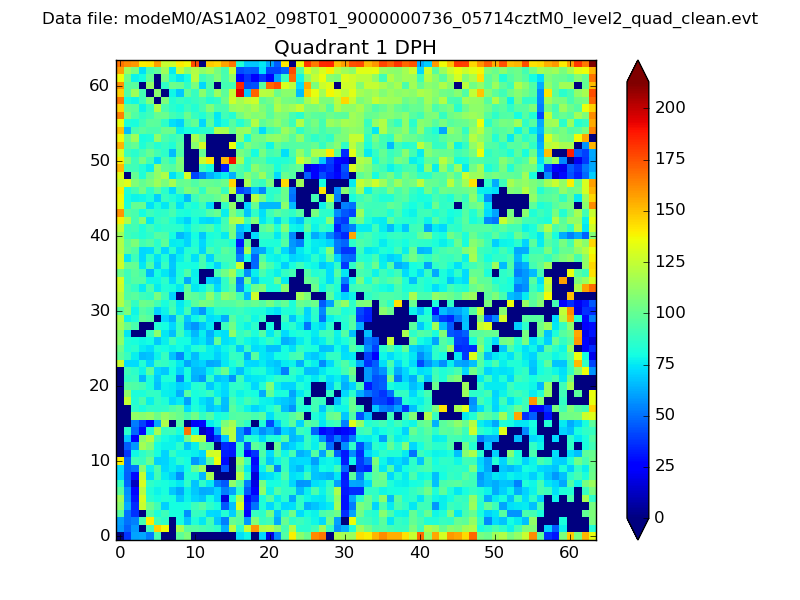 |
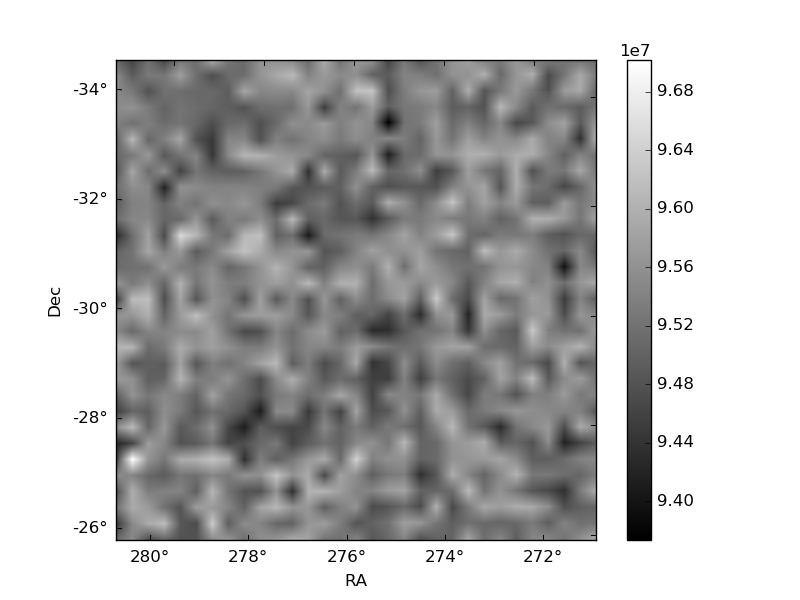
Quadrant B |
|---|---|---|---|
| Quadrant D | 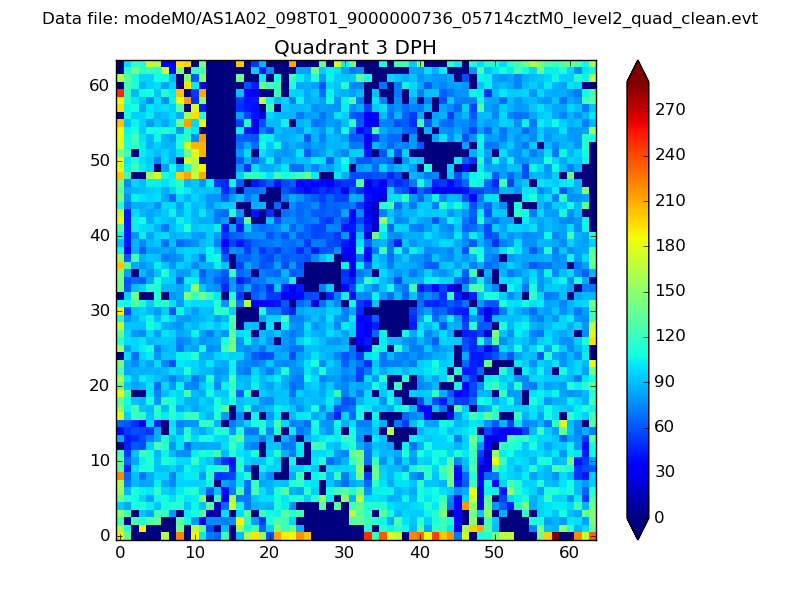 |
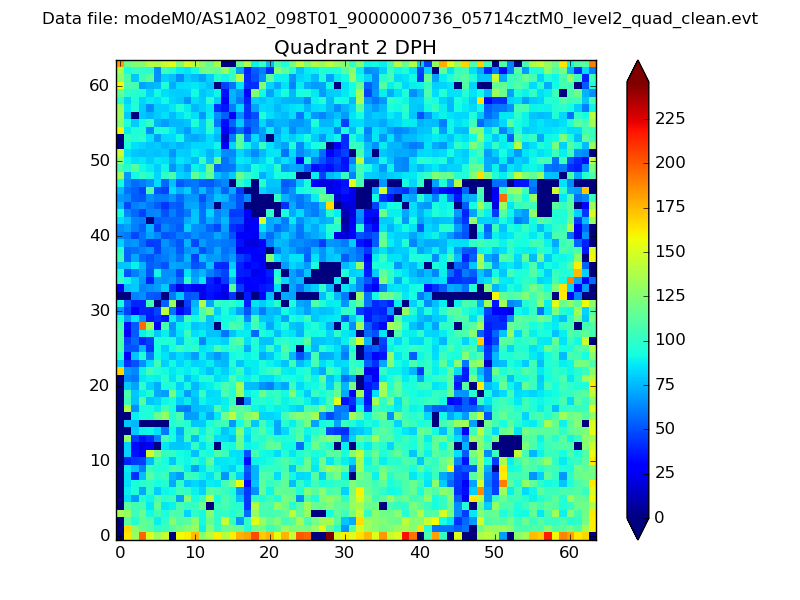 |
Quadrant C |
| Plot type | Count rate plots | Images |
|---|---|---|
| Comparison with Poisson distribution Blue bars denote a histogram of data divided into 1 sec bins. Red curve is a Poisson curve with rate = median count rate of data. |
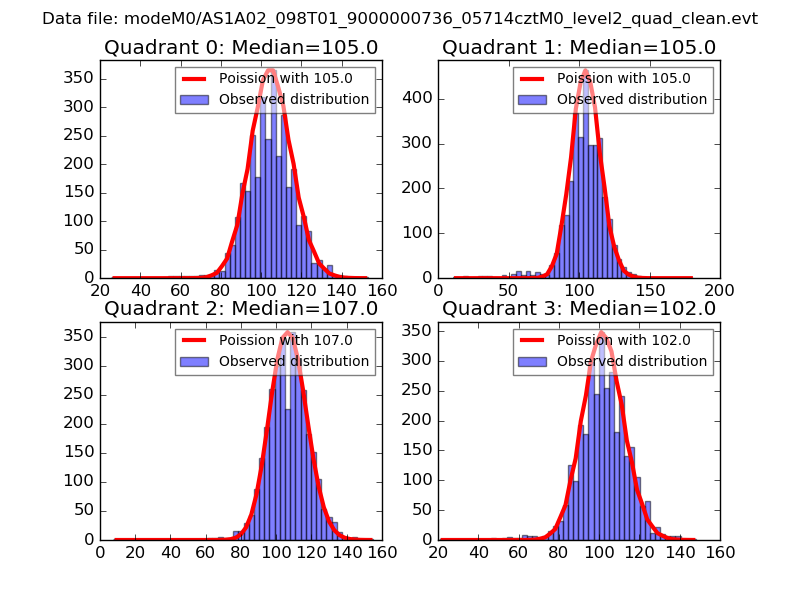 |
 |
| Quadrant-wise count rates Data is divided into 100 sec bins |
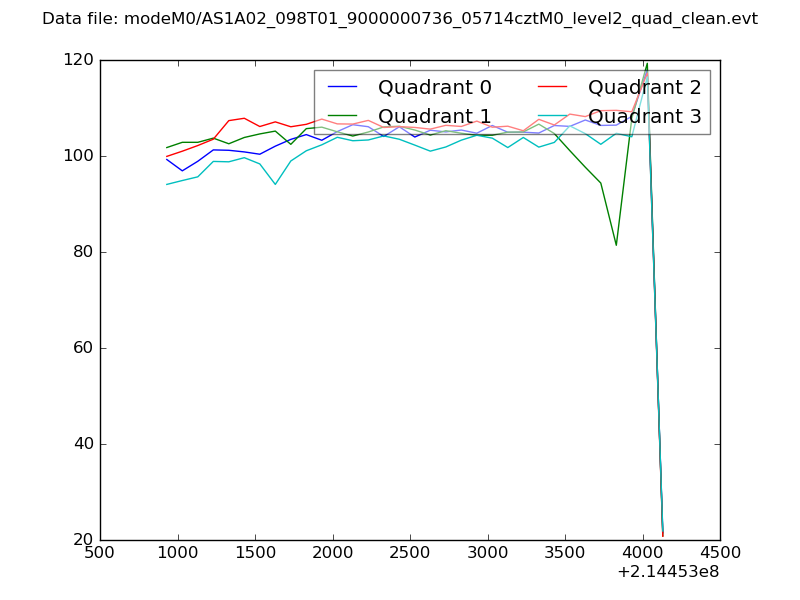 |
|
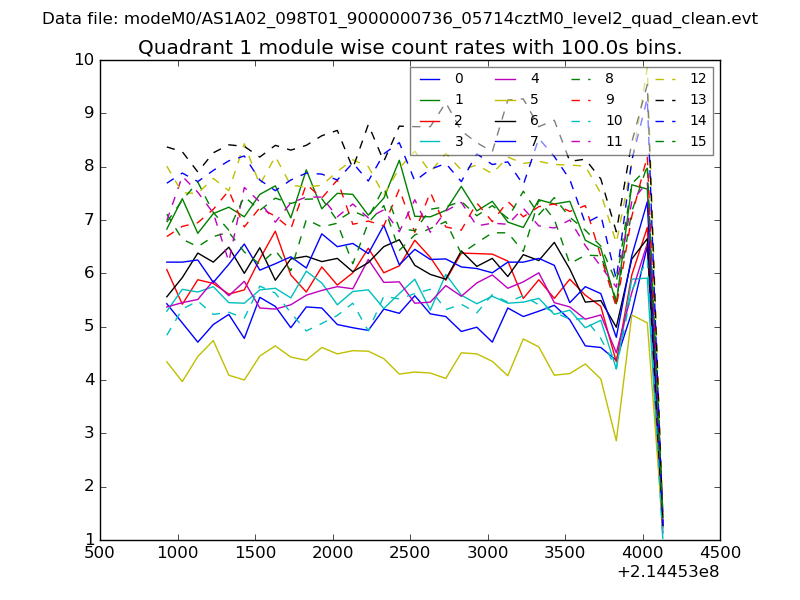
| Module-wise count rates for Quadrant A Data is divided into 100 sec bins |
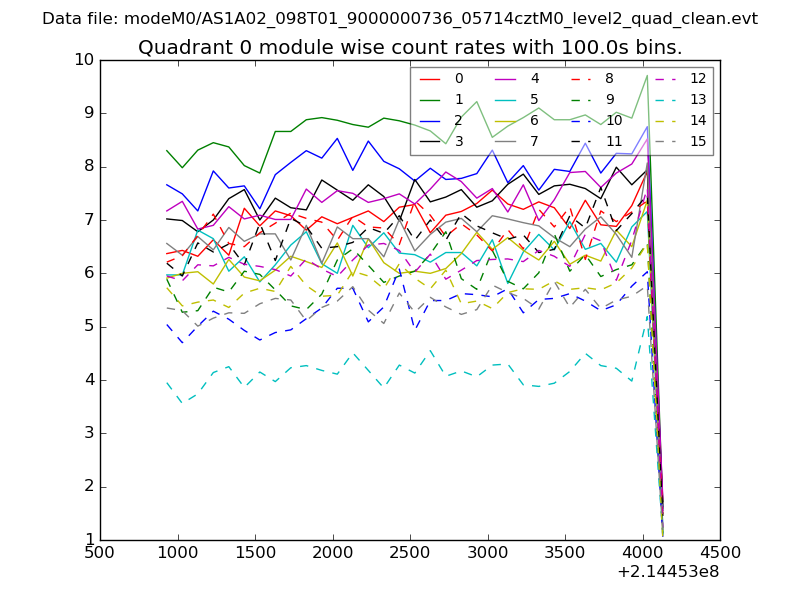 |
 |
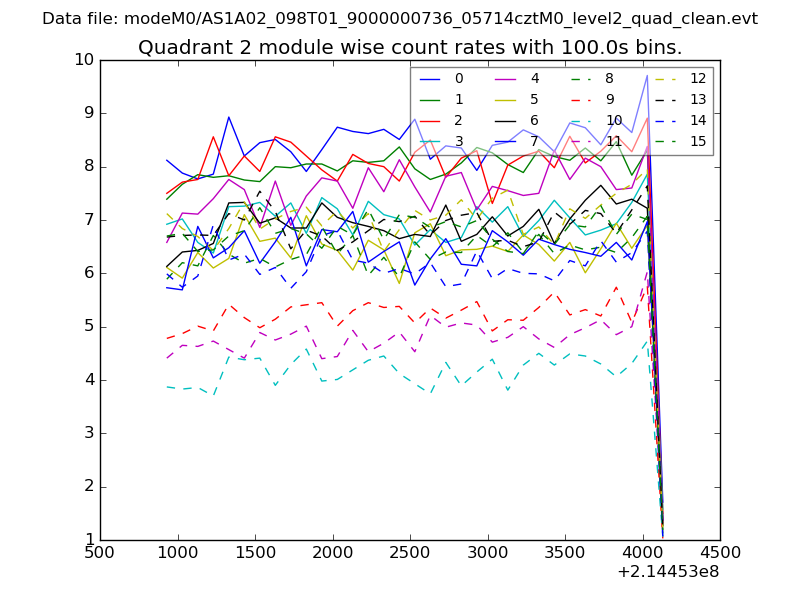
| Module-wise count rates for Quadrant B Data is divided into 100 sec bins |
 |
 |
| Module-wise count rates for Quadrant C Data is divided into 100 sec bins |
 |
 |
| Module-wise count rates for Quadrant D Data is divided into 100 sec bins |
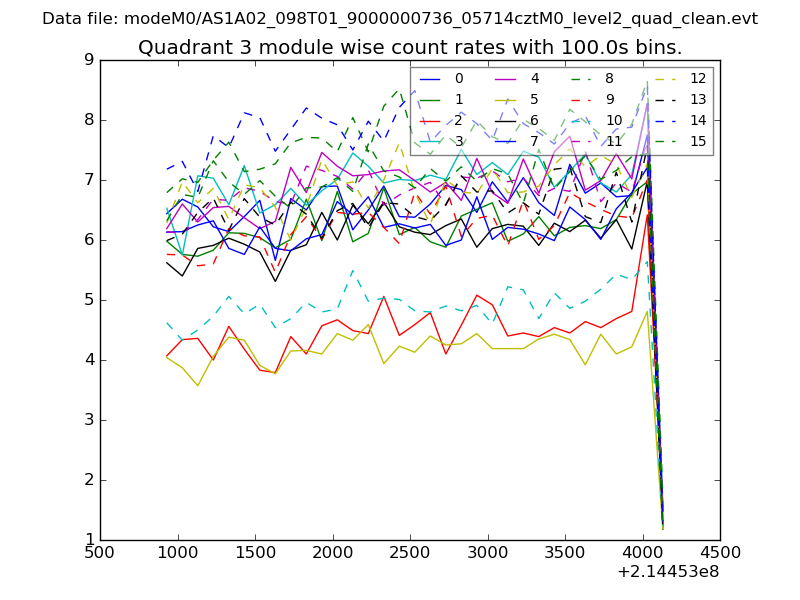 |
 |
| Parameter | Plot |
|---|---|
| CZT HV Monitor | 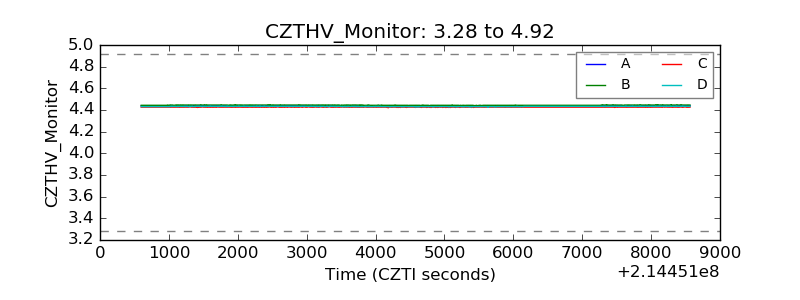 |
| D_VDD | 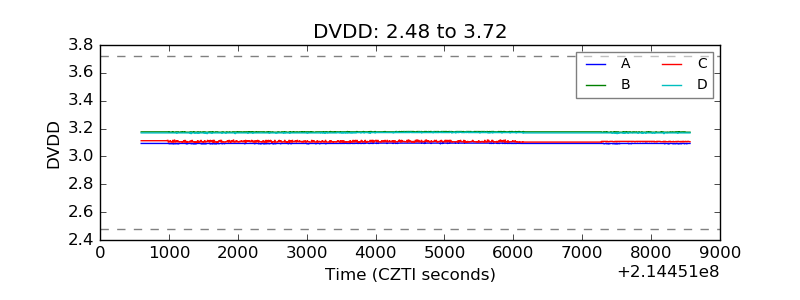 |
| Temperature 1 | 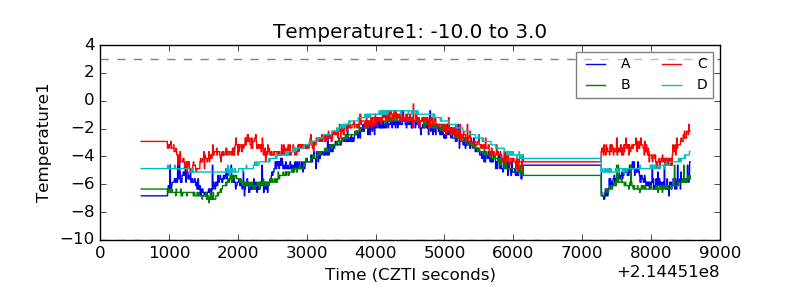 |
| Veto HV Monitor | 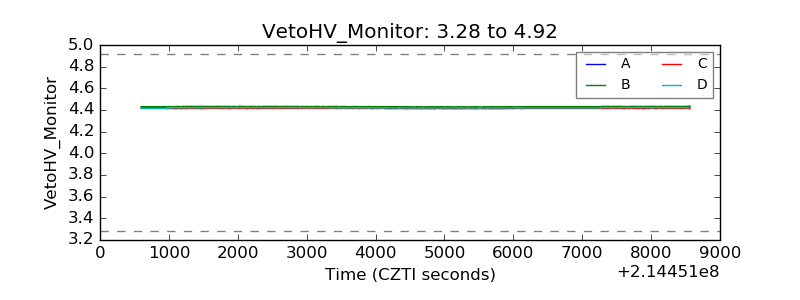 |
| Veto LLD | 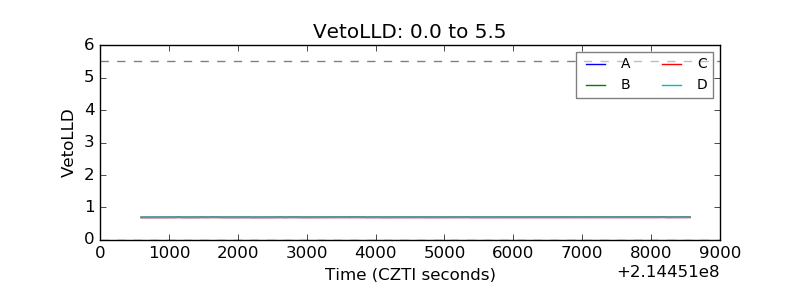 |
| Alpha Counter | 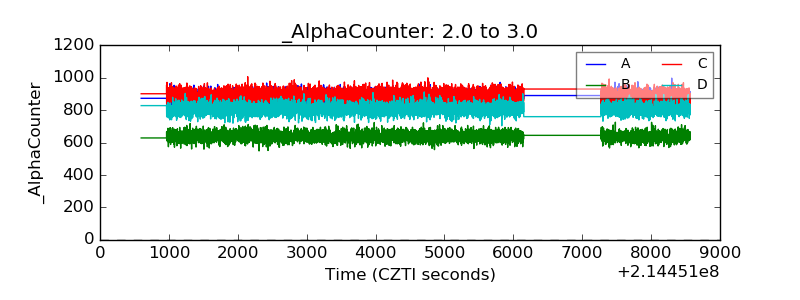 |
| _CPM_Rate | 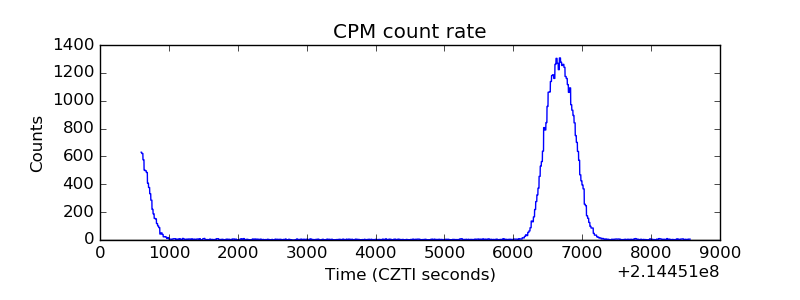 |
| CZT Counter |  |
| +2.5 Volts monitor |  |
| +5 Volts monitor |  |
| _ROLL_ROT | 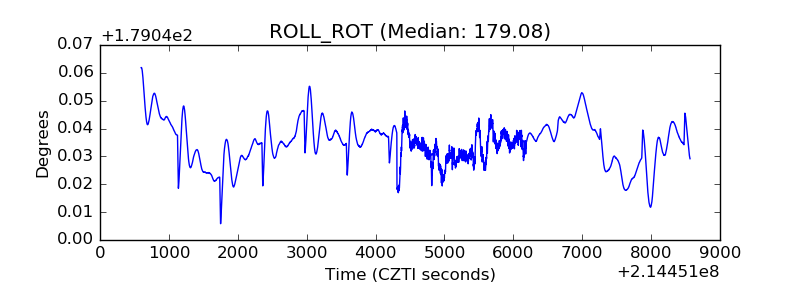 |
| _Roll_DEC | 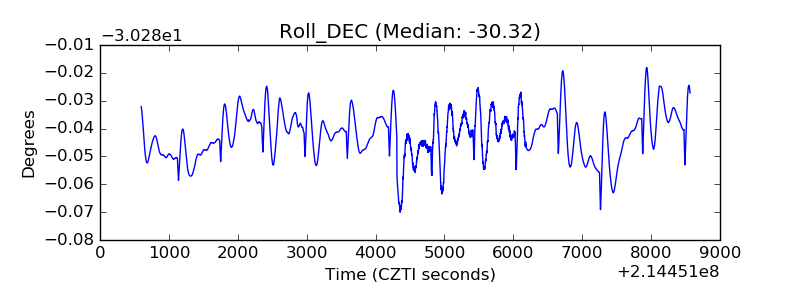 |
| _Roll_RA | 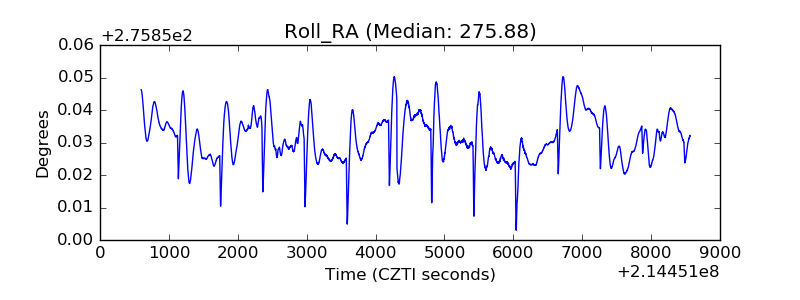 |
| Veto Counter | 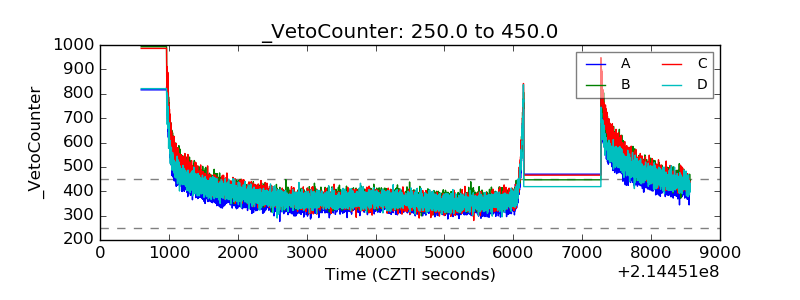 |