| Param | Original file | Final file |
|---|---|---|
| Filename | modeM0/AS1A02_098T01_9000000736_05716cztM0_level2.evt | modeM0/AS1A02_098T01_9000000736_05716cztM0_level2_quad_clean.evt |
| Size (bytes) | 516,481,920 | 85,757,760 |
| Size | 492.6 MB | 81.8 MB |
| Events in quadrant A | 3,335,669 | 537,807 |
| Events in quadrant B | 3,693,391 | 542,793 |
| Events in quadrant C | 3,761,609 | 542,717 |
| Events in quadrant D | 4,402,601 | 512,910 |
| Mode SS | |||
|---|---|---|---|
| Quadrant | BADHDUFLAG | Total packets | Discarded packets |
| A | 0 | 138 | 0 |
| B | 0 | 138 | 0 |
| C | 0 | 138 | 0 |
| D | 0 | 138 | 0 |
| Mode M0 | |||
|---|---|---|---|
| Quadrant | BADHDUFLAG | Total packets | Discarded packets |
| A | 0 | 14012 | 3 |
| B | 0 | 14920 | 2 |
| C | 0 | 15356 | 2 |
| D | 0 | 17444 | 2 |
| Mode M9 | |||
|---|---|---|---|
| Quadrant | BADHDUFLAG | Total packets | Discarded packets |
| A | 0 | 24 | 0 |
| B | 0 | 24 | 0 |
| C | 0 | 24 | 0 |
| D | 0 | 24 | 0 |
| Quadrant | Total seconds | Saturated seconds | Saturation percentage |
|---|---|---|---|
| A | 6599 | 139 | 2.106380% |
| B | 6599 | 153 | 2.318533% |
| C | 6599 | 287 | 4.349144% |
| D | 6599 | 362 | 5.485680% |
Noise dominated data is calculated using 1-second bins in cleaned event files. If a bin has >2000 counts, and if more than 50% of those come from <1% of pixels, then it is considered to be noise-dominated and hence unusable.
| Quadrant | # 1 sec bins | Bins with >0 counts | Bins with >2000 counts | High rate bins dominated by noise | Noise dominated (total time) | Noise dominated (detector-on time) | Marked lightcurve |
|---|---|---|---|---|---|---|---|
| A | 9079 | 6600 | 0 | 0 | 0.00% | 0.00% | 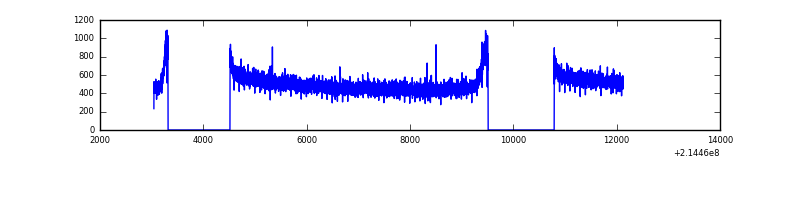 |
| B | 9079 | 6599 | 3 | 3 | 0.03% | 0.05% | 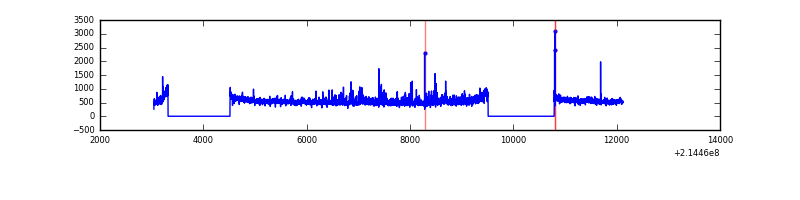 |
| C | 9079 | 6600 | 123 | 123 | 1.35% | 1.86% | 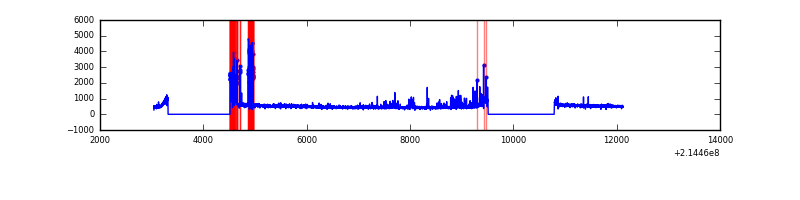 |
| D | 9079 | 6600 | 184 | 184 | 2.03% | 2.79% | 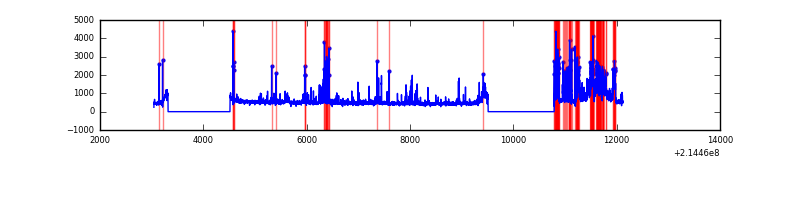 |
Top three noisy pixels from each quadrant. If the there are fewer than three noisy pixels in the level2.evt file, extra rows are filled as -1
| Pixel properties | Quadrant properties | ||||||
|---|---|---|---|---|---|---|---|
| Quadrant | DetID | PixID | Counts | Sigma | Mean | Median | Sigma |
| A | 12 | 194 | 8392 | 43.14 | 865 | 848 | 174.9 |
| A | 0 | 226 | 8374 | 43.04 | 865 | 848 | 174.9 |
| A | 13 | 14 | 4491 | 20.83 | 865 | 848 | 174.9 |
| B | 15 | 204 | 212856 | 1296.49 | 865 | 847 | 163.5 |
| B | 11 | 51 | 54241 | 326.52 | 865 | 847 | 163.5 |
| B | 4 | 80 | 30725 | 182.71 | 865 | 847 | 163.5 |
| C | 9 | 16 | 536690 | 2823.33 | 824 | 829 | 189.8 |
| C | 14 | 67 | 7372 | 34.47 | 824 | 829 | 189.8 |
| C | 13 | 61 | 6484 | 29.79 | 824 | 829 | 189.8 |
| D | 2 | 152 | 927857 | 4588.87 | 833 | 809 | 202.0 |
| D | 12 | 233 | 150639 | 741.65 | 833 | 809 | 202.0 |
| D | 8 | 195 | 39354 | 190.79 | 833 | 809 | 202.0 |
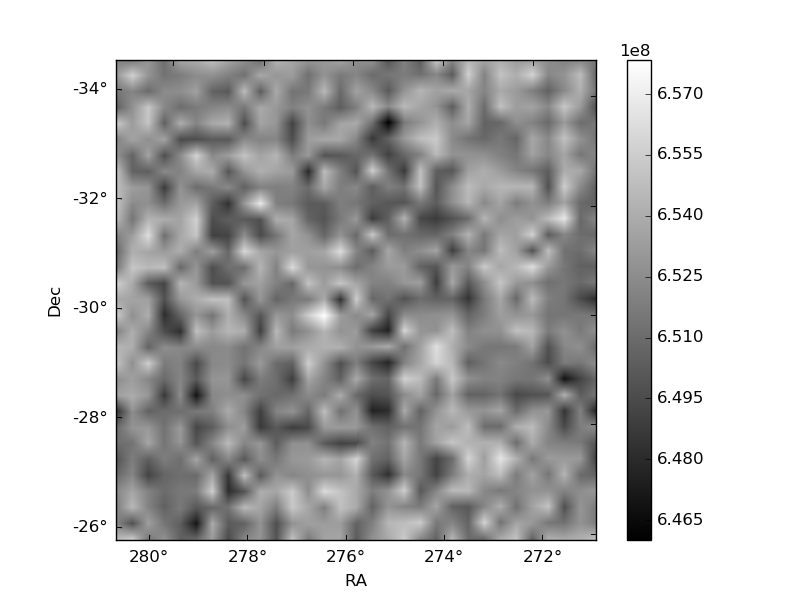
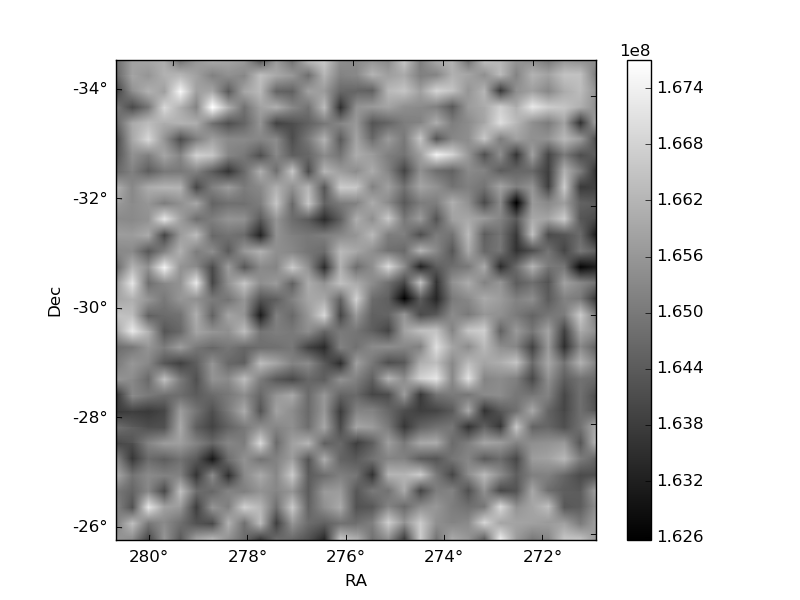
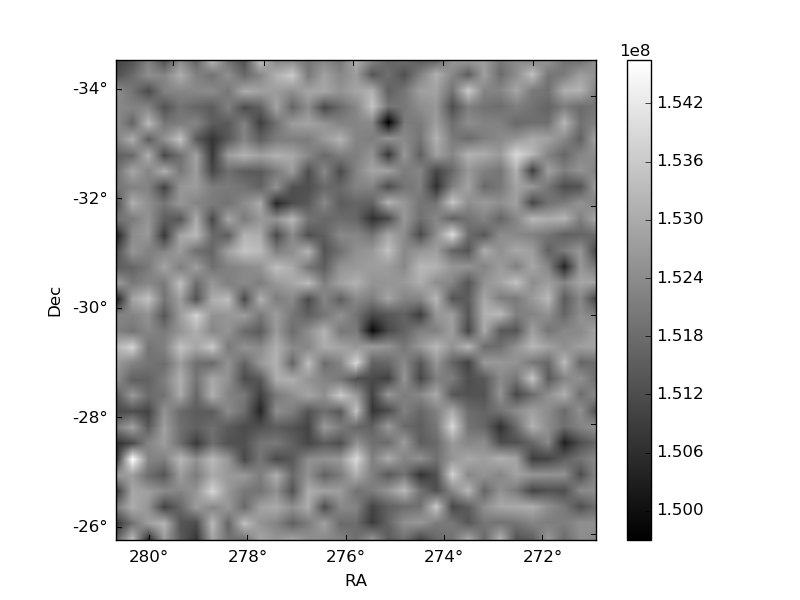
Histogram calculated using DETX and DETY for each event in the final _common_clean file
| Quadrant A | 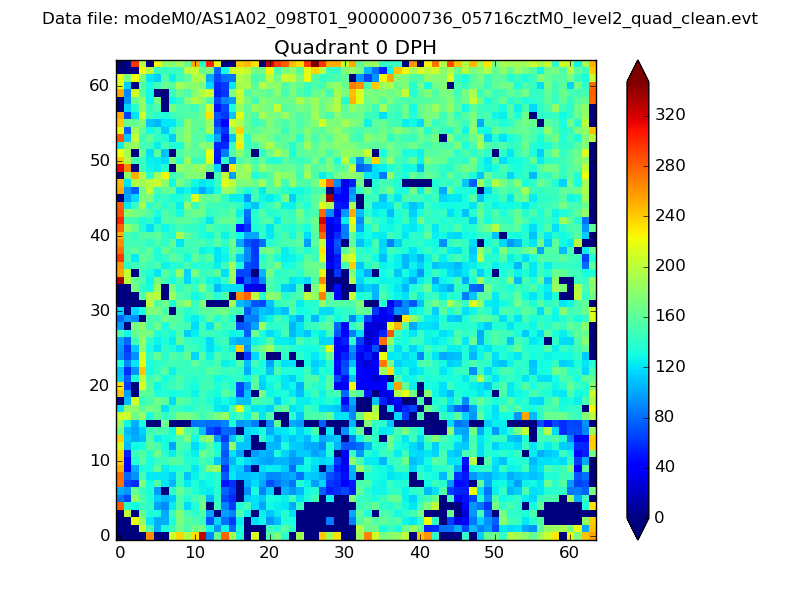 |
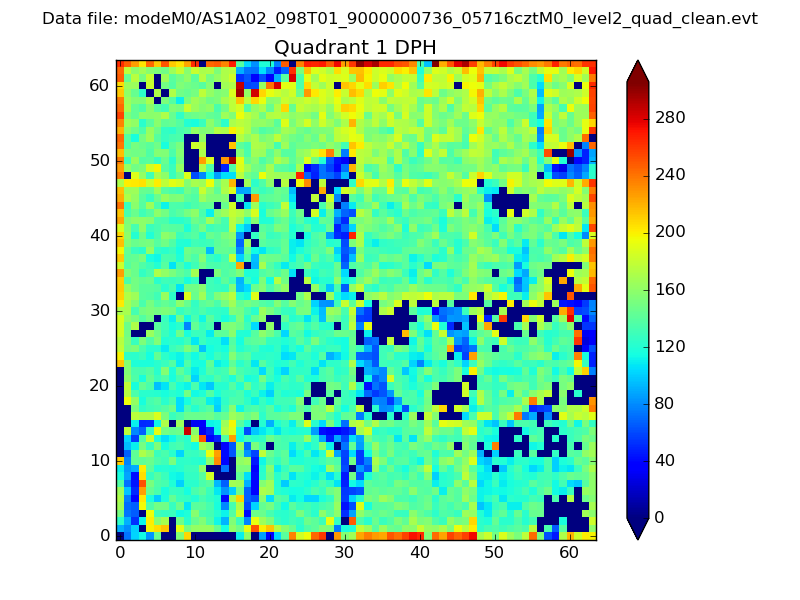 |
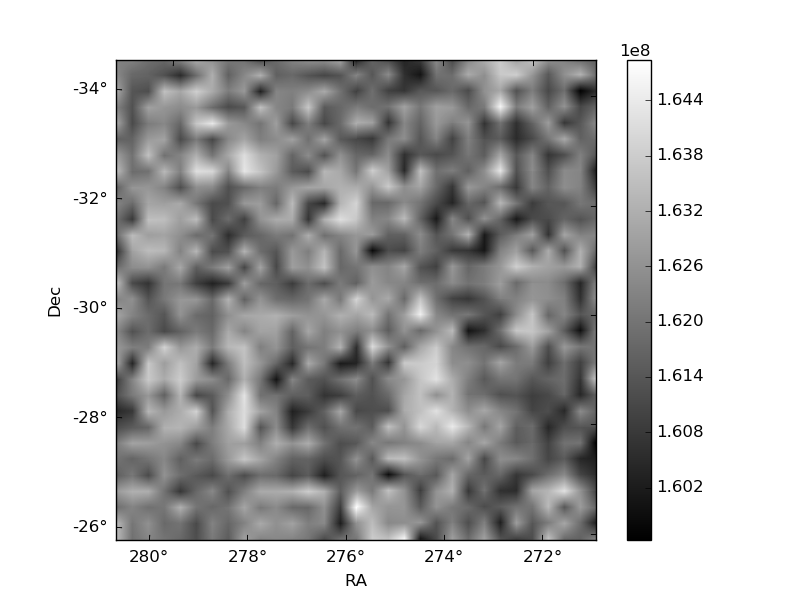
Quadrant B |
|---|---|---|---|
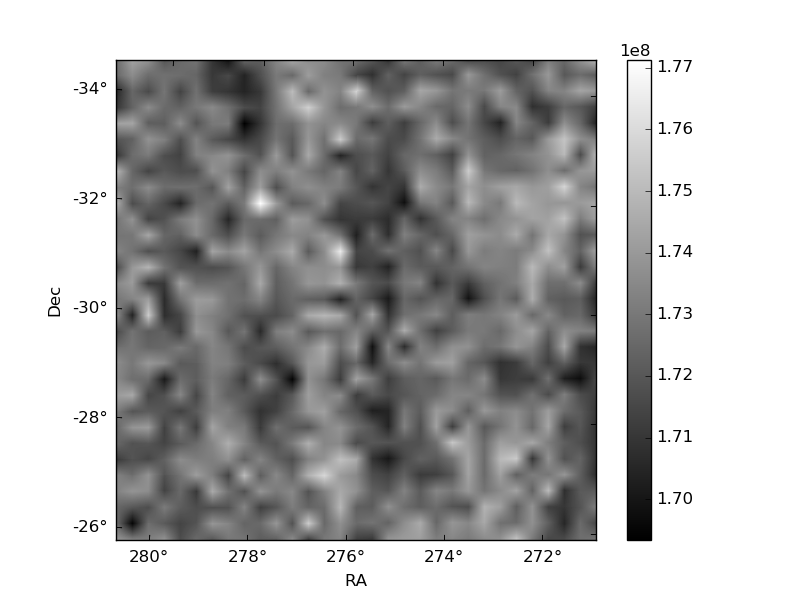
| Quadrant D | 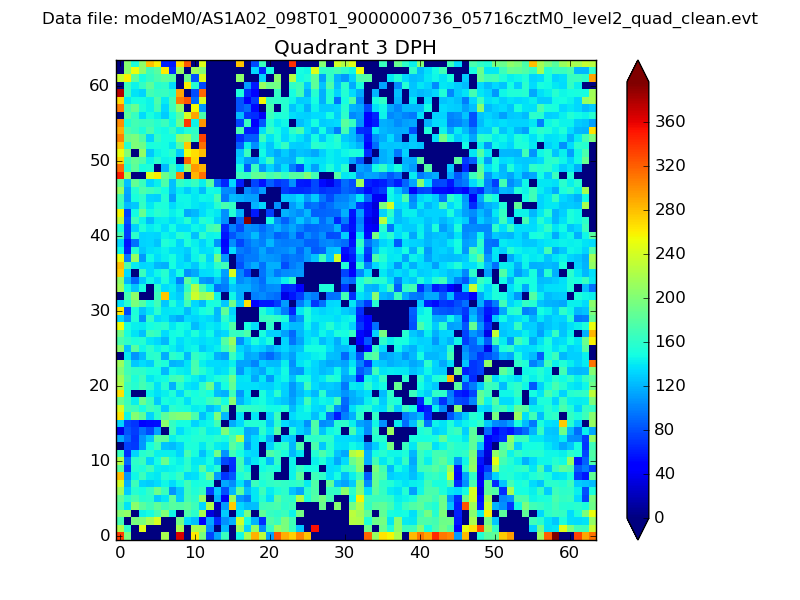 |
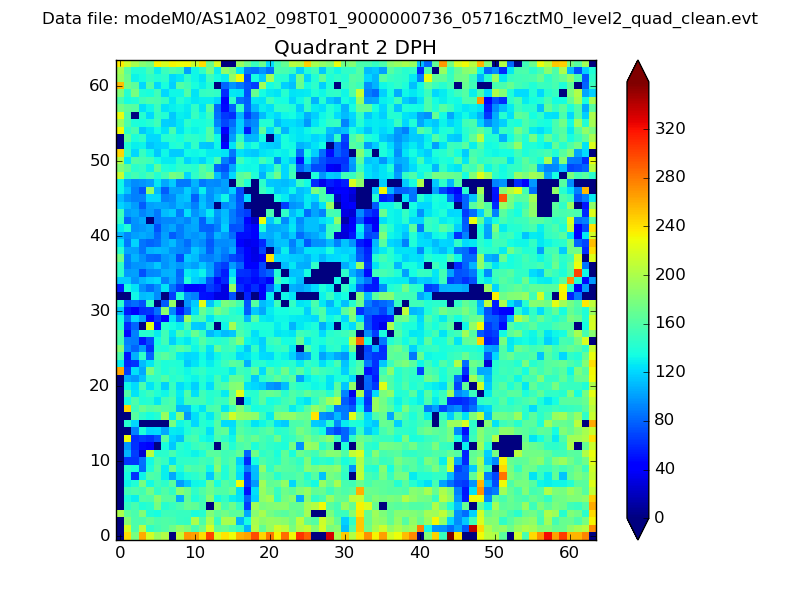 |
Quadrant C |
| Plot type | Count rate plots | Images |
|---|---|---|
| Comparison with Poisson distribution Blue bars denote a histogram of data divided into 1 sec bins. Red curve is a Poisson curve with rate = median count rate of data. |
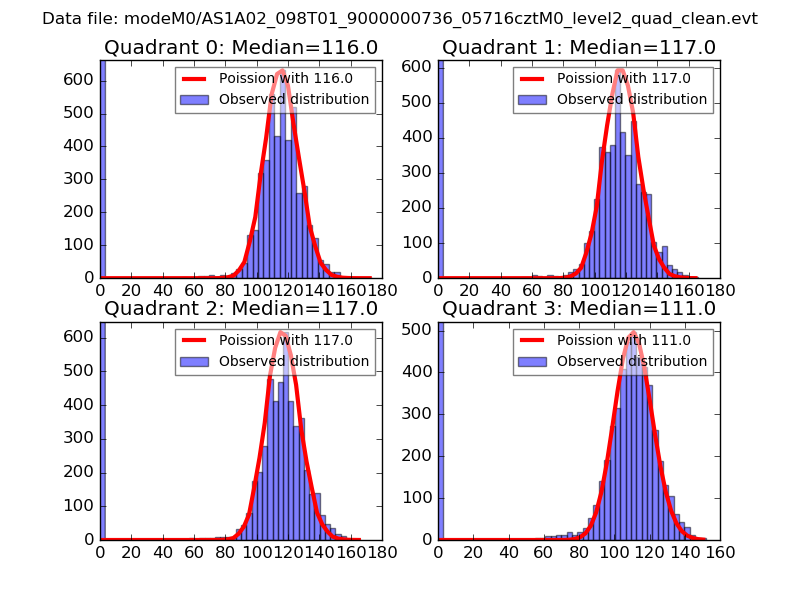 |
 |
| Quadrant-wise count rates Data is divided into 100 sec bins |
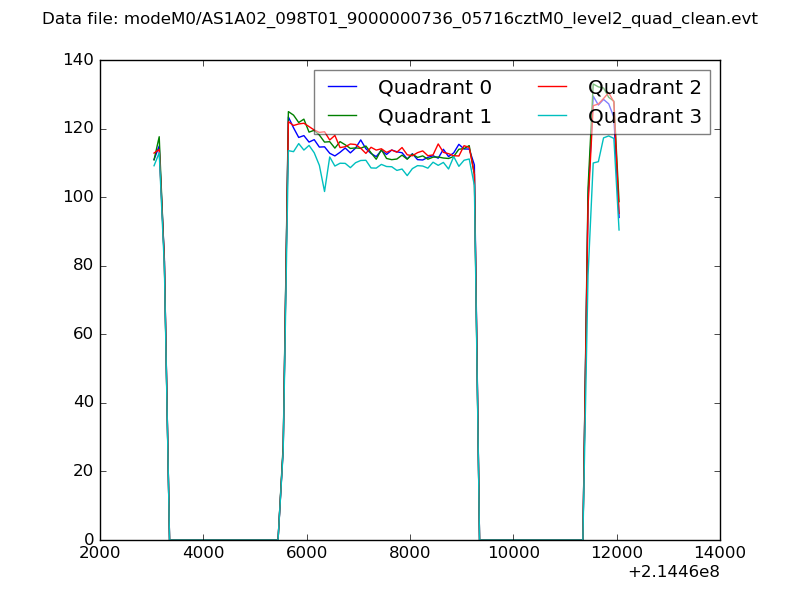 |
|
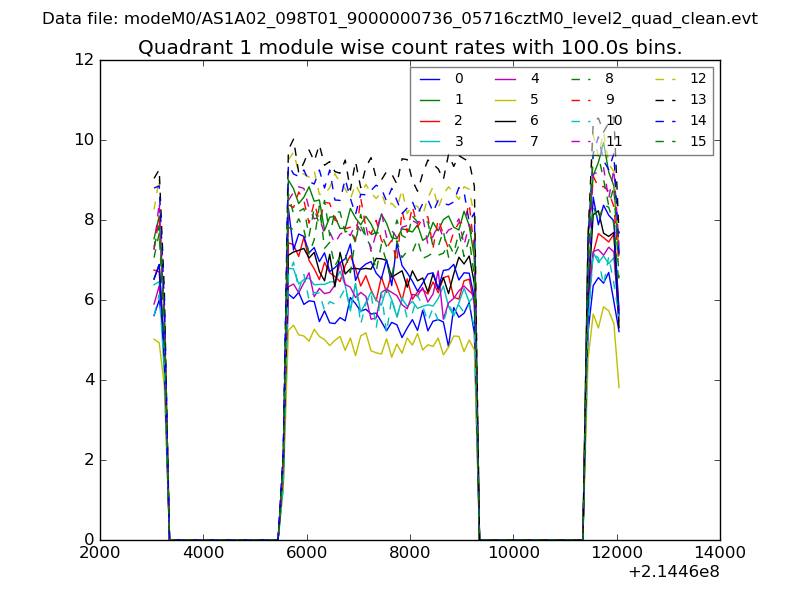
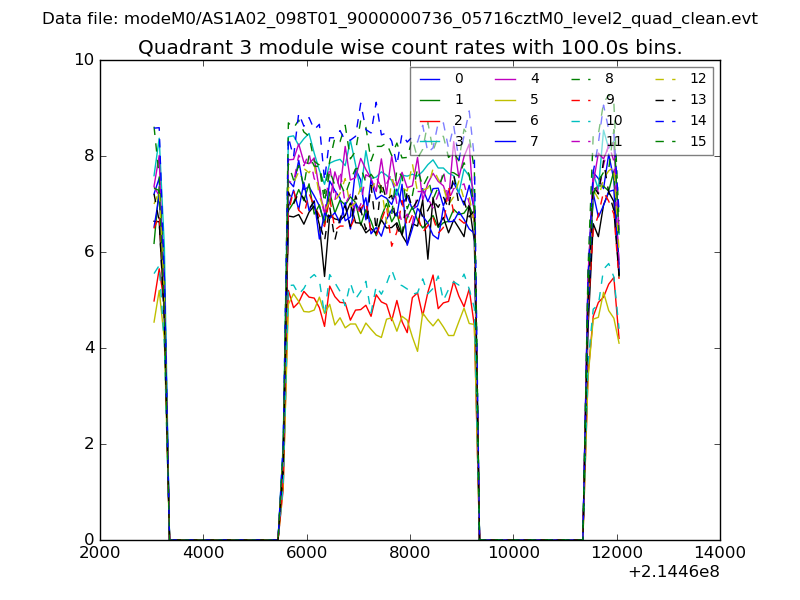
| Module-wise count rates for Quadrant A Data is divided into 100 sec bins |
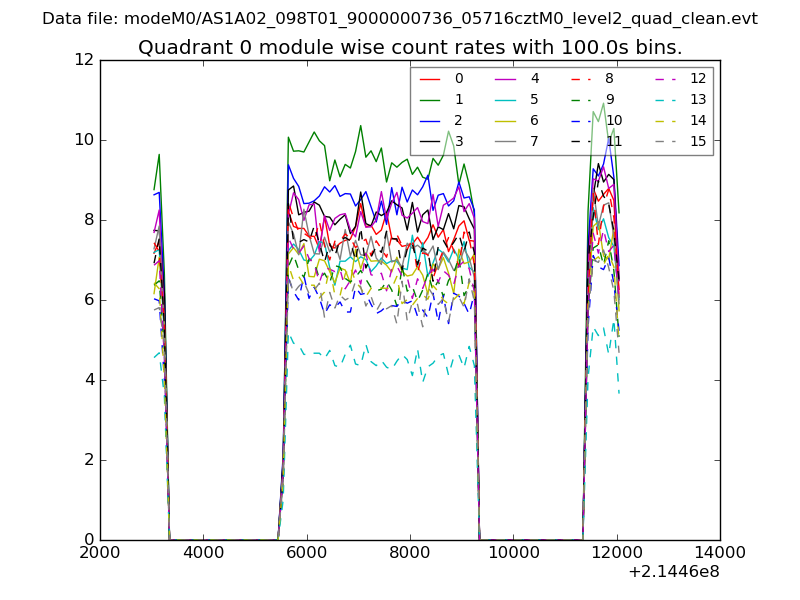 |
 |
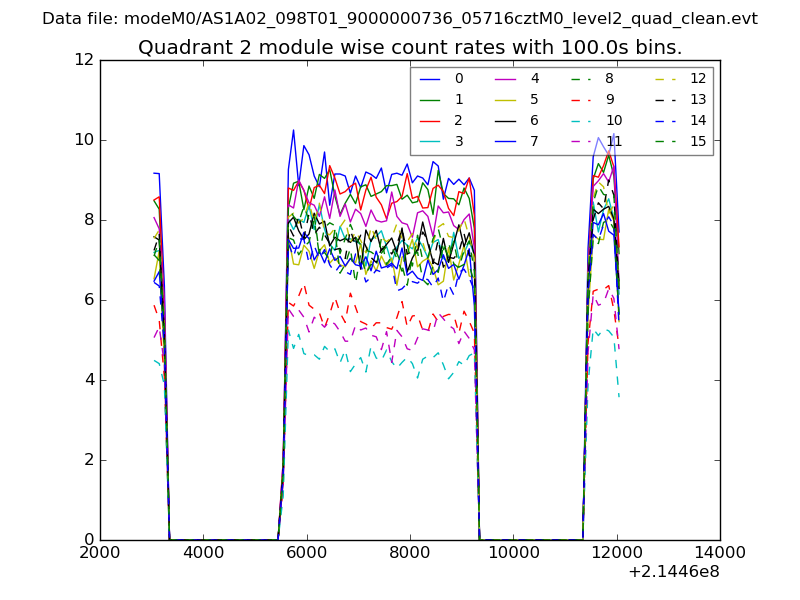
| Module-wise count rates for Quadrant B Data is divided into 100 sec bins |
 |
 |
| Module-wise count rates for Quadrant C Data is divided into 100 sec bins |
 |
 |
| Module-wise count rates for Quadrant D Data is divided into 100 sec bins |
 |
 |
| Parameter | Plot |
|---|---|
| CZT HV Monitor | 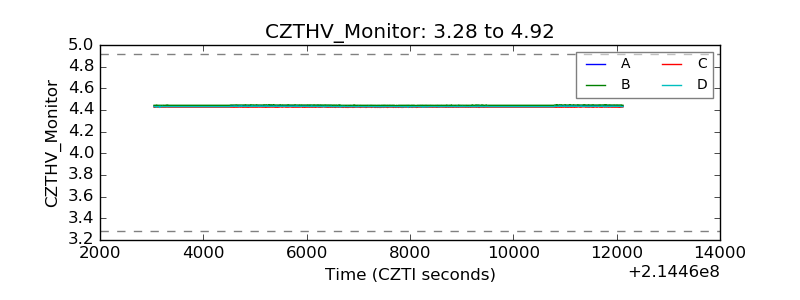 |
| D_VDD | 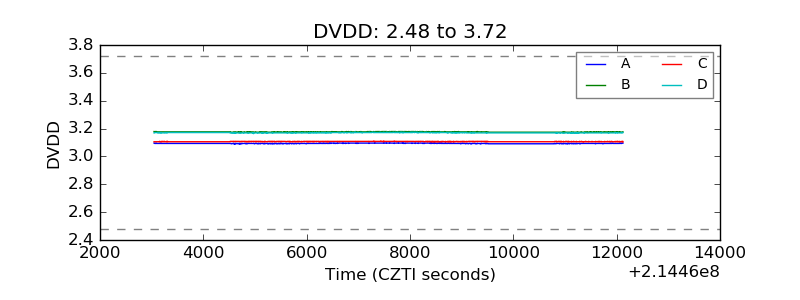 |
| Temperature 1 | 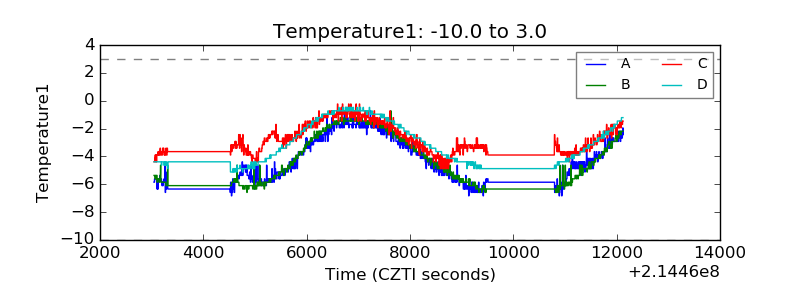 |
| Veto HV Monitor | 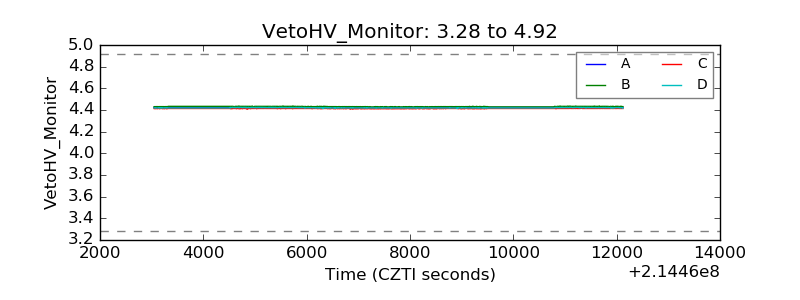 |
| Veto LLD | 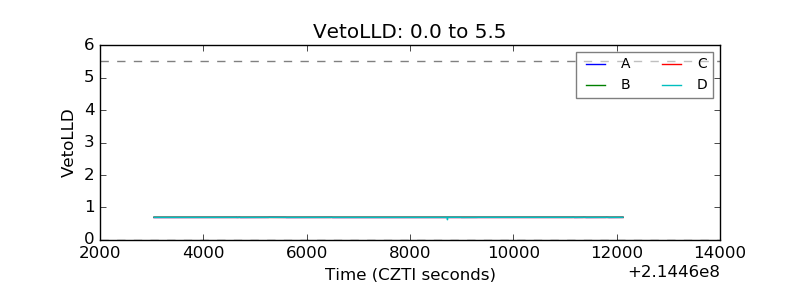 |
| Alpha Counter | 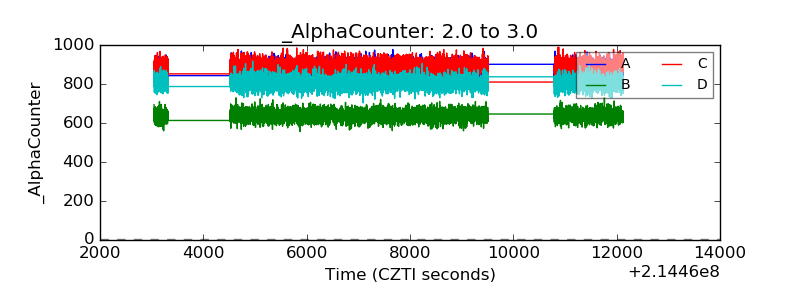 |
| _CPM_Rate | 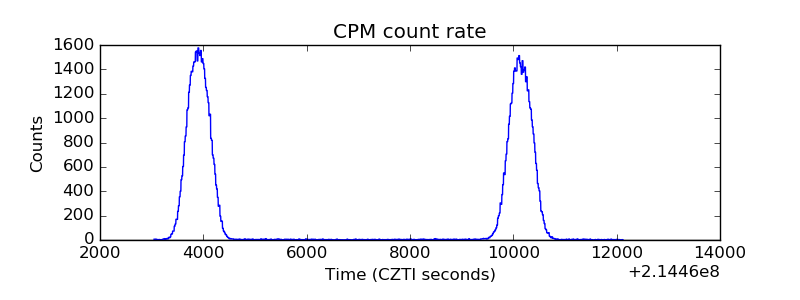 |
| CZT Counter | 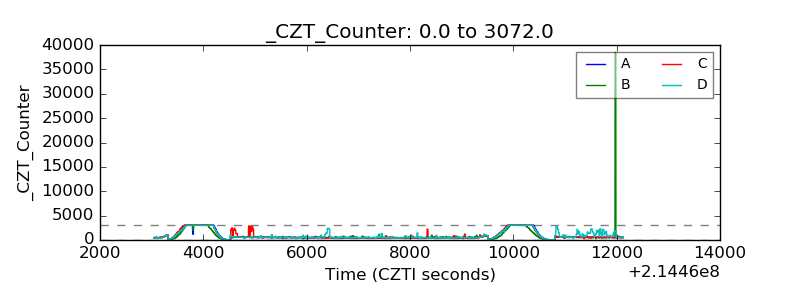 |
| +2.5 Volts monitor |  |
| +5 Volts monitor | 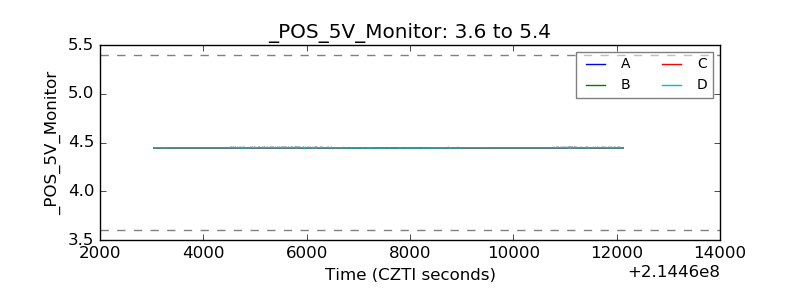 |
| _ROLL_ROT | 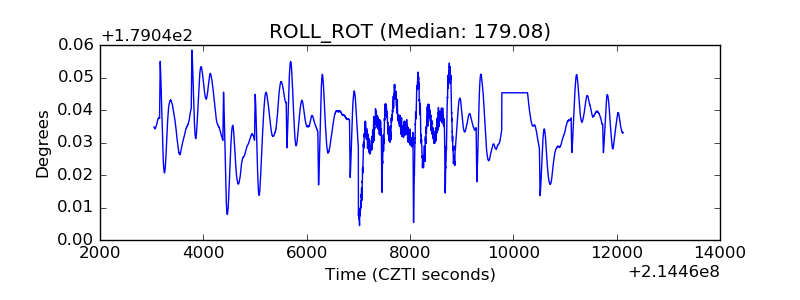 |
| _Roll_DEC | 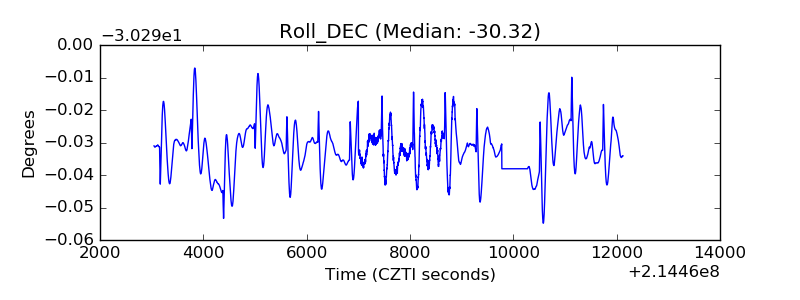 |
| _Roll_RA | 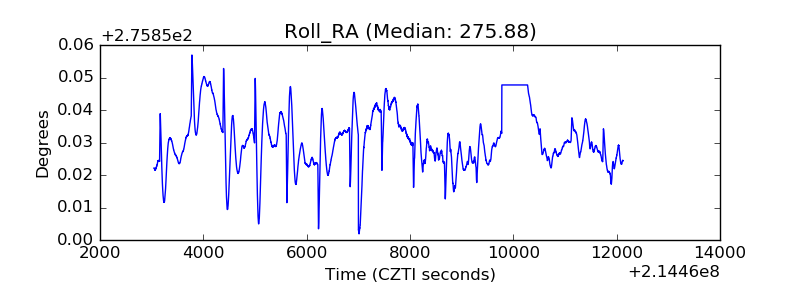 |
| Veto Counter | 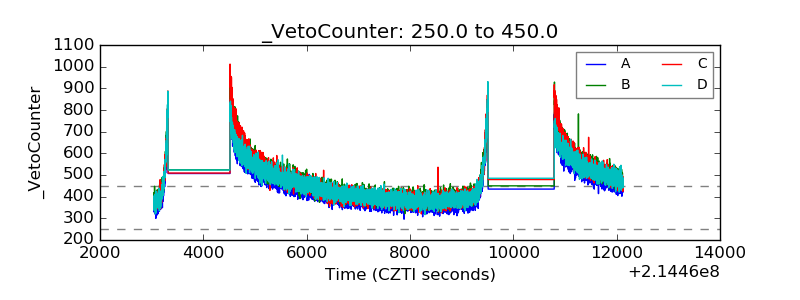 |