| Param | Original file | Final file |
|---|---|---|
| Filename | modeM0/AS1A02_098T01_9000000736_05718cztM0_level2.evt | modeM0/AS1A02_098T01_9000000736_05718cztM0_level2_quad_clean.evt |
| Size (bytes) | 438,134,400 | 88,862,400 |
| Size | 417.8 MB | 84.7 MB |
| Events in quadrant A | 2,895,211 | 574,032 |
| Events in quadrant B | 3,217,293 | 576,232 |
| Events in quadrant C | 2,925,433 | 575,797 |
| Events in quadrant D | 3,821,434 | 544,387 |
| Mode SS | |||
|---|---|---|---|
| Quadrant | BADHDUFLAG | Total packets | Discarded packets |
| A | 0 | 122 | 0 |
| B | 0 | 122 | 0 |
| C | 0 | 122 | 0 |
| D | 0 | 122 | 0 |
| Mode M0 | |||
|---|---|---|---|
| Quadrant | BADHDUFLAG | Total packets | Discarded packets |
| A | 0 | 12501 | 2 |
| B | 0 | 13172 | 1 |
| C | 0 | 12731 | 1 |
| D | 0 | 15223 | 8 |
| Mode M9 | |||
|---|---|---|---|
| Quadrant | BADHDUFLAG | Total packets | Discarded packets |
| A | 0 | 11 | 0 |
| B | 0 | 11 | 0 |
| C | 0 | 11 | 0 |
| D | 0 | 11 | 0 |
| Quadrant | Total seconds | Saturated seconds | Saturation percentage |
|---|---|---|---|
| A | 6018 | 149 | 2.475906% |
| B | 6018 | 143 | 2.376205% |
| C | 6018 | 130 | 2.160186% |
| D | 6015 | 238 | 3.956775% |
Noise dominated data is calculated using 1-second bins in cleaned event files. If a bin has >2000 counts, and if more than 50% of those come from <1% of pixels, then it is considered to be noise-dominated and hence unusable.
| Quadrant | # 1 sec bins | Bins with >0 counts | Bins with >2000 counts | High rate bins dominated by noise | Noise dominated (total time) | Noise dominated (detector-on time) | Marked lightcurve |
|---|---|---|---|---|---|---|---|
| A | 7158 | 6018 | 0 | 0 | 0.00% | 0.00% | 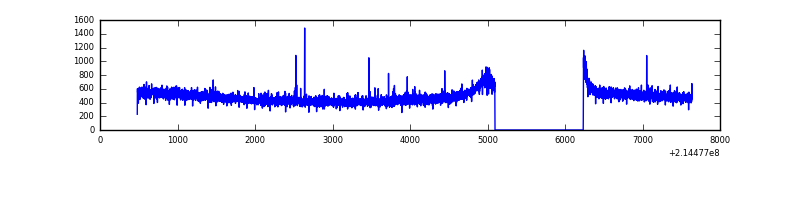 |
| B | 7158 | 6019 | 2 | 2 | 0.03% | 0.03% | 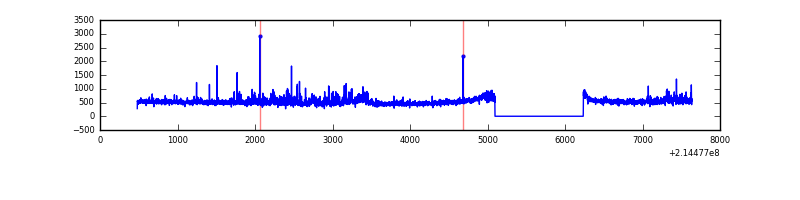 |
| C | 7158 | 6019 | 13 | 13 | 0.18% | 0.22% |  |
| D | 7158 | 6018 | 88 | 88 | 1.23% | 1.46% | 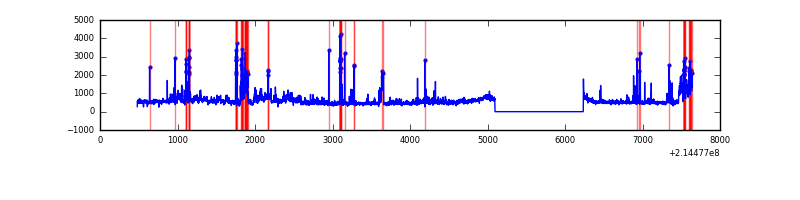 |
Top three noisy pixels from each quadrant. If the there are fewer than three noisy pixels in the level2.evt file, extra rows are filled as -1
| Pixel properties | Quadrant properties | ||||||
|---|---|---|---|---|---|---|---|
| Quadrant | DetID | PixID | Counts | Sigma | Mean | Median | Sigma |
| A | 12 | 194 | 7470 | 44.1 | 749 | 732 | 152.8 |
| A | 0 | 226 | 7274 | 42.82 | 749 | 732 | 152.8 |
| A | 0 | 50 | 6118 | 35.25 | 749 | 732 | 152.8 |
| B | 0 | 214 | 57433 | 397.89 | 748 | 731 | 142.5 |
| B | 15 | 204 | 51593 | 356.91 | 748 | 731 | 142.5 |
| B | 0 | 219 | 43672 | 301.32 | 748 | 731 | 142.5 |
| C | 9 | 16 | 106800 | 642.87 | 718 | 720 | 165.0 |
| C | 1 | 16 | 7845 | 43.18 | 718 | 720 | 165.0 |
| C | 14 | 67 | 6533 | 35.23 | 718 | 720 | 165.0 |
| D | 12 | 221 | 471393 | 2639.25 | 725 | 703 | 178.3 |
| D | 2 | 152 | 237160 | 1325.86 | 725 | 703 | 178.3 |
| D | 10 | 15 | 97799 | 544.44 | 725 | 703 | 178.3 |
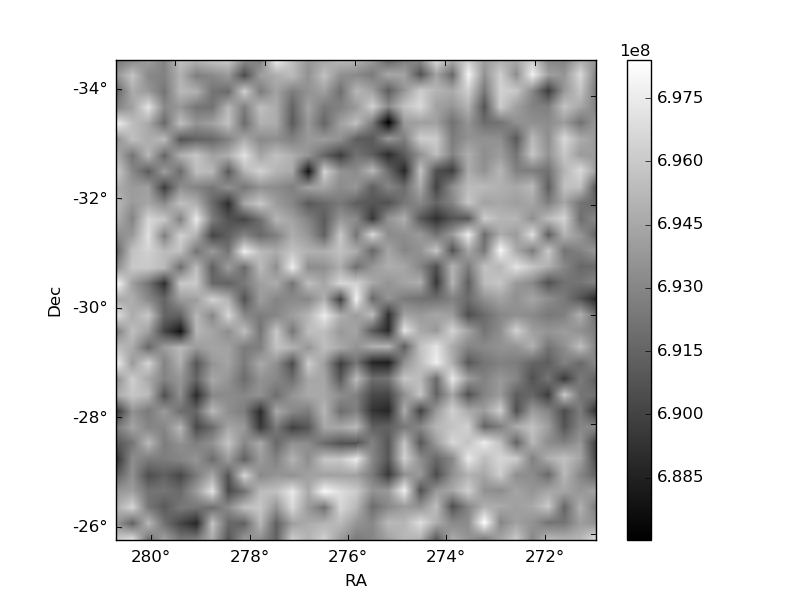
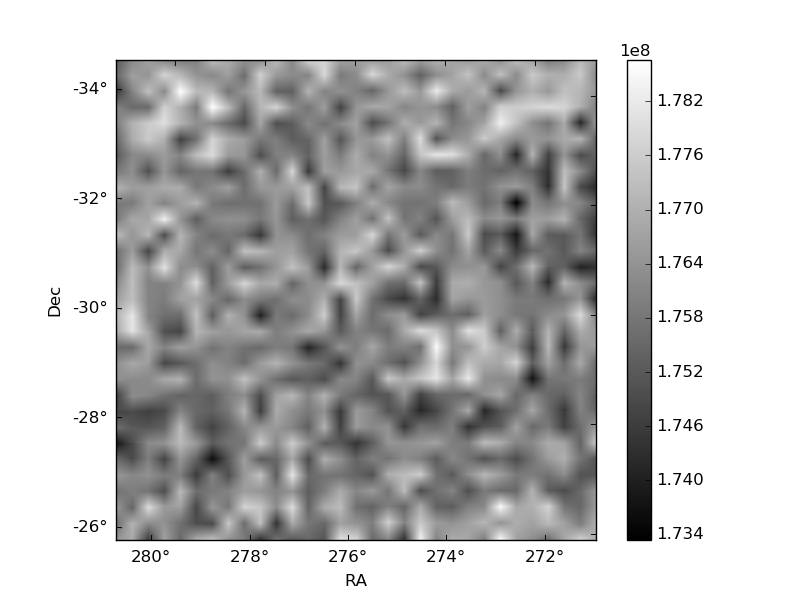
Histogram calculated using DETX and DETY for each event in the final _common_clean file
| Quadrant A | 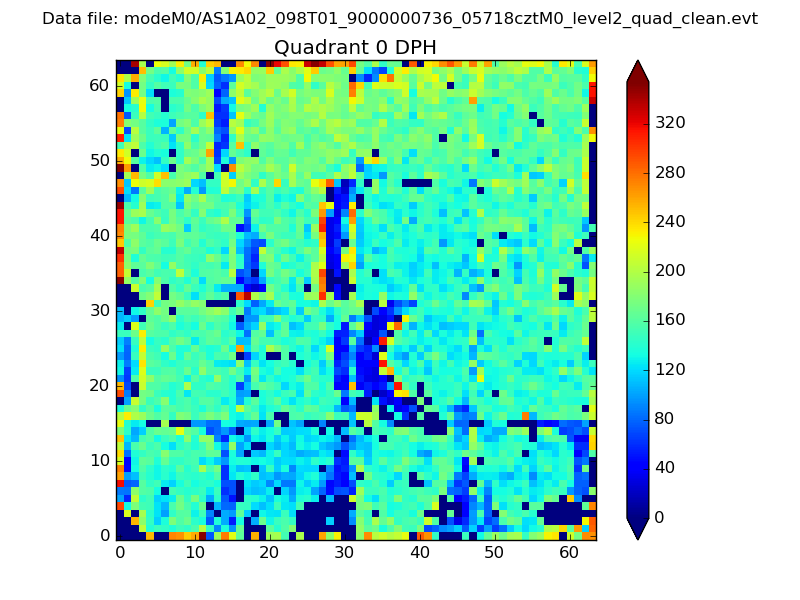 |
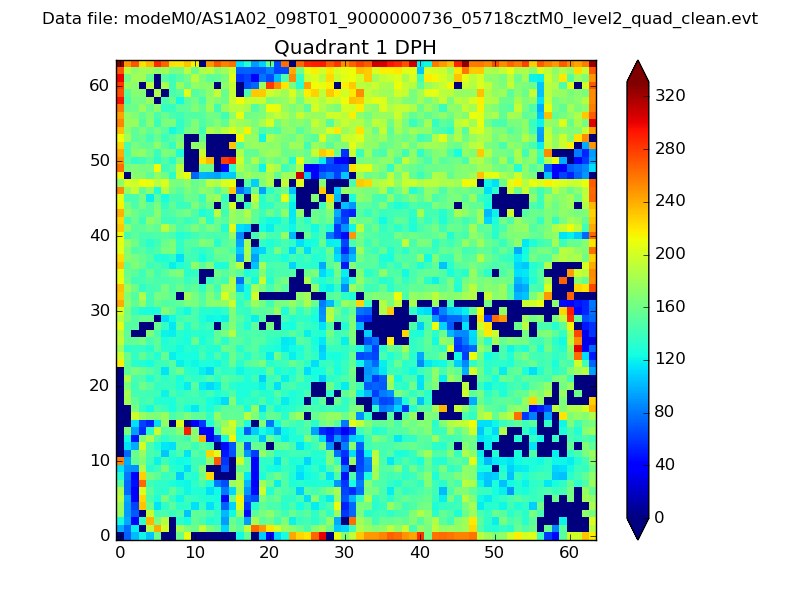 |
Quadrant B |
|---|---|---|---|
| Quadrant D | 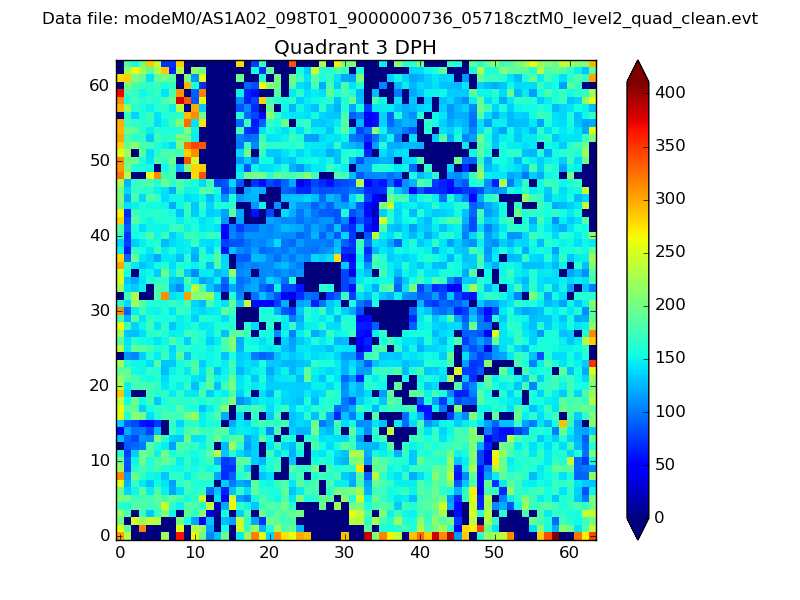 |
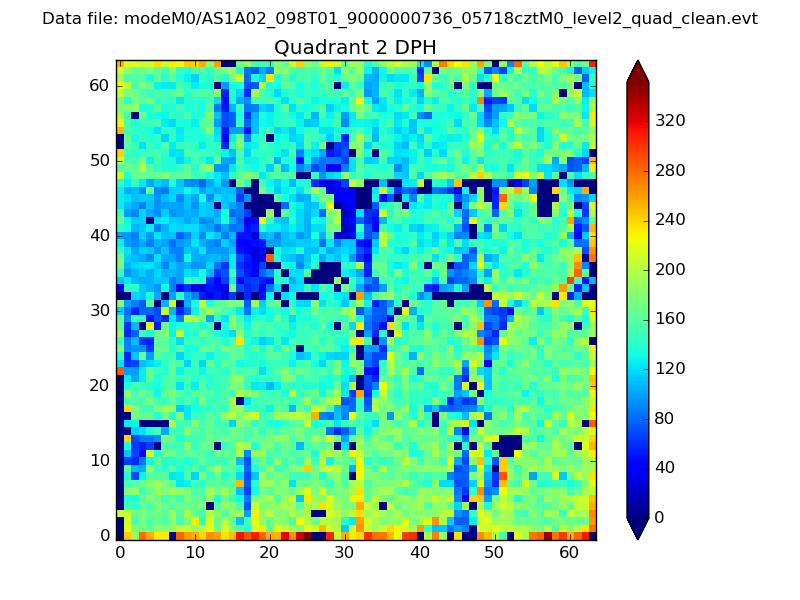 |
Quadrant C |
| Plot type | Count rate plots | Images |
|---|---|---|
| Comparison with Poisson distribution Blue bars denote a histogram of data divided into 1 sec bins. Red curve is a Poisson curve with rate = median count rate of data. |
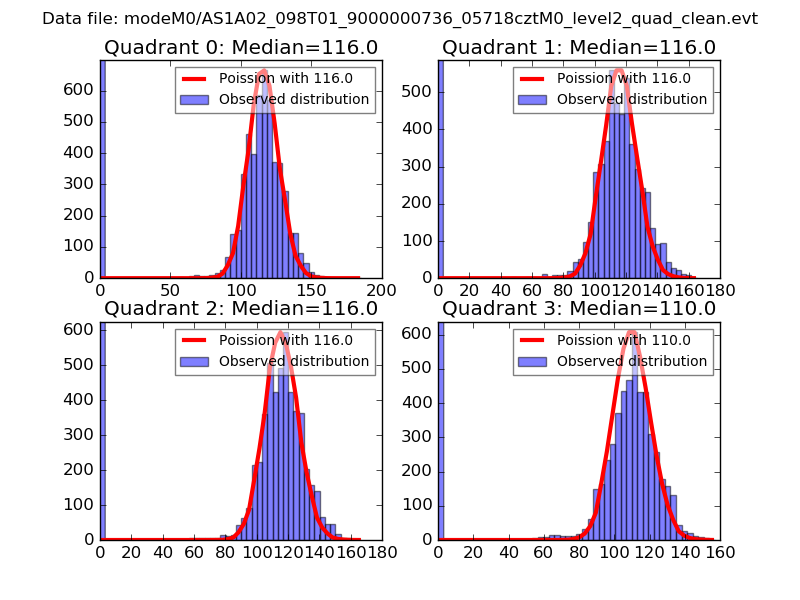 |
 |
| Quadrant-wise count rates Data is divided into 100 sec bins |
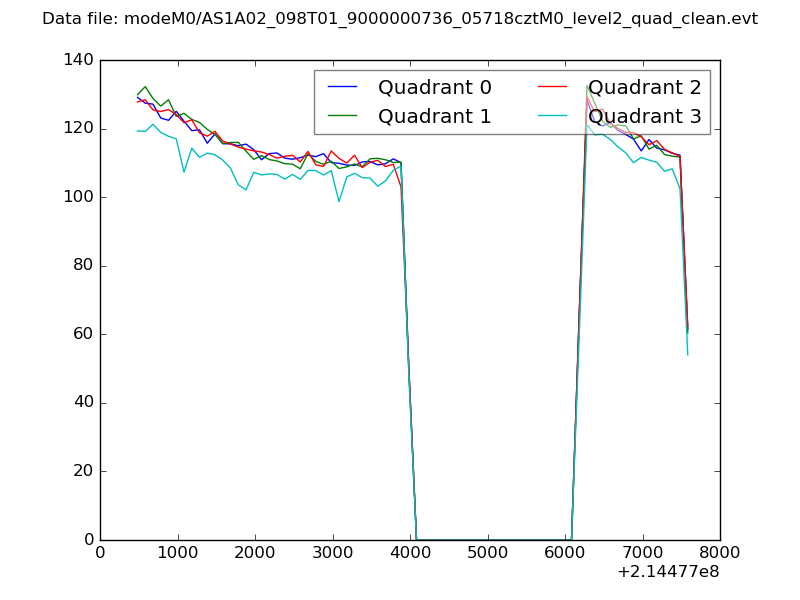 |
|
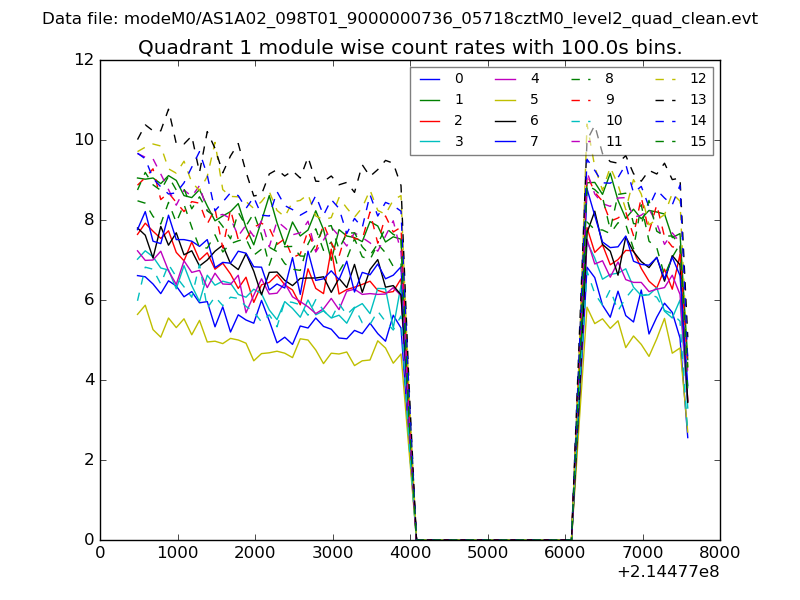
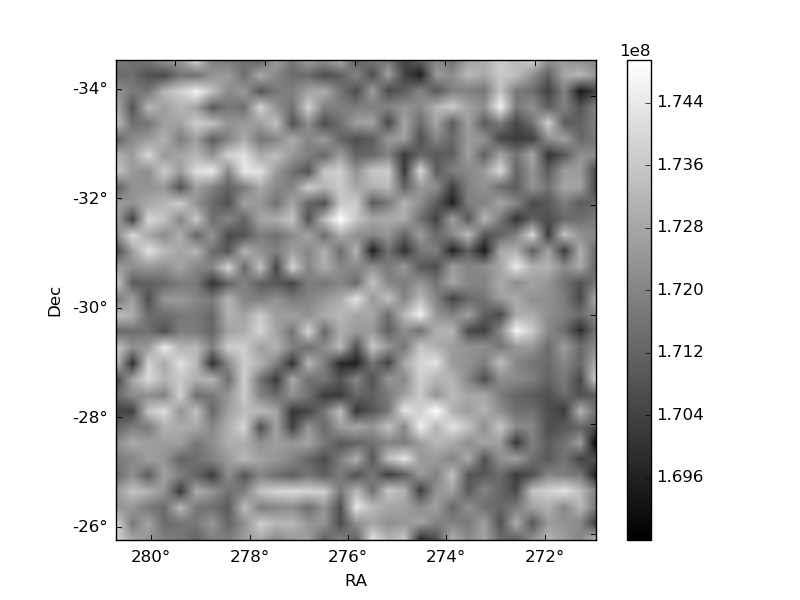
| Module-wise count rates for Quadrant A Data is divided into 100 sec bins |
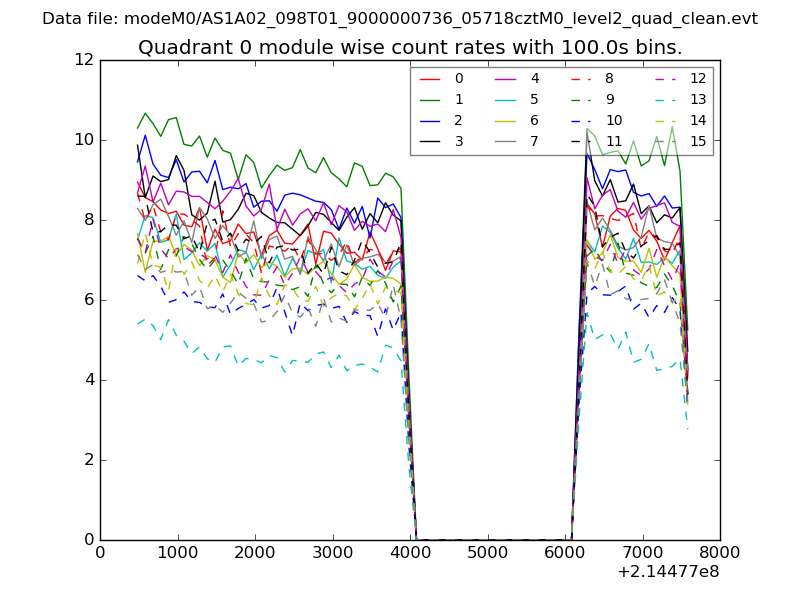 |
 |
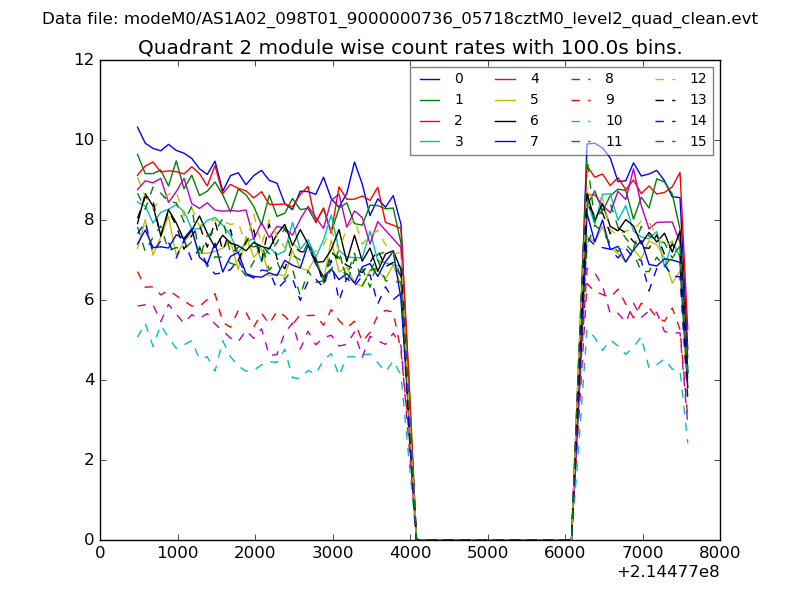
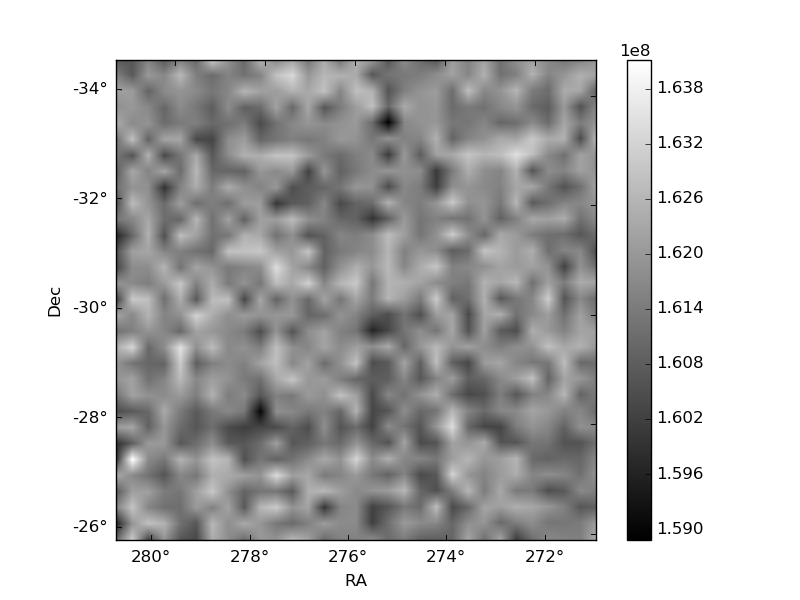
| Module-wise count rates for Quadrant B Data is divided into 100 sec bins |
 |
 |
| Module-wise count rates for Quadrant C Data is divided into 100 sec bins |
 |
 |
| Module-wise count rates for Quadrant D Data is divided into 100 sec bins |
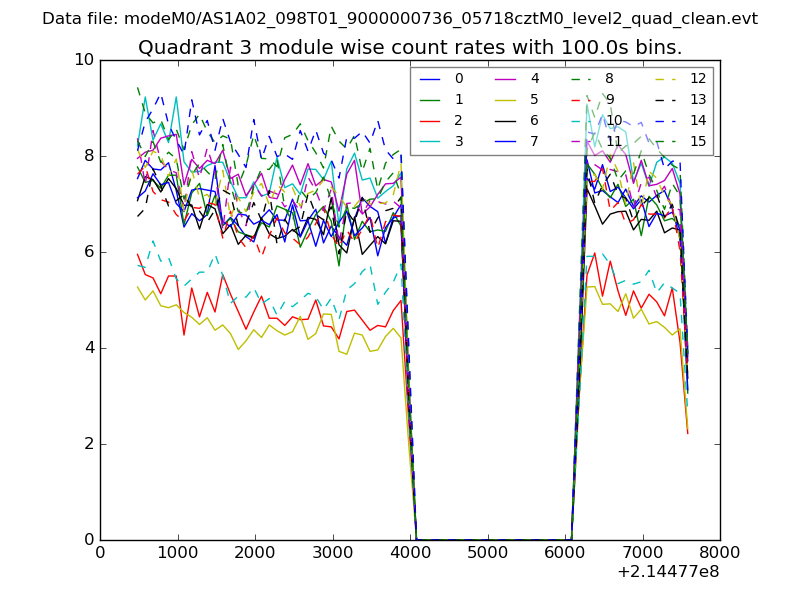 |
 |
| Parameter | Plot |
|---|---|
| CZT HV Monitor | 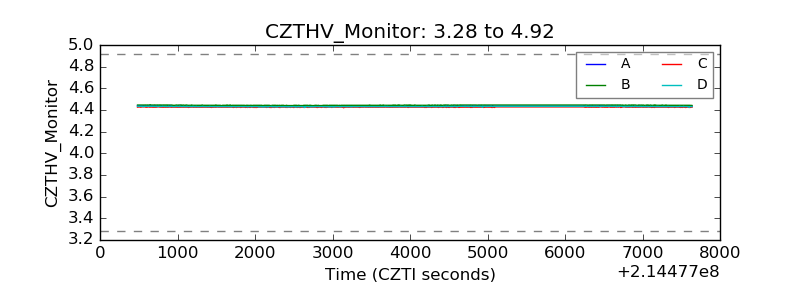 |
| D_VDD | 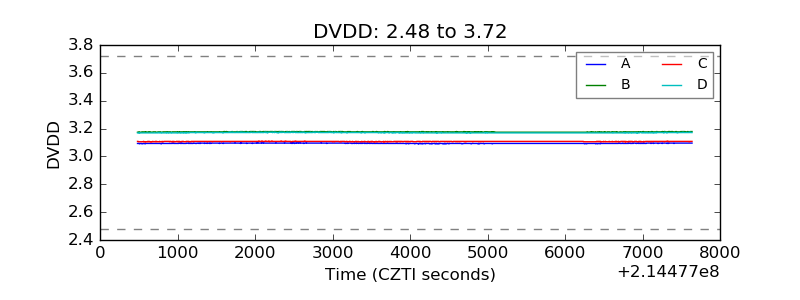 |
| Temperature 1 | 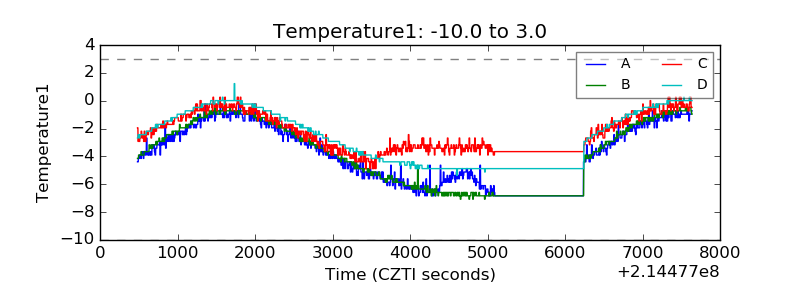 |
| Veto HV Monitor | 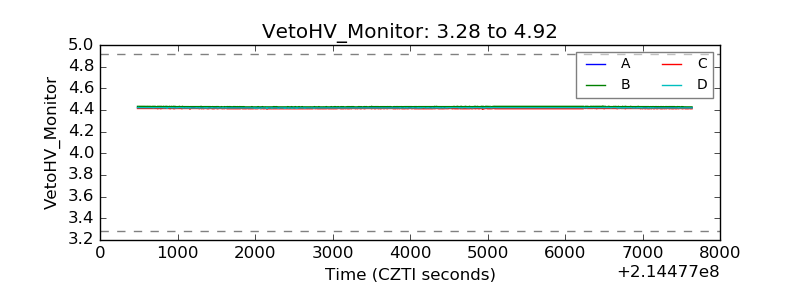 |
| Veto LLD | 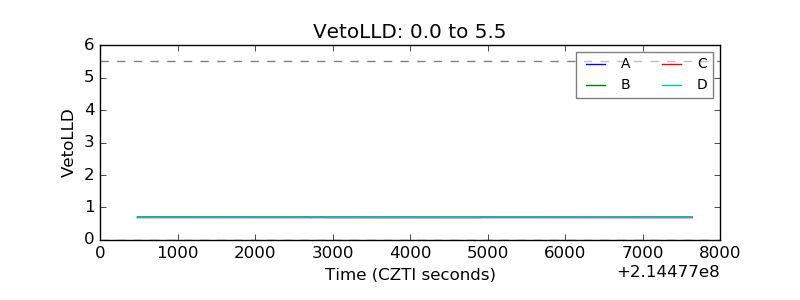 |
| Alpha Counter | 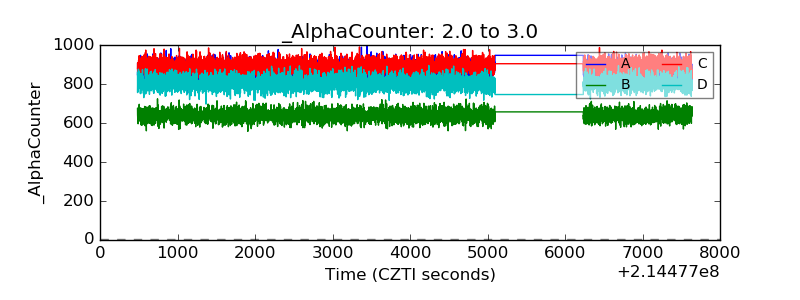 |
| _CPM_Rate | 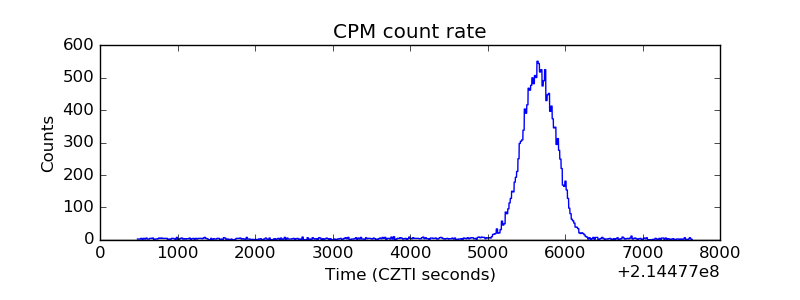 |
| CZT Counter |  |
| +2.5 Volts monitor |  |
| +5 Volts monitor |  |
| _ROLL_ROT | 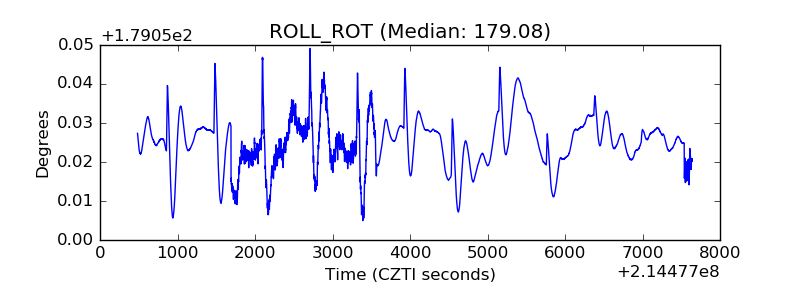 |
| _Roll_DEC | 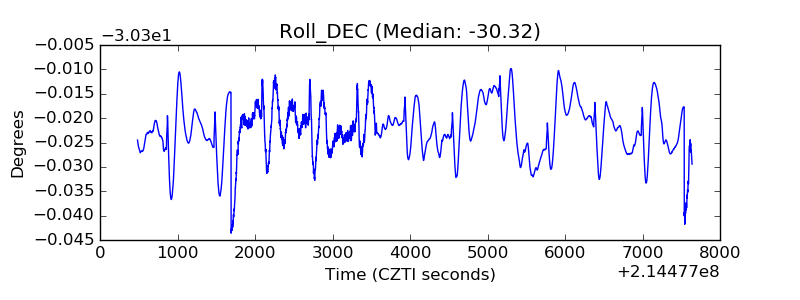 |
| _Roll_RA | 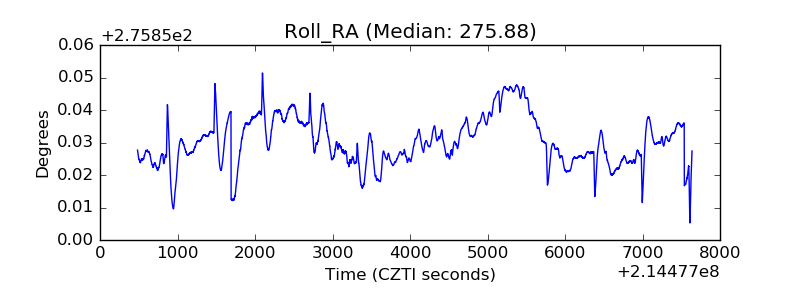 |
| Veto Counter | 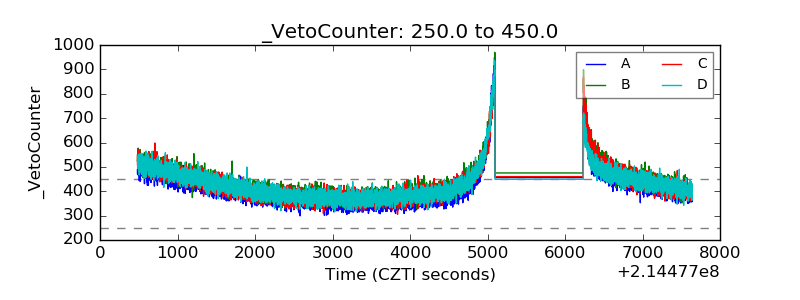 |