| Param | Original file | Final file |
|---|---|---|
| Filename | modeM0/AS1A02_098T01_9000000736_05721cztM0_level2.evt | modeM0/AS1A02_098T01_9000000736_05721cztM0_level2_quad_clean.evt |
| Size (bytes) | 540,538,560 | 95,434,560 |
| Size | 515.5 MB | 91.0 MB |
| Events in quadrant A | 4,036,030 | 585,323 |
| Events in quadrant B | 4,611,524 | 592,334 |
| Events in quadrant C | 3,475,926 | 601,619 |
| Events in quadrant D | 3,722,912 | 574,062 |
| Mode SS | |||
|---|---|---|---|
| Quadrant | BADHDUFLAG | Total packets | Discarded packets |
| A | 0 | 156 | 0 |
| B | 0 | 156 | 0 |
| C | 0 | 156 | 0 |
| D | 0 | 156 | 0 |
| Mode M0 | |||
|---|---|---|---|
| Quadrant | BADHDUFLAG | Total packets | Discarded packets |
| A | 0 | 17383 | 20 |
| B | 0 | 18806 | 35 |
| C | 0 | 15986 | 20 |
| D | 0 | 16594 | 15 |
| Mode M9 | |||
|---|---|---|---|
| Quadrant | BADHDUFLAG | Total packets | Discarded packets |
| A | 1 | 251318637792 | 0 |
| B | 1 | -1 | -1 |
| C | 1 | -1 | -1 |
| D | 1 | -1 | -1 |
| Quadrant | Total seconds | Saturated seconds | Saturation percentage |
|---|---|---|---|
| A | 7713 | 190 | 2.463374% |
| B | 7708 | 123 | 1.595745% |
| C | 7711 | 25 | 0.324212% |
| D | 7714 | 33 | 0.427794% |
Noise dominated data is calculated using 1-second bins in cleaned event files. If a bin has >2000 counts, and if more than 50% of those come from <1% of pixels, then it is considered to be noise-dominated and hence unusable.
| Quadrant | # 1 sec bins | Bins with >0 counts | Bins with >2000 counts | High rate bins dominated by noise | Noise dominated (total time) | Noise dominated (detector-on time) | Marked lightcurve |
|---|---|---|---|---|---|---|---|
| A | 7799 | 7721 | 129 | 129 | 1.65% | 1.67% | 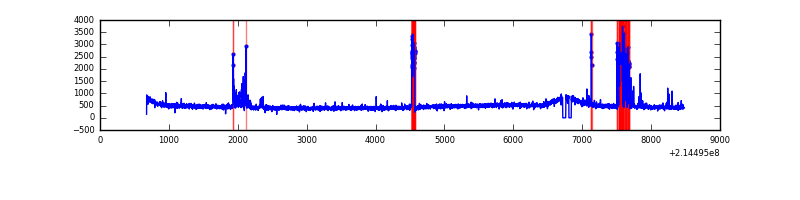 |
| B | 7799 | 7720 | 27 | 27 | 0.35% | 0.35% | 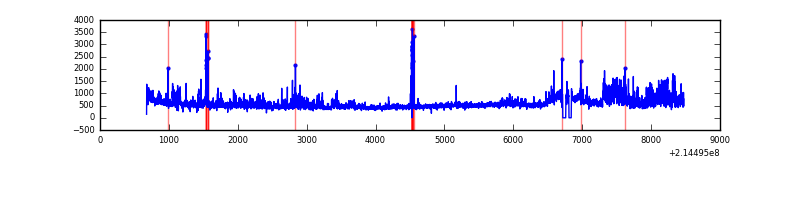 |
| C | 7799 | 7721 | 0 | 0 | 0.00% | 0.00% | 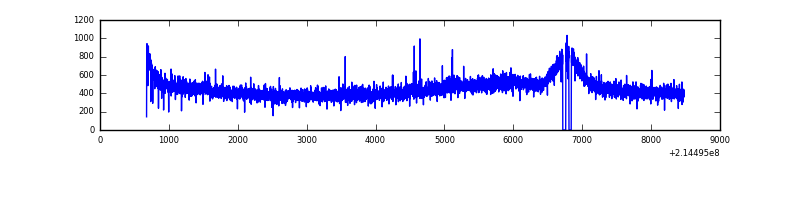 |
| D | 7799 | 7721 | 8 | 8 | 0.10% | 0.10% | 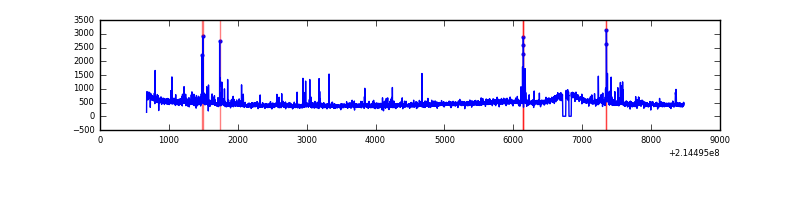 |
Top three noisy pixels from each quadrant. If the there are fewer than three noisy pixels in the level2.evt file, extra rows are filled as -1
| Pixel properties | Quadrant properties | ||||||
|---|---|---|---|---|---|---|---|
| Quadrant | DetID | PixID | Counts | Sigma | Mean | Median | Sigma |
| A | 0 | 50 | 479153 | 2555.74 | 910 | 887 | 187.1 |
| A | 14 | 31 | 13384 | 66.78 | 910 | 887 | 187.1 |
| A | 13 | 14 | 13166 | 65.62 | 910 | 887 | 187.1 |
| B | 15 | 204 | 643205 | 3627.93 | 923 | 900 | 177.0 |
| B | 0 | 214 | 126688 | 710.49 | 923 | 900 | 177.0 |
| B | 4 | 48 | 69303 | 386.36 | 923 | 900 | 177.0 |
| C | 9 | 16 | 8551 | 36.9 | 887 | 891 | 207.6 |
| C | 13 | 61 | 7115 | 29.98 | 887 | 891 | 207.6 |
| C | 8 | 222 | 4745 | 18.57 | 887 | 891 | 207.6 |
| D | 2 | 152 | 127313 | 573.31 | 892 | 867 | 220.6 |
| D | 8 | 195 | 57881 | 258.5 | 892 | 867 | 220.6 |
| D | 0 | 11 | 38532 | 170.77 | 892 | 867 | 220.6 |
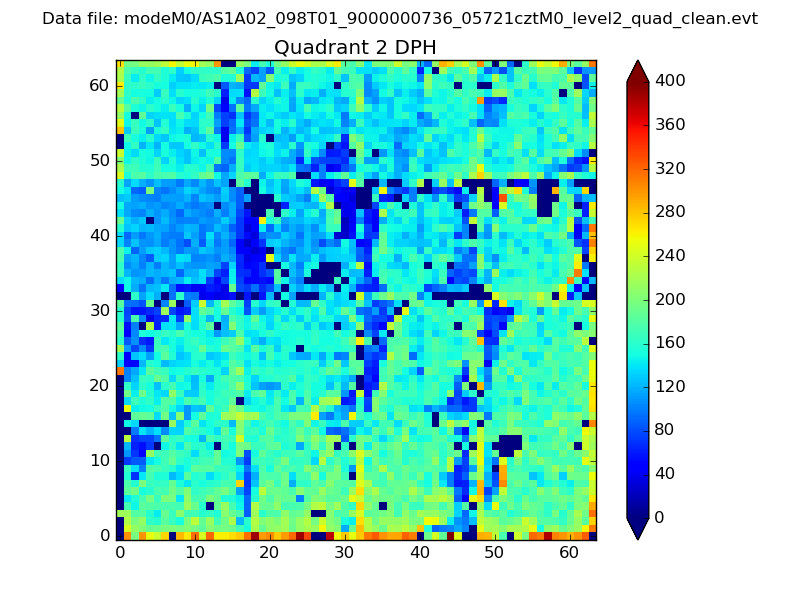
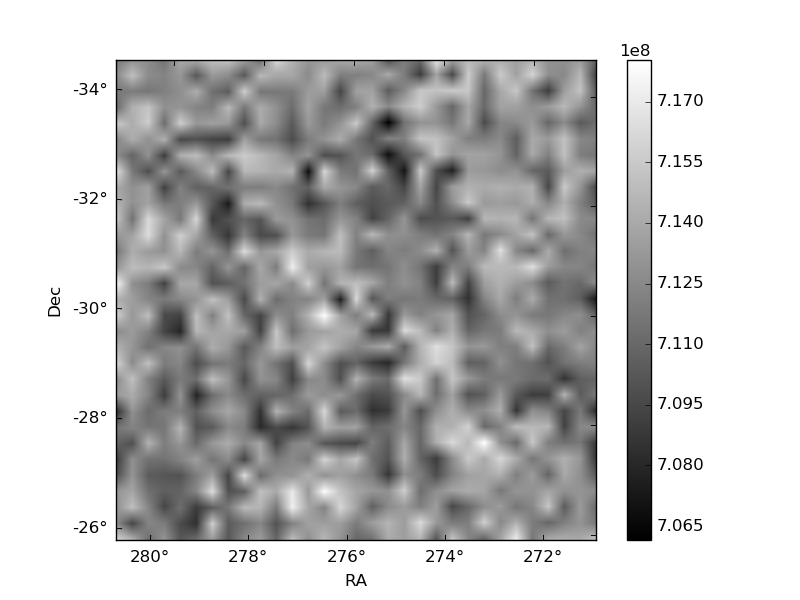
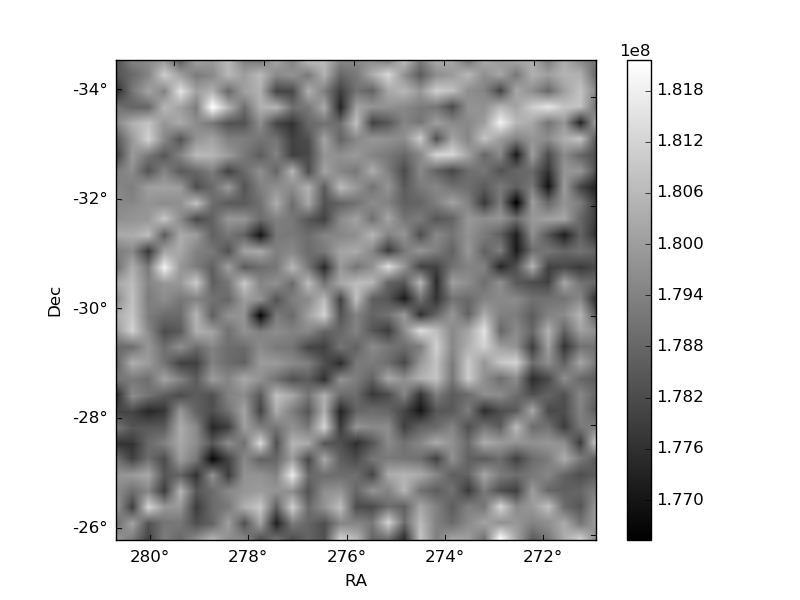
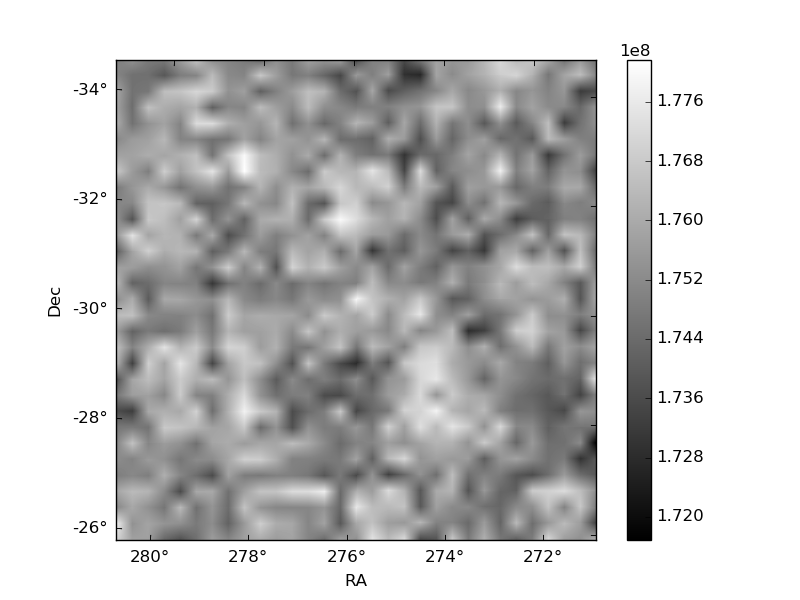
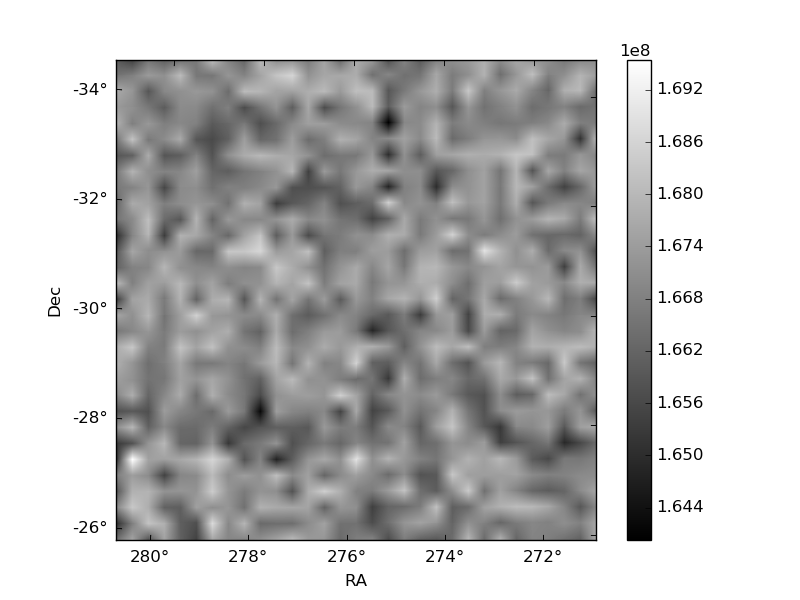
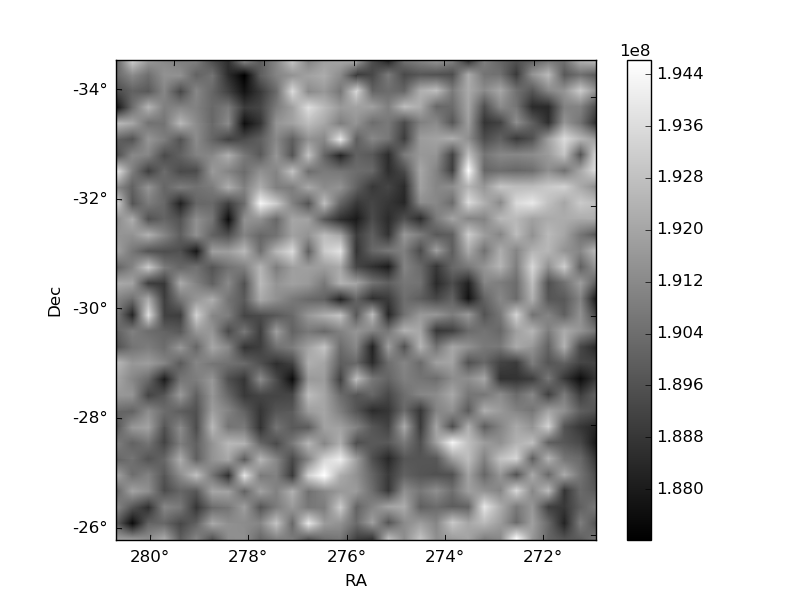
Histogram calculated using DETX and DETY for each event in the final _common_clean file
| Quadrant A | 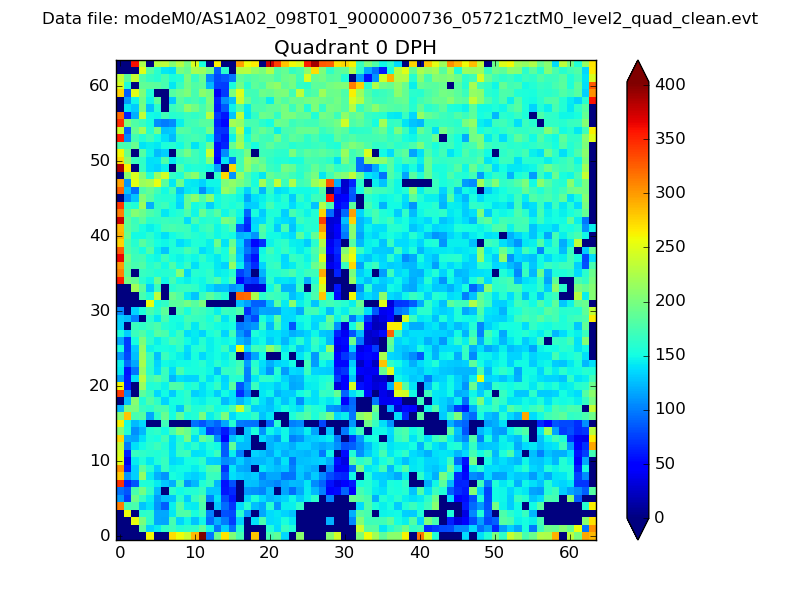 |
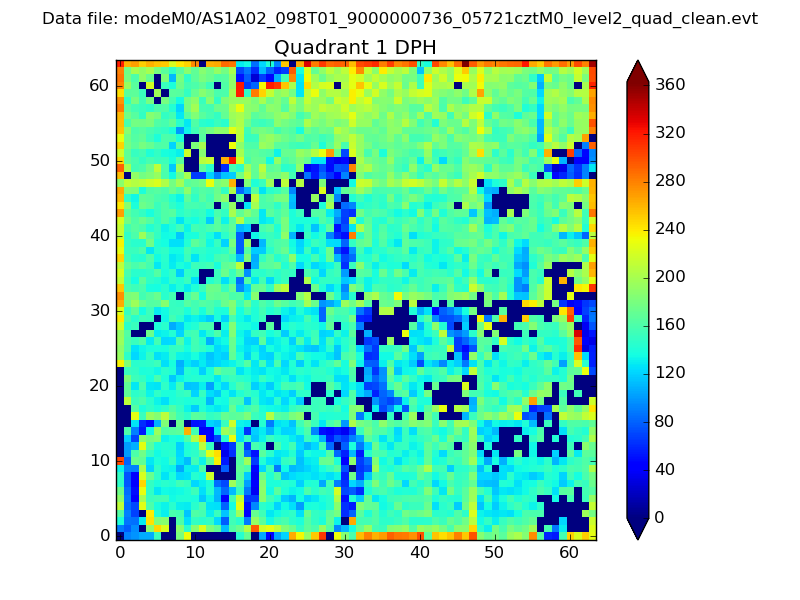 |
Quadrant B |
|---|---|---|---|
| Quadrant D | 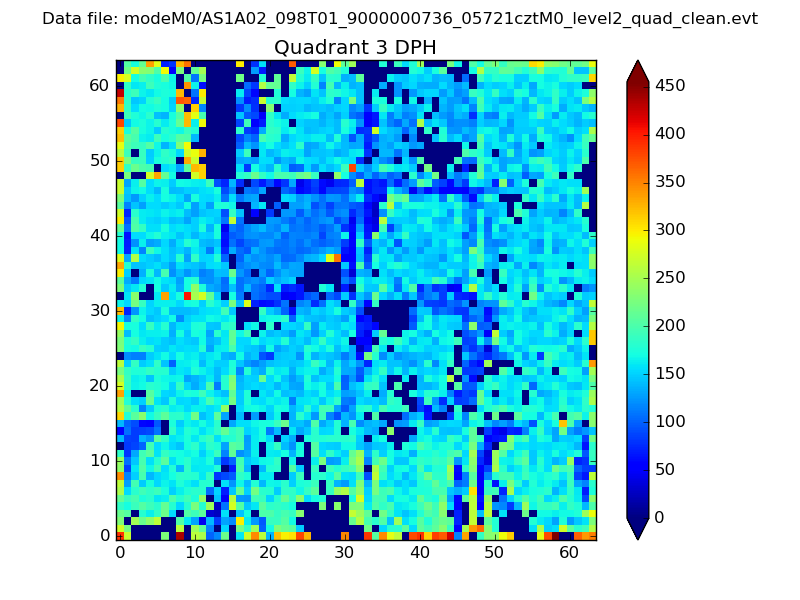 |
 |
Quadrant C |
| Plot type | Count rate plots | Images |
|---|---|---|
| Comparison with Poisson distribution Blue bars denote a histogram of data divided into 1 sec bins. Red curve is a Poisson curve with rate = median count rate of data. |
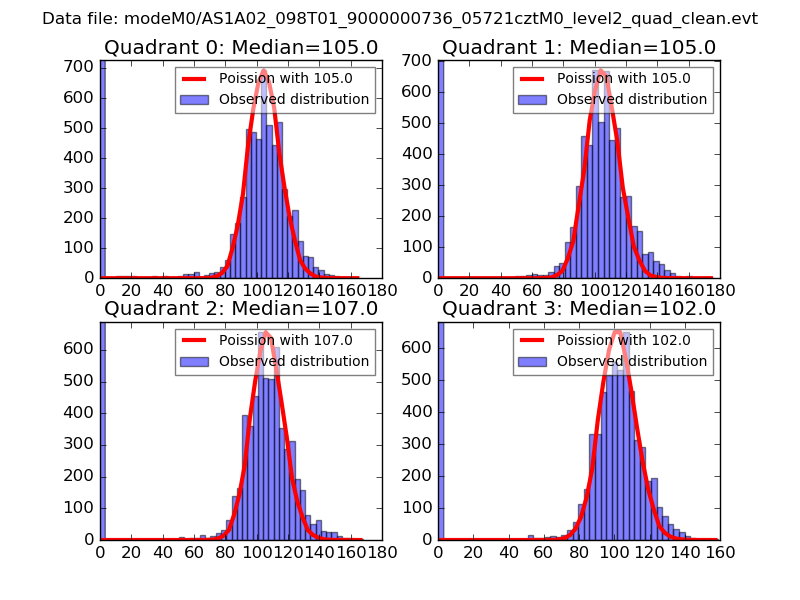 |
 |
| Quadrant-wise count rates Data is divided into 100 sec bins |
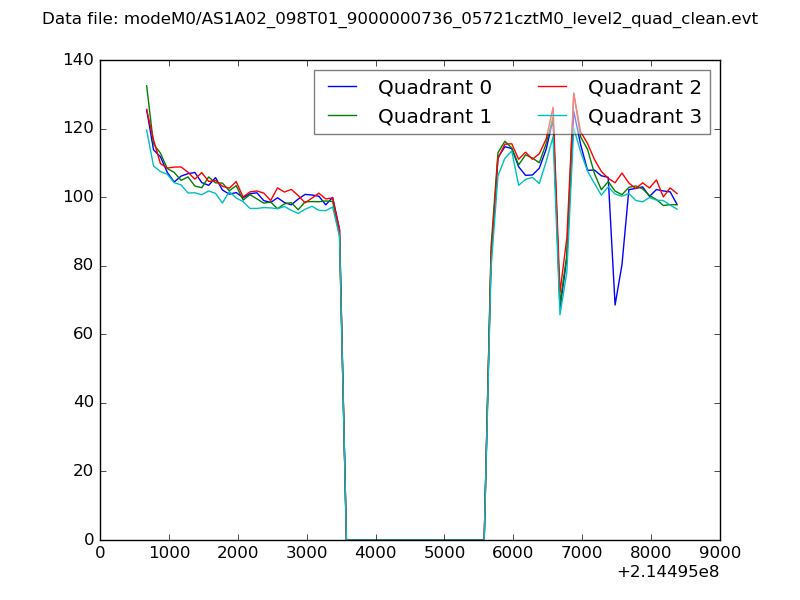 |
|
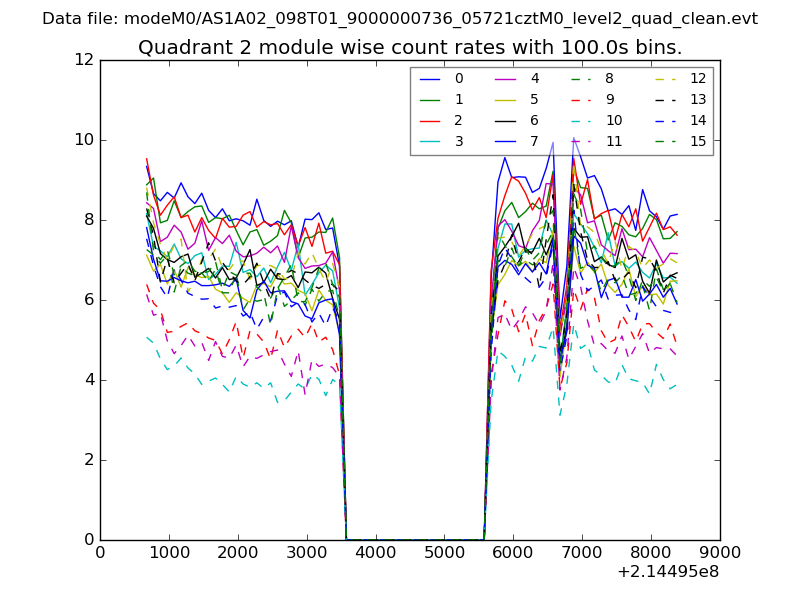
| Module-wise count rates for Quadrant A Data is divided into 100 sec bins |
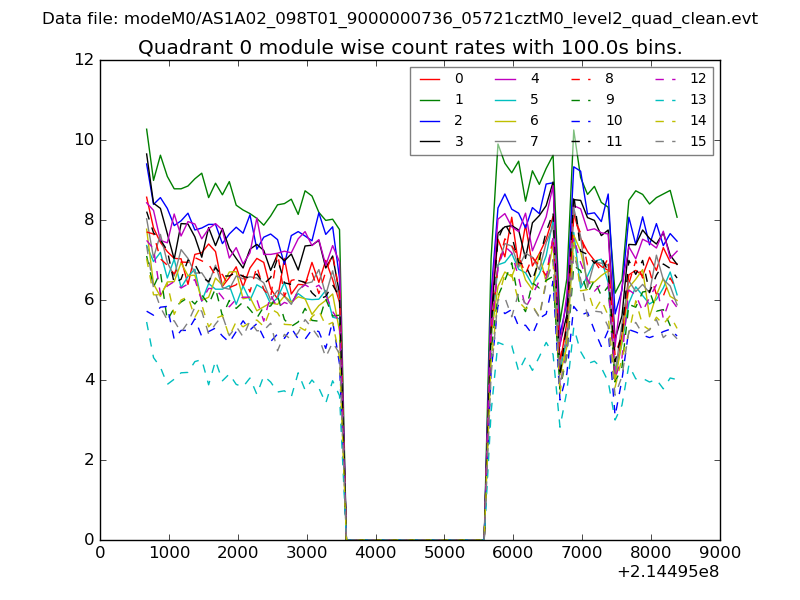 |
 |
| Module-wise count rates for Quadrant B Data is divided into 100 sec bins |
 |
 |
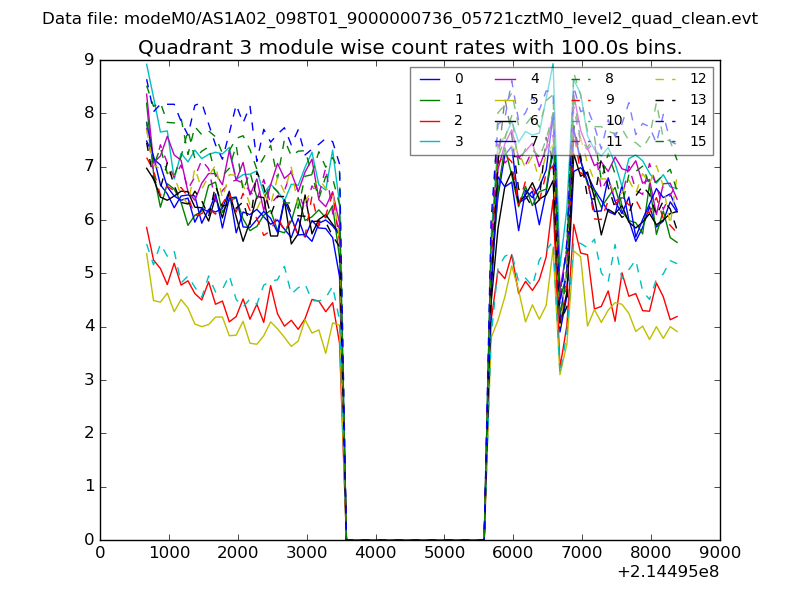
| Module-wise count rates for Quadrant C Data is divided into 100 sec bins |
 |
 |
| Module-wise count rates for Quadrant D Data is divided into 100 sec bins |
 |
 |
| Parameter | Plot |
|---|---|
| CZT HV Monitor | 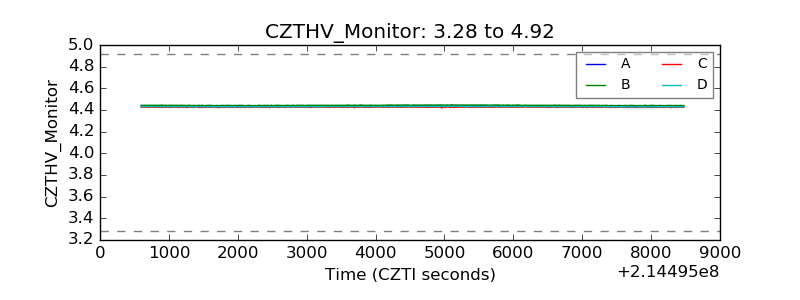 |
| D_VDD | 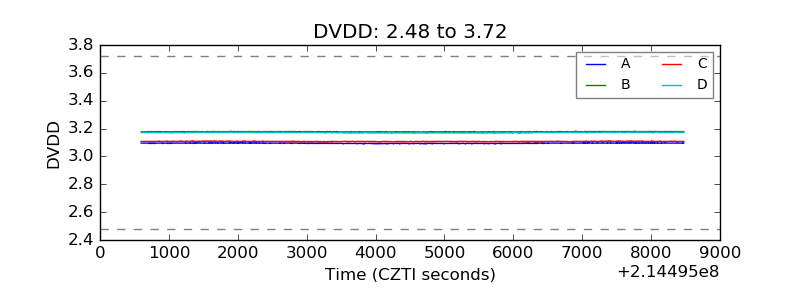 |
| Temperature 1 | 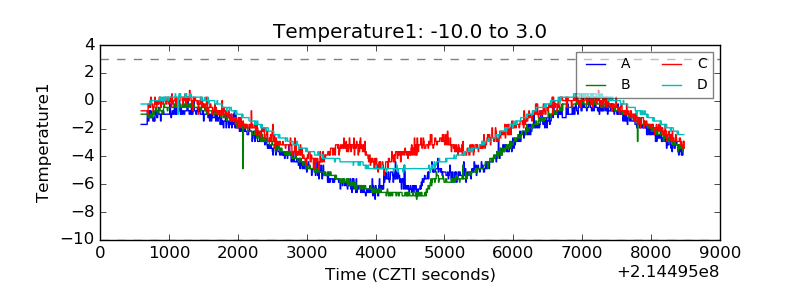 |
| Veto HV Monitor | 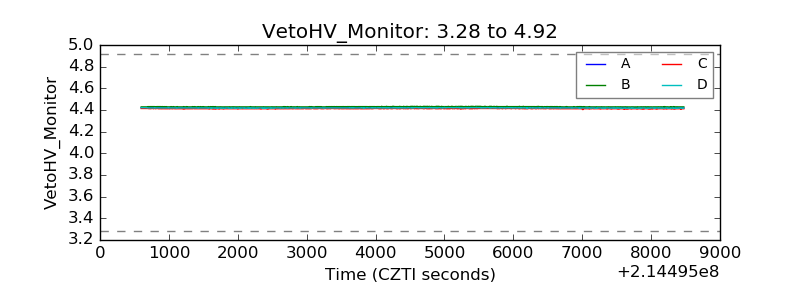 |
| Veto LLD | 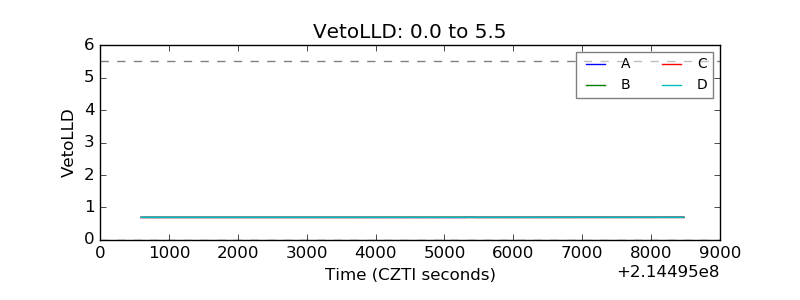 |
| Alpha Counter | 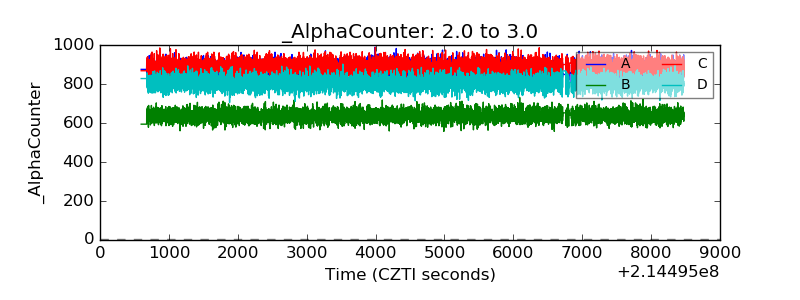 |
| _CPM_Rate | 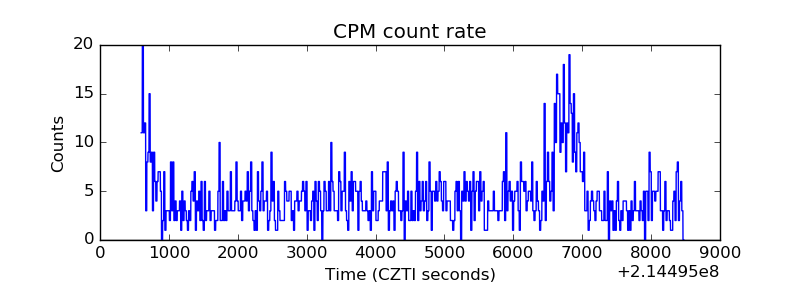 |
| CZT Counter | 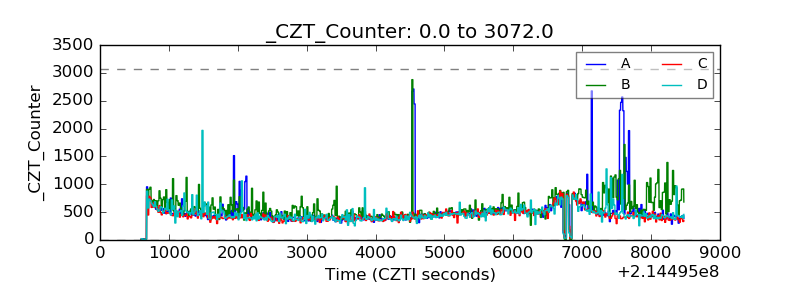 |
| +2.5 Volts monitor | 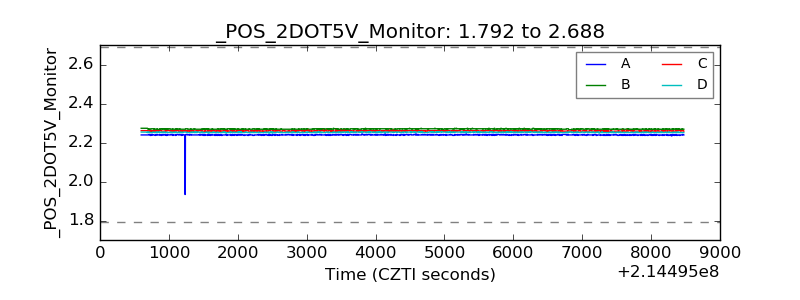 |
| +5 Volts monitor | 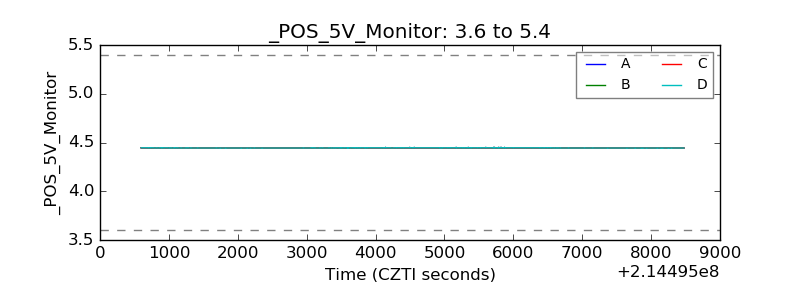 |
| _ROLL_ROT | 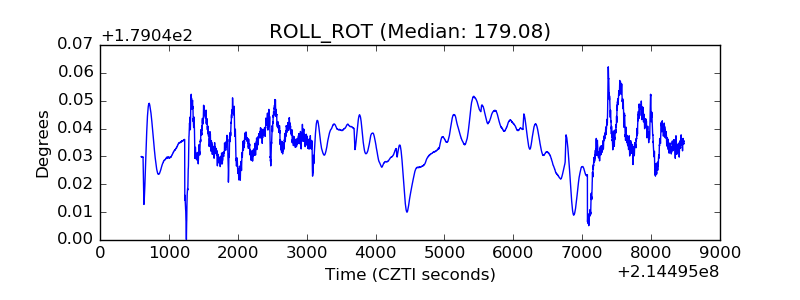 |
| _Roll_DEC | 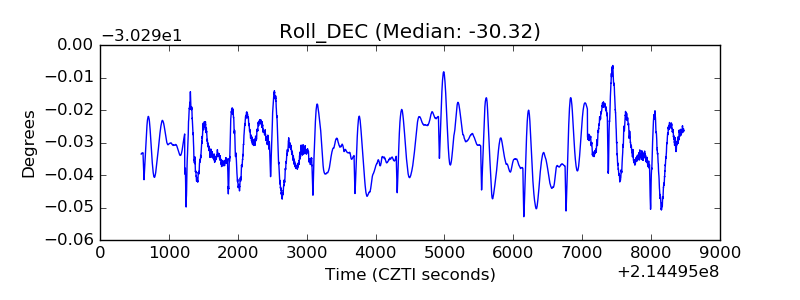 |
| _Roll_RA | 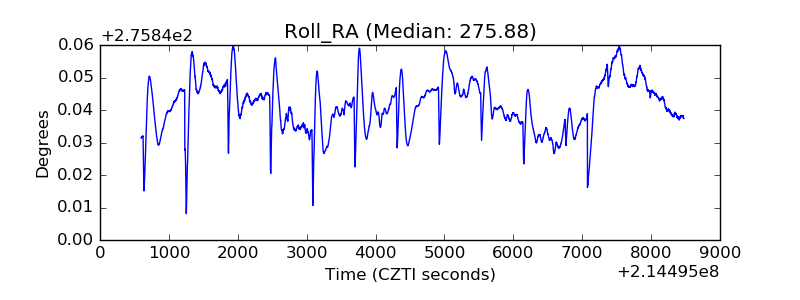 |
| Veto Counter | 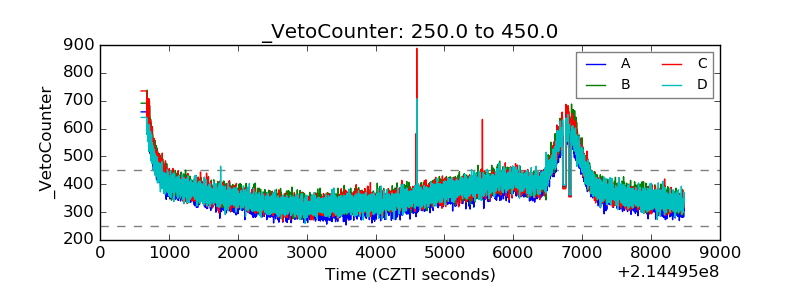 |