| Param | Original file | Final file |
|---|---|---|
| Filename | modeM0/AS1A02_098T01_9000000736_05722cztM0_level2.evt | modeM0/AS1A02_098T01_9000000736_05722cztM0_level2_quad_clean.evt |
| Size (bytes) | 532,704,960 | 91,261,440 |
| Size | 508.0 MB | 87.0 MB |
| Events in quadrant A | 3,679,156 | 561,304 |
| Events in quadrant B | 4,846,932 | 555,726 |
| Events in quadrant C | 3,325,037 | 574,519 |
| Events in quadrant D | 3,770,042 | 547,285 |
| Mode SS | |||
|---|---|---|---|
| Quadrant | BADHDUFLAG | Total packets | Discarded packets |
| A | 0 | 150 | 0 |
| B | 0 | 150 | 0 |
| C | 0 | 150 | 0 |
| D | 0 | 150 | 0 |
| Mode M0 | |||
|---|---|---|---|
| Quadrant | BADHDUFLAG | Total packets | Discarded packets |
| A | 0 | 16305 | 2 |
| B | 0 | 19312 | 1 |
| C | 0 | 15463 | 1 |
| D | 0 | 16426 | 1 |
| Quadrant | Total seconds | Saturated seconds | Saturation percentage |
|---|---|---|---|
| A | 7543 | 133 | 1.763224% |
| B | 7543 | 228 | 3.022670% |
| C | 7543 | 11 | 0.145831% |
| D | 7543 | 71 | 0.941270% |
Noise dominated data is calculated using 1-second bins in cleaned event files. If a bin has >2000 counts, and if more than 50% of those come from <1% of pixels, then it is considered to be noise-dominated and hence unusable.
| Quadrant | # 1 sec bins | Bins with >0 counts | Bins with >2000 counts | High rate bins dominated by noise | Noise dominated (total time) | Noise dominated (detector-on time) | Marked lightcurve |
|---|---|---|---|---|---|---|---|
| A | 7573 | 7544 | 80 | 80 | 1.06% | 1.06% | 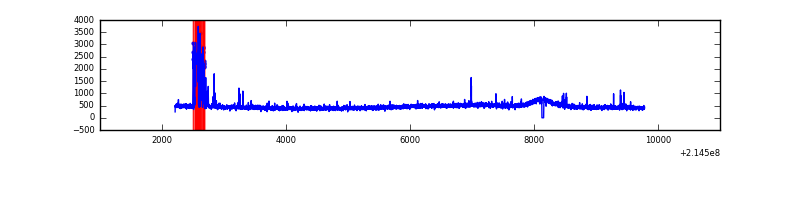 |
| B | 7573 | 7544 | 129 | 129 | 1.70% | 1.71% | 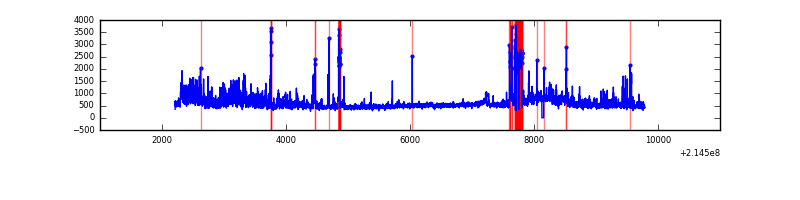 |
| C | 7573 | 7544 | 0 | 0 | 0.00% | 0.00% | 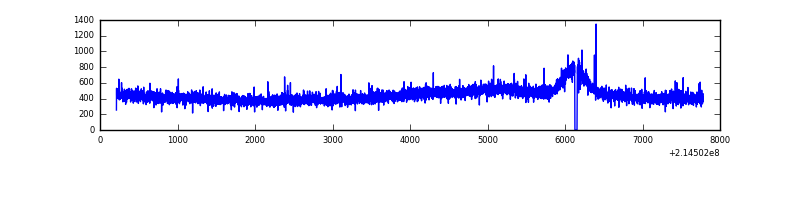 |
| D | 7573 | 7544 | 37 | 37 | 0.49% | 0.49% | 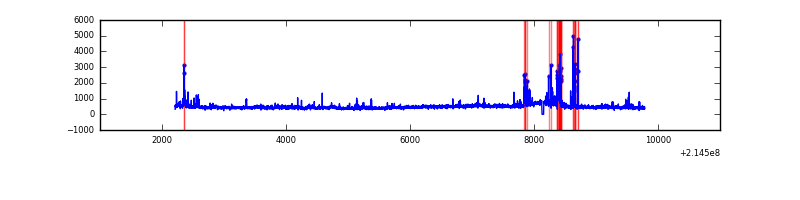 |
Top three noisy pixels from each quadrant. If the there are fewer than three noisy pixels in the level2.evt file, extra rows are filled as -1
| Pixel properties | Quadrant properties | ||||||
|---|---|---|---|---|---|---|---|
| Quadrant | DetID | PixID | Counts | Sigma | Mean | Median | Sigma |
| A | 0 | 50 | 286499 | 1600.72 | 868 | 847 | 178.5 |
| A | 13 | 14 | 13016 | 68.19 | 868 | 847 | 178.5 |
| A | 14 | 31 | 12788 | 66.91 | 868 | 847 | 178.5 |
| B | 15 | 204 | 728121 | 4346.28 | 869 | 849 | 167.3 |
| B | 5 | 172 | 400833 | 2390.36 | 869 | 849 | 167.3 |
| B | 11 | 51 | 90896 | 538.13 | 869 | 849 | 167.3 |
| C | 1 | 16 | 7428 | 33.27 | 846 | 851 | 197.7 |
| C | 13 | 61 | 7018 | 31.19 | 846 | 851 | 197.7 |
| C | 10 | 34 | 6974 | 30.97 | 846 | 851 | 197.7 |
| D | 2 | 152 | 117672 | 565.76 | 843 | 815 | 206.6 |
| D | 11 | 241 | 102529 | 492.44 | 843 | 815 | 206.6 |
| D | 4 | 95 | 70342 | 336.61 | 843 | 815 | 206.6 |
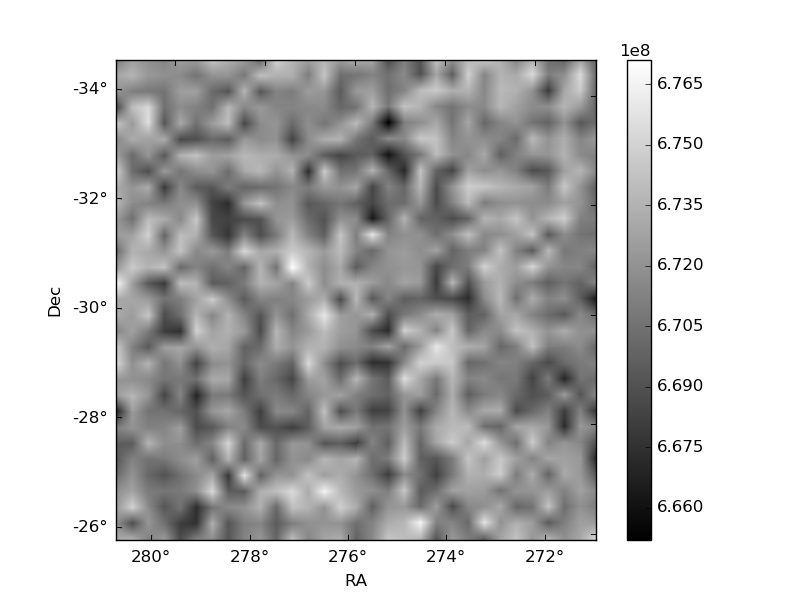
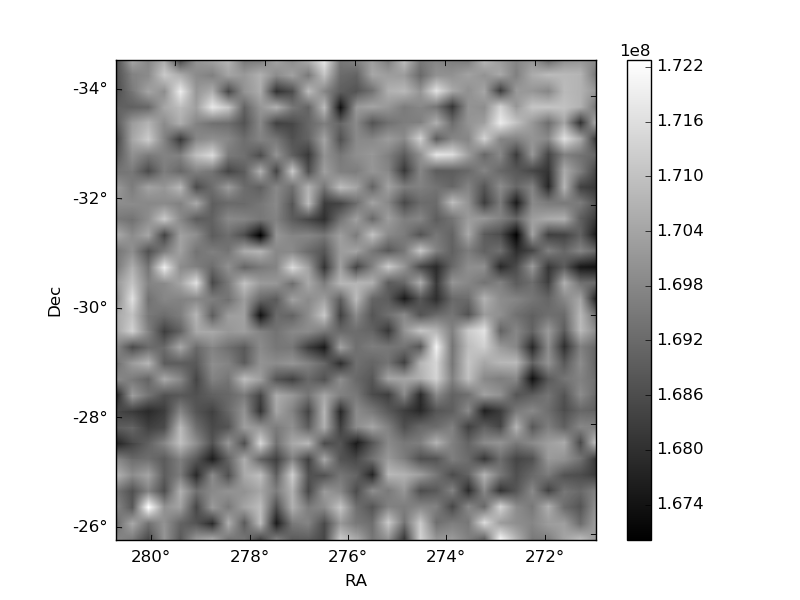
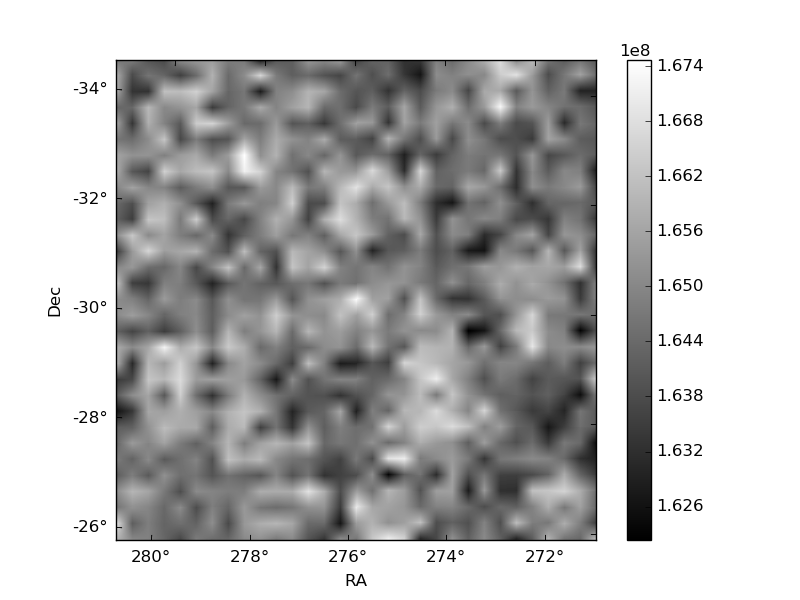
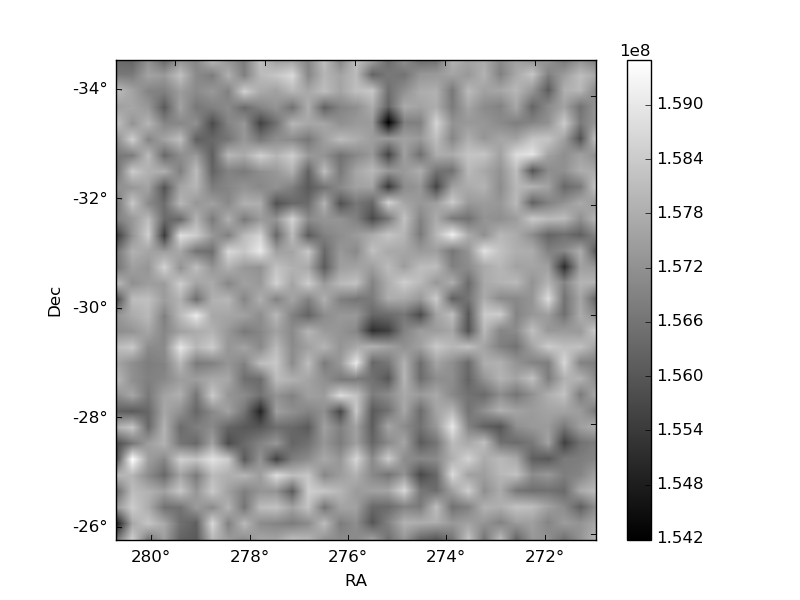
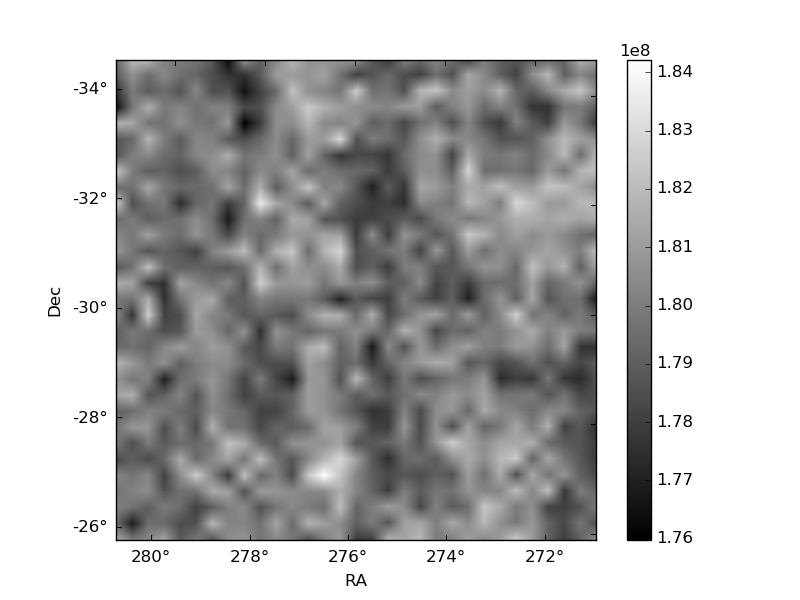
Histogram calculated using DETX and DETY for each event in the final _common_clean file
| Quadrant A | 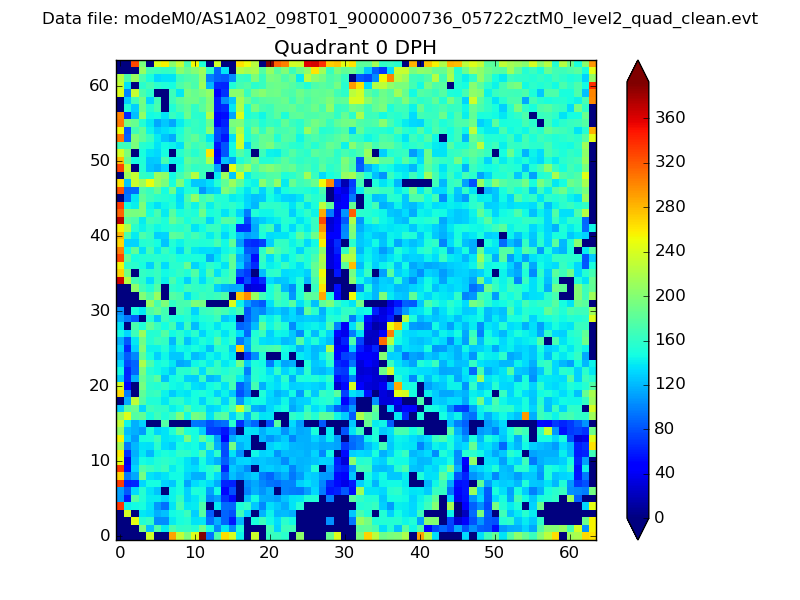 |
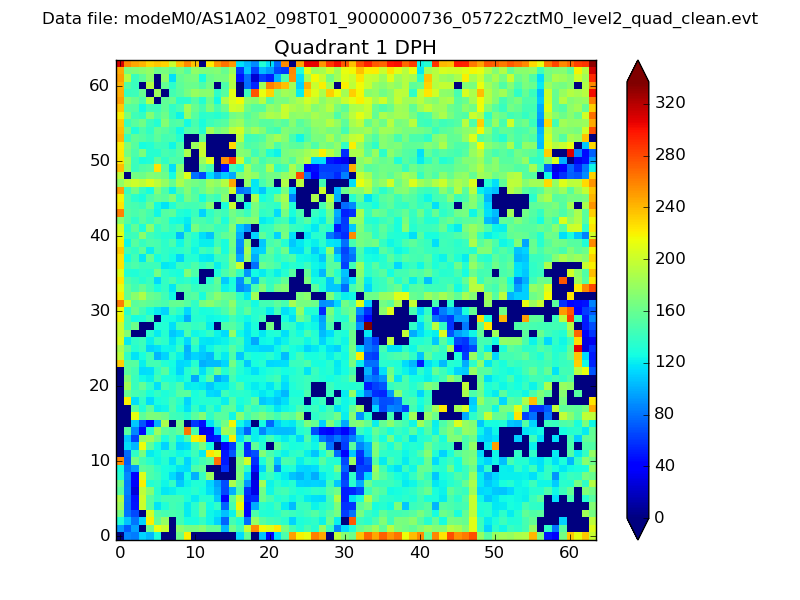 |
Quadrant B |
|---|---|---|---|
| Quadrant D | 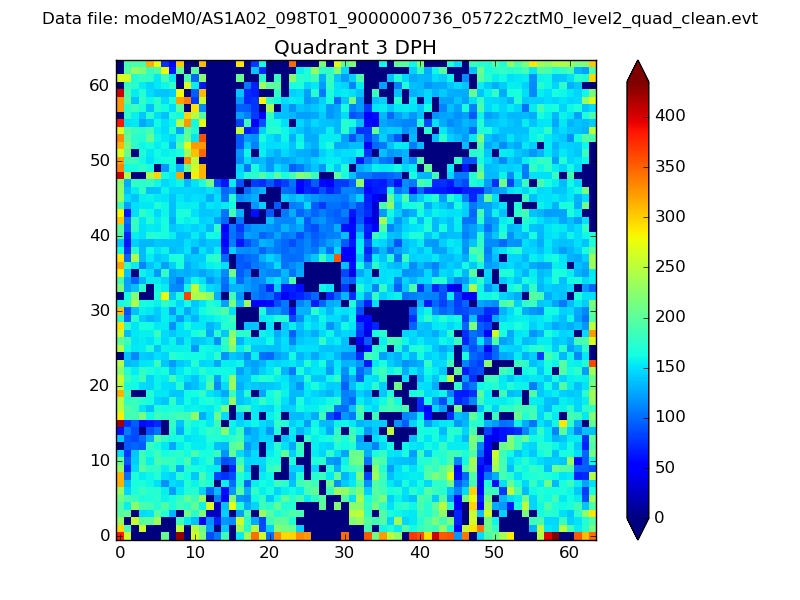 |
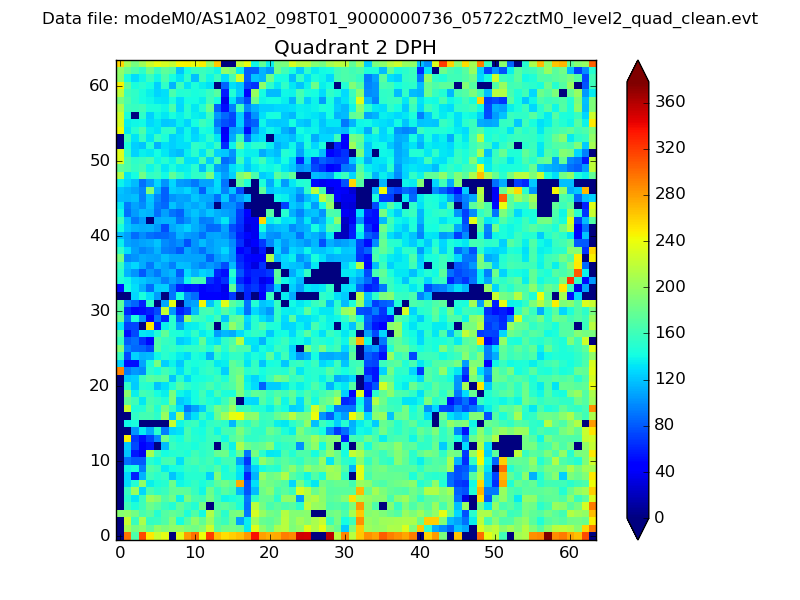 |
Quadrant C |
| Plot type | Count rate plots | Images |
|---|---|---|
| Comparison with Poisson distribution Blue bars denote a histogram of data divided into 1 sec bins. Red curve is a Poisson curve with rate = median count rate of data. |
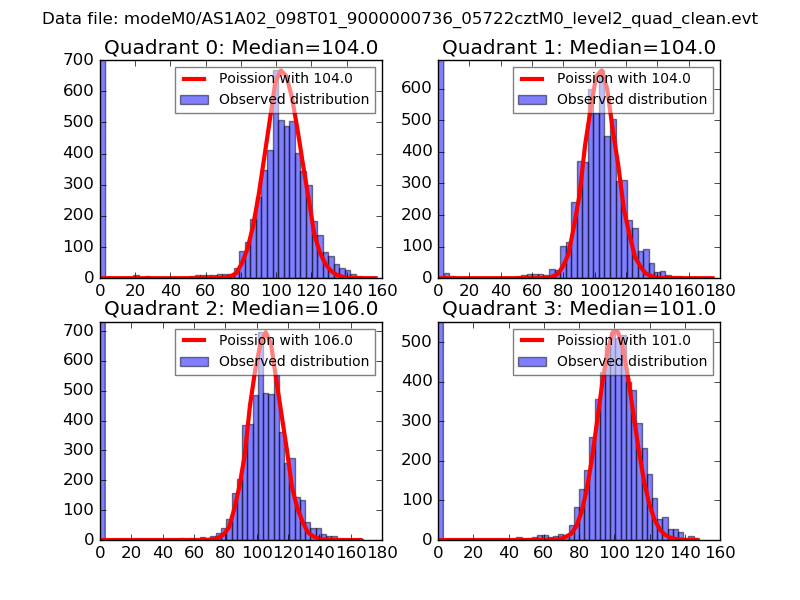 |
 |
| Quadrant-wise count rates Data is divided into 100 sec bins |
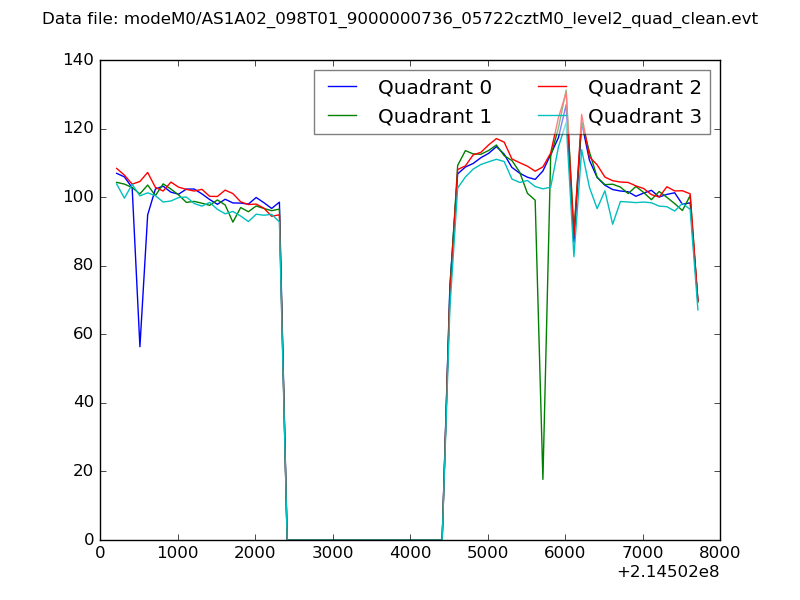 |
|
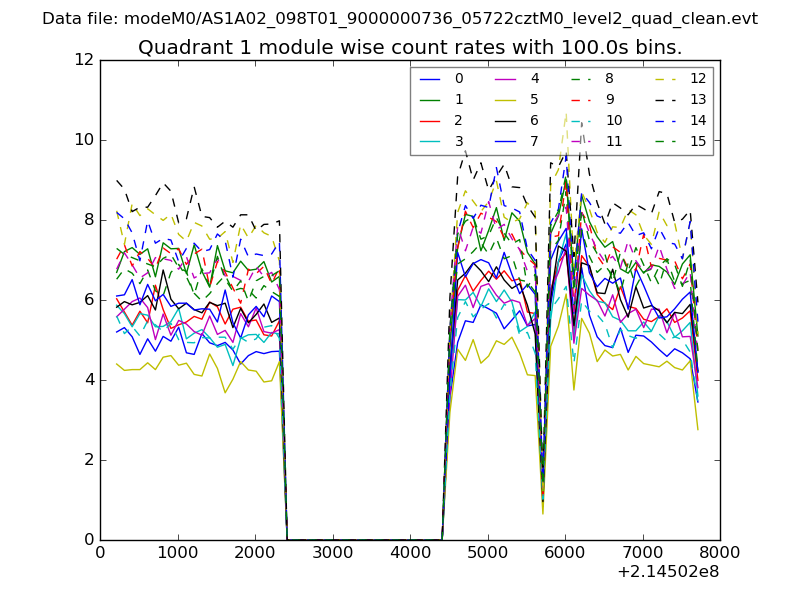
| Module-wise count rates for Quadrant A Data is divided into 100 sec bins |
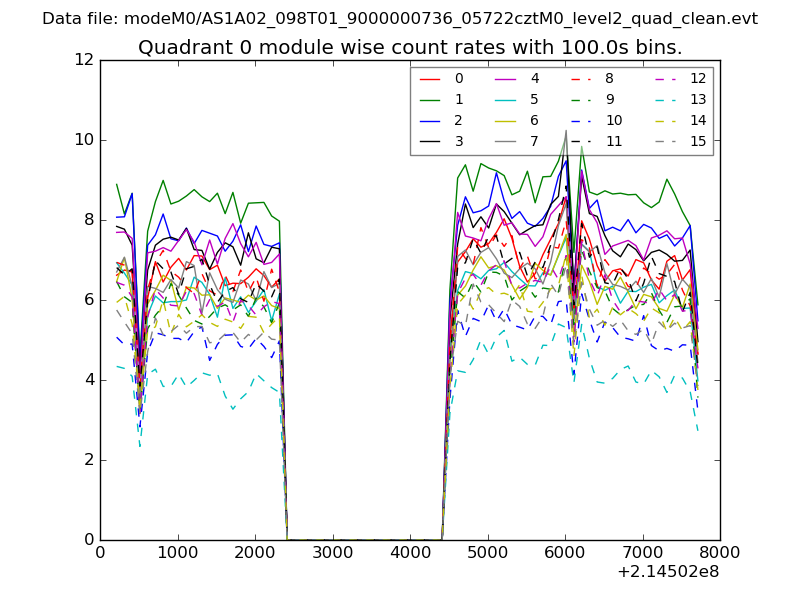 |
 |
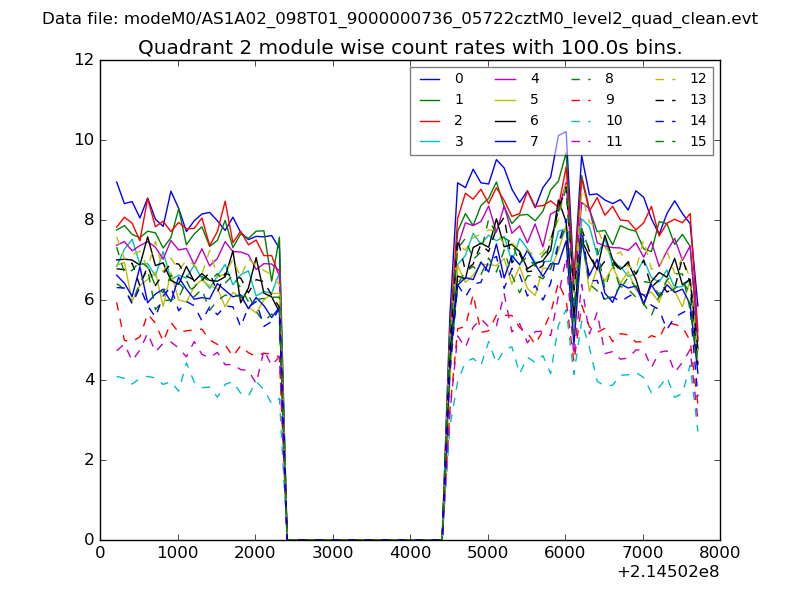
| Module-wise count rates for Quadrant B Data is divided into 100 sec bins |
 |
 |
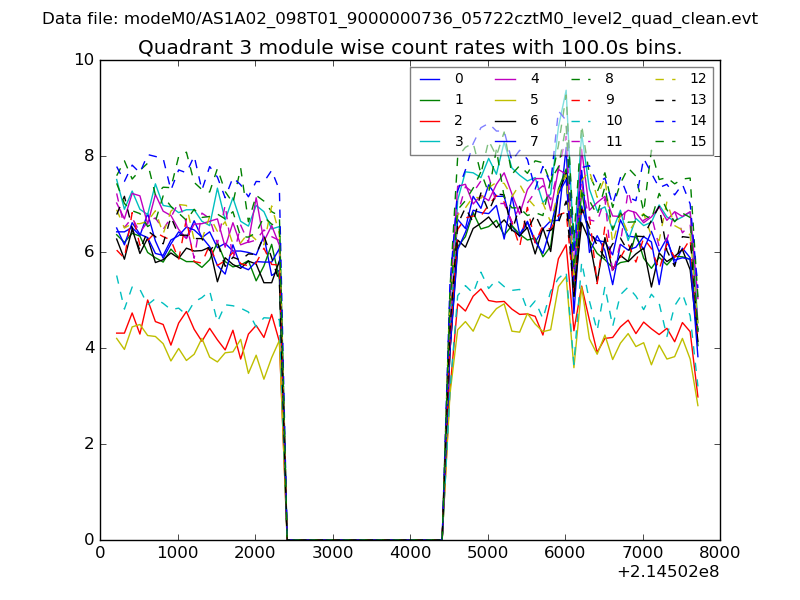
| Module-wise count rates for Quadrant C Data is divided into 100 sec bins |
 |
 |
| Module-wise count rates for Quadrant D Data is divided into 100 sec bins |
 |
 |
| Parameter | Plot |
|---|---|
| CZT HV Monitor | 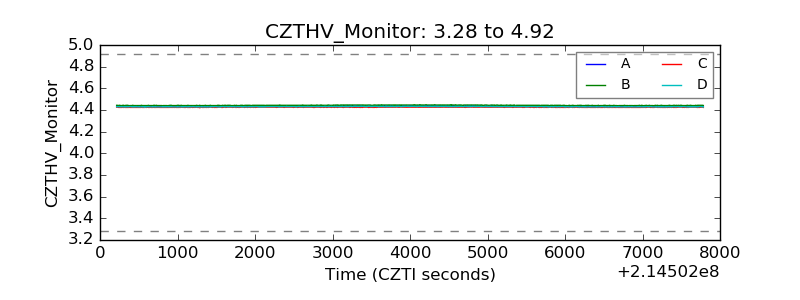 |
| D_VDD | 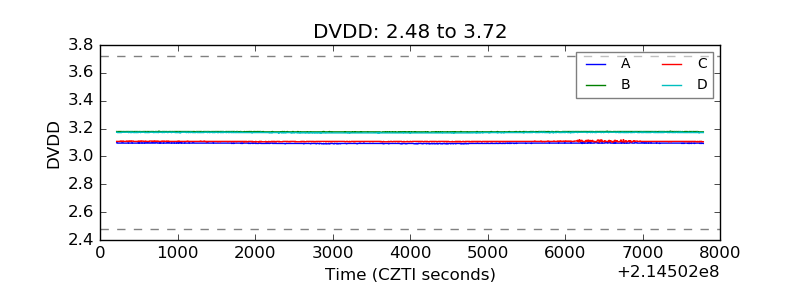 |
| Temperature 1 | 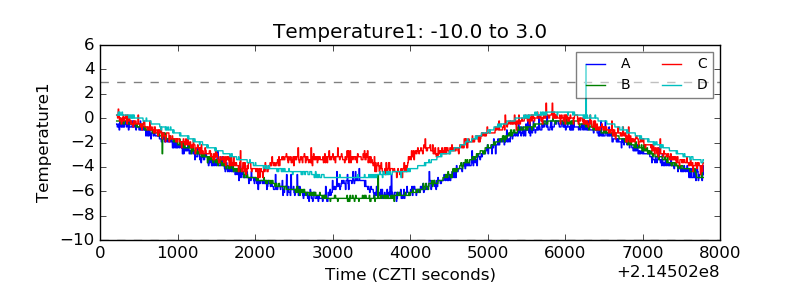 |
| Veto HV Monitor |  |
| Veto LLD | 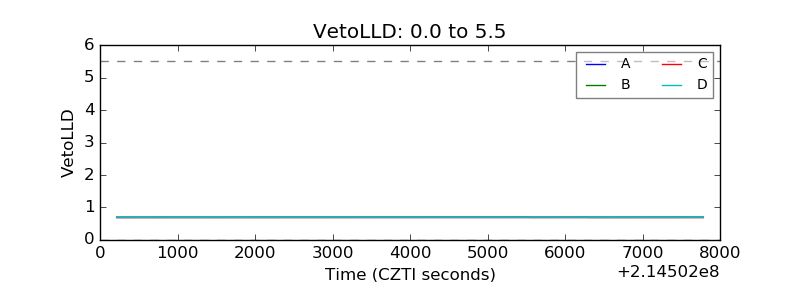 |
| Alpha Counter | 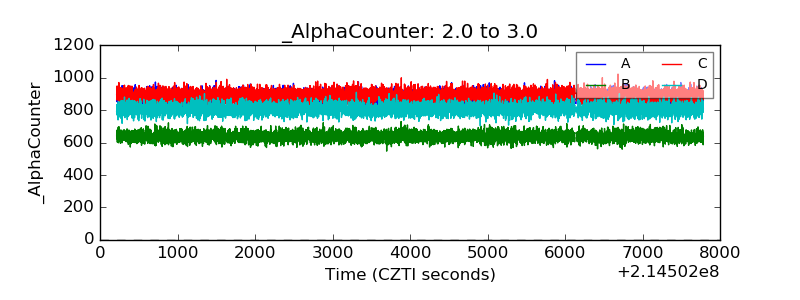 |
| _CPM_Rate |  |
| CZT Counter | 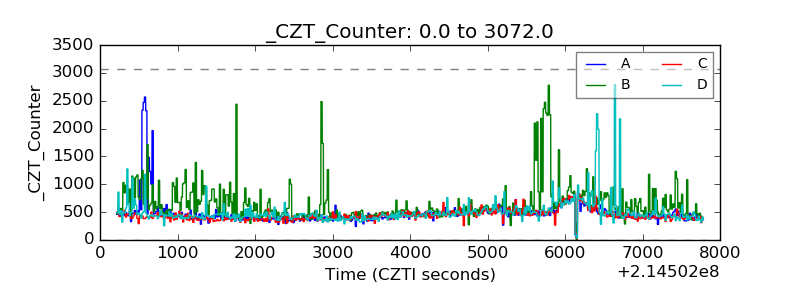 |
| +2.5 Volts monitor |  |
| +5 Volts monitor |  |
| _ROLL_ROT |  |
| _Roll_DEC | 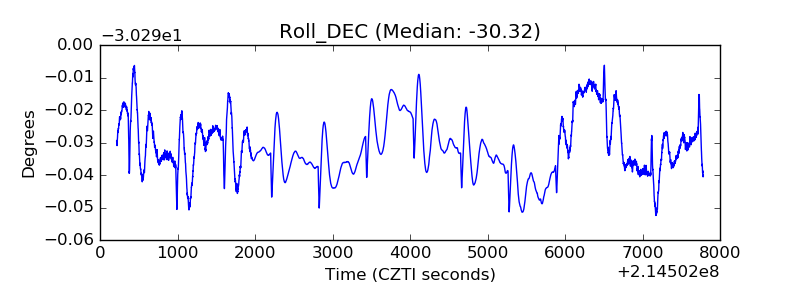 |
| _Roll_RA | 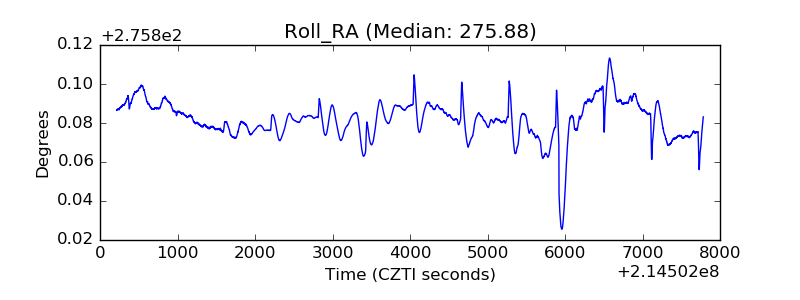 |
| Veto Counter | 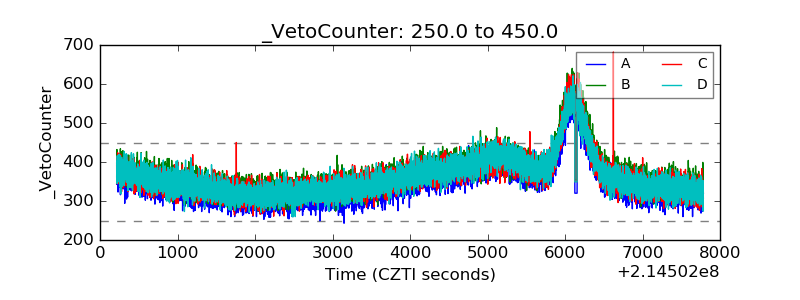 |