| Param | Original file | Final file |
|---|---|---|
| Filename | modeM0/AS1A02_098T01_9000000736_05727cztM0_level2.evt | modeM0/AS1A02_098T01_9000000736_05727cztM0_level2_quad_clean.evt |
| Size (bytes) | 452,678,400 | 77,693,760 |
| Size | 431.7 MB | 74.1 MB |
| Events in quadrant A | 3,006,314 | 473,353 |
| Events in quadrant B | 3,681,578 | 474,581 |
| Events in quadrant C | 2,990,622 | 480,378 |
| Events in quadrant D | 3,575,000 | 456,872 |
| Mode SS | |||
|---|---|---|---|
| Quadrant | BADHDUFLAG | Total packets | Discarded packets |
| A | 0 | 136 | 0 |
| B | 0 | 136 | 0 |
| C | 0 | 136 | 0 |
| D | 0 | 136 | 0 |
| Mode M0 | |||
|---|---|---|---|
| Quadrant | BADHDUFLAG | Total packets | Discarded packets |
| A | 0 | 13733 | 1 |
| B | 0 | 15304 | 1 |
| C | 0 | 13768 | 1 |
| D | 0 | 15277 | 1 |
| Mode M9 | |||
|---|---|---|---|
| Quadrant | BADHDUFLAG | Total packets | Discarded packets |
| A | 0 | 4 | 0 |
| B | 0 | 4 | 0 |
| C | 0 | 4 | 0 |
| D | 0 | 4 | 0 |
| Quadrant | Total seconds | Saturated seconds | Saturation percentage |
|---|---|---|---|
| A | 6707 | 37 | 0.551662% |
| B | 6707 | 83 | 1.237513% |
| C | 6707 | 9 | 0.134188% |
| D | 6707 | 123 | 1.833905% |
Noise dominated data is calculated using 1-second bins in cleaned event files. If a bin has >2000 counts, and if more than 50% of those come from <1% of pixels, then it is considered to be noise-dominated and hence unusable.
| Quadrant | # 1 sec bins | Bins with >0 counts | Bins with >2000 counts | High rate bins dominated by noise | Noise dominated (total time) | Noise dominated (detector-on time) | Marked lightcurve |
|---|---|---|---|---|---|---|---|
| A | 7077 | 6708 | 9 | 9 | 0.13% | 0.13% | 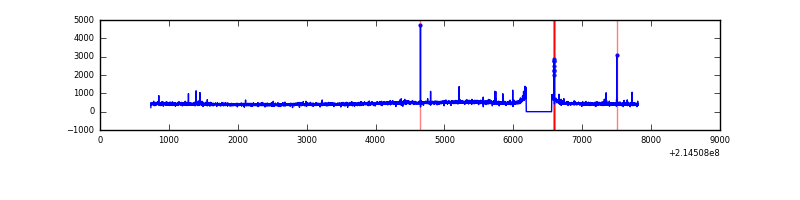 |
| B | 7077 | 6708 | 35 | 35 | 0.49% | 0.52% | 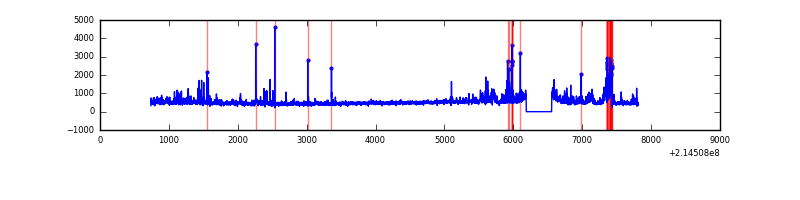 |
| C | 7077 | 6708 | 5 | 5 | 0.07% | 0.07% | 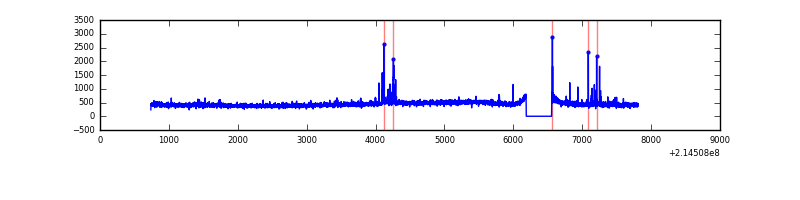 |
| D | 7077 | 6708 | 99 | 99 | 1.40% | 1.48% | 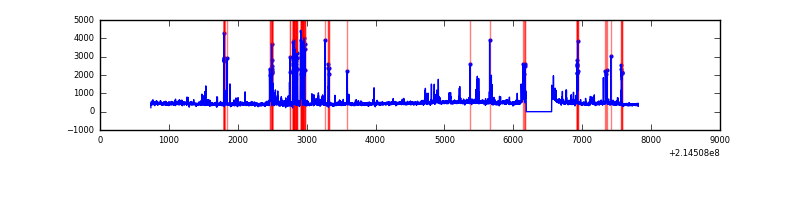 |
Top three noisy pixels from each quadrant. If the there are fewer than three noisy pixels in the level2.evt file, extra rows are filled as -1
| Pixel properties | Quadrant properties | ||||||
|---|---|---|---|---|---|---|---|
| Quadrant | DetID | PixID | Counts | Sigma | Mean | Median | Sigma |
| A | 7 | 16 | 24326 | 151.36 | 759 | 741 | 155.8 |
| A | 15 | 174 | 17950 | 110.44 | 759 | 741 | 155.8 |
| A | 0 | 31 | 14897 | 90.85 | 759 | 741 | 155.8 |
| B | 15 | 204 | 241327 | 1623.24 | 768 | 750 | 148.2 |
| B | 5 | 172 | 188510 | 1266.87 | 768 | 750 | 148.2 |
| B | 0 | 219 | 66416 | 443.07 | 768 | 750 | 148.2 |
| C | 1 | 16 | 82434 | 473.22 | 737 | 742 | 172.6 |
| C | 9 | 16 | 15672 | 86.49 | 737 | 742 | 172.6 |
| C | 14 | 67 | 8309 | 43.83 | 737 | 742 | 172.6 |
| D | 0 | 11 | 432419 | 2388.01 | 730 | 708 | 180.8 |
| D | 2 | 152 | 84653 | 464.34 | 730 | 708 | 180.8 |
| D | 2 | 33 | 81307 | 445.83 | 730 | 708 | 180.8 |
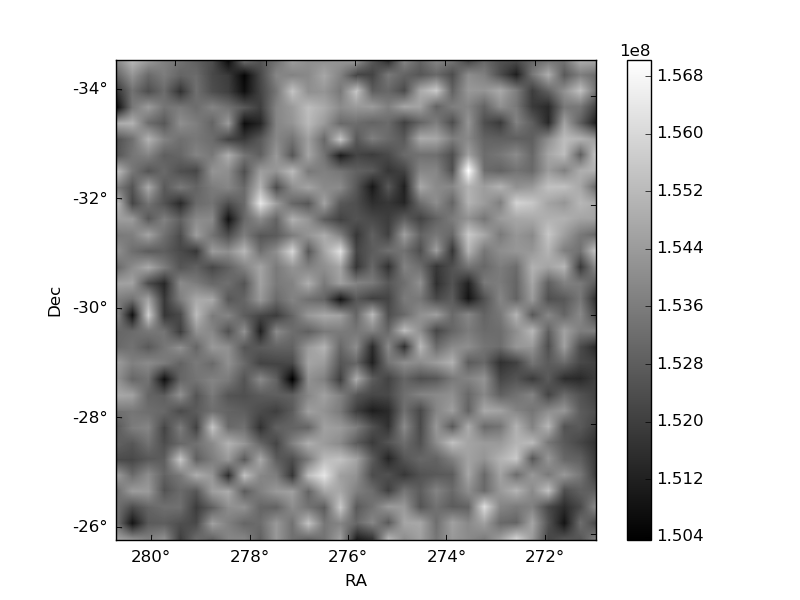
Histogram calculated using DETX and DETY for each event in the final _common_clean file
| Quadrant A | 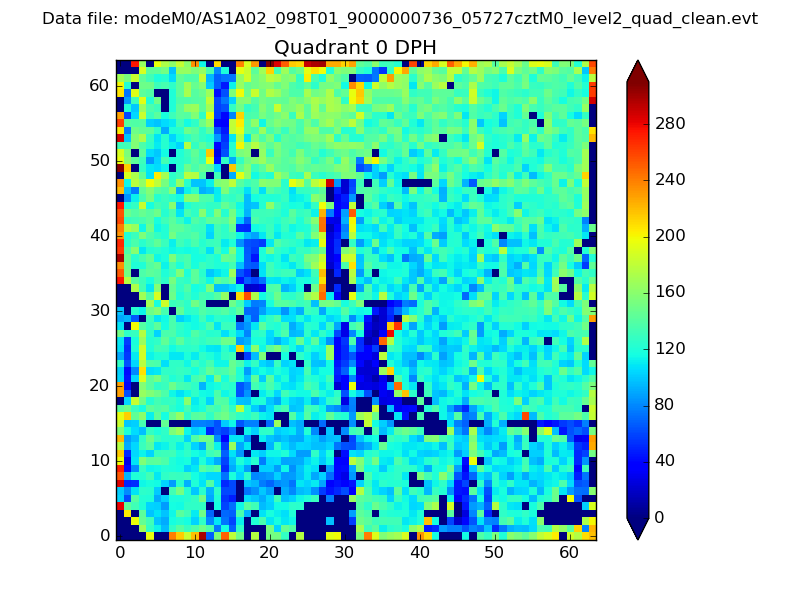 |
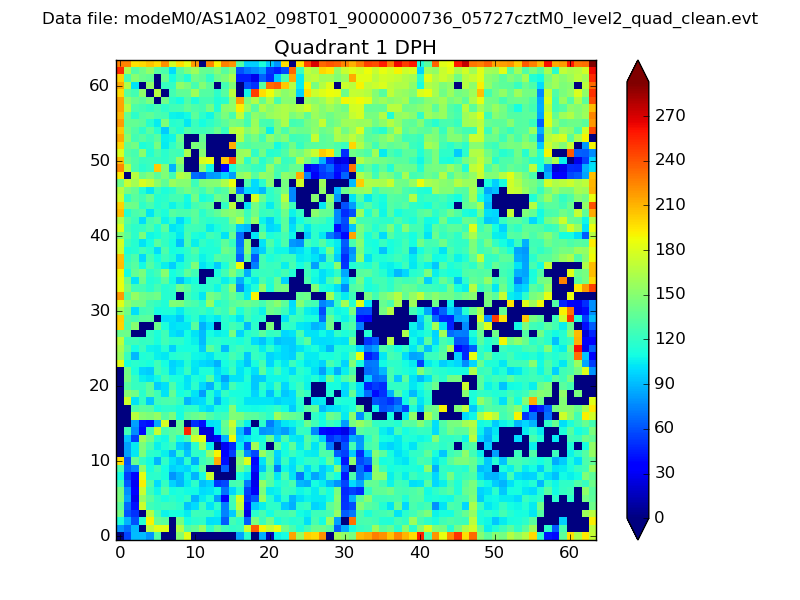 |
Quadrant B |
|---|---|---|---|
| Quadrant D | 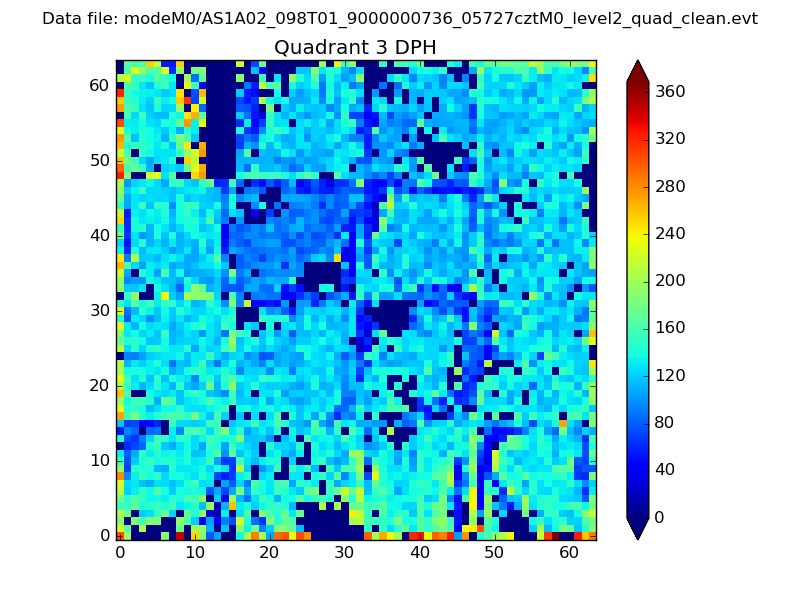 |
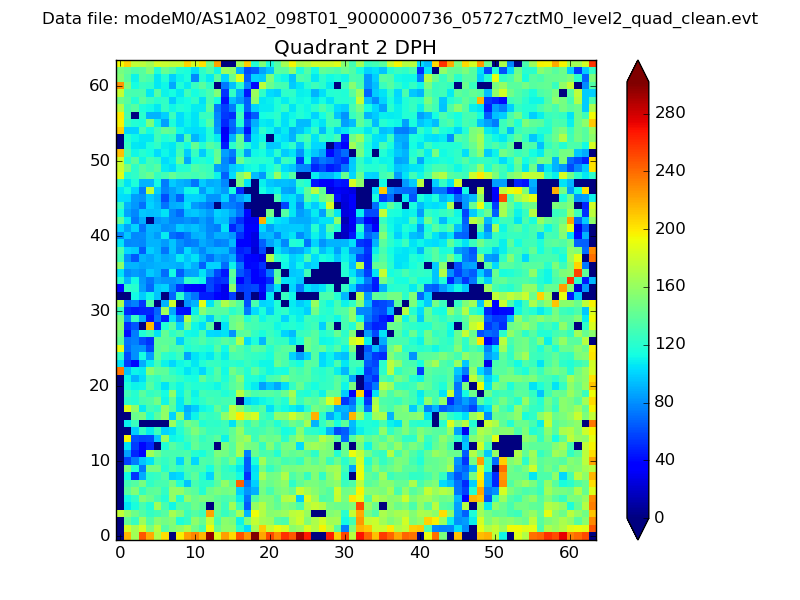 |
Quadrant C |
| Plot type | Count rate plots | Images |
|---|---|---|
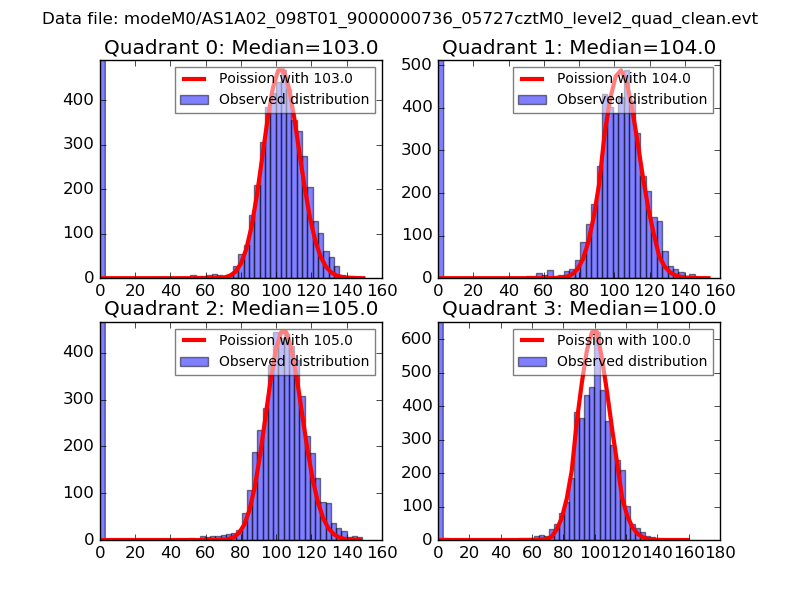
| Comparison with Poisson distribution Blue bars denote a histogram of data divided into 1 sec bins. Red curve is a Poisson curve with rate = median count rate of data. |
 |
 |
| Quadrant-wise count rates Data is divided into 100 sec bins |
 |
|
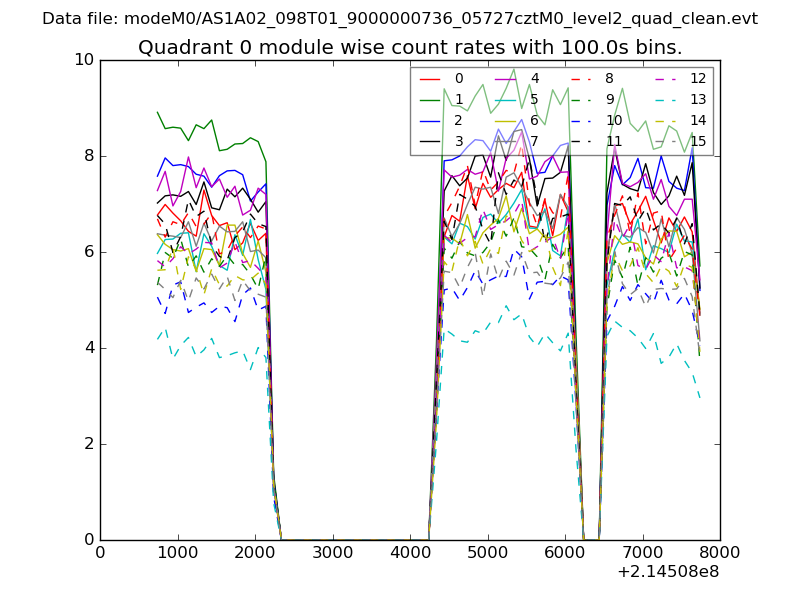
| Module-wise count rates for Quadrant A Data is divided into 100 sec bins |
 |
 |
| Module-wise count rates for Quadrant B Data is divided into 100 sec bins |
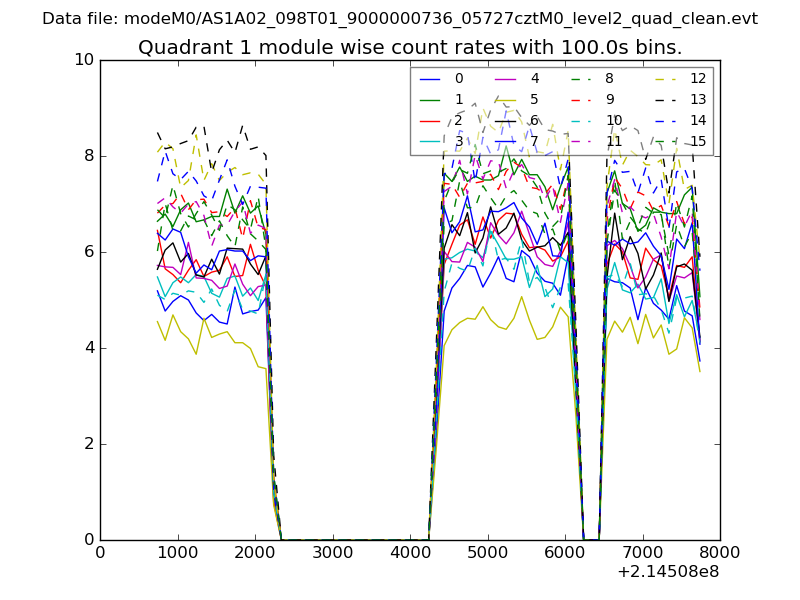 |
 |
| Module-wise count rates for Quadrant C Data is divided into 100 sec bins |
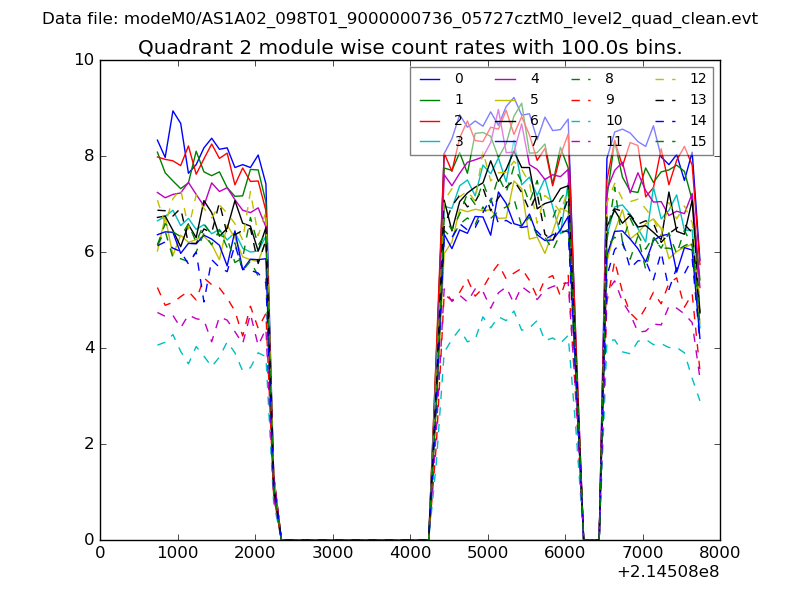 |
 |
| Module-wise count rates for Quadrant D Data is divided into 100 sec bins |
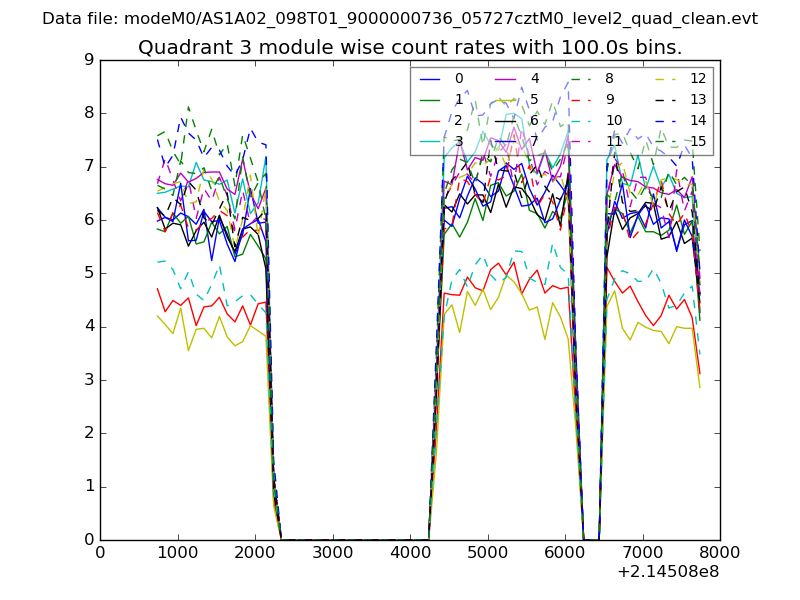 |
 |
| Parameter | Plot |
|---|---|
| CZT HV Monitor | 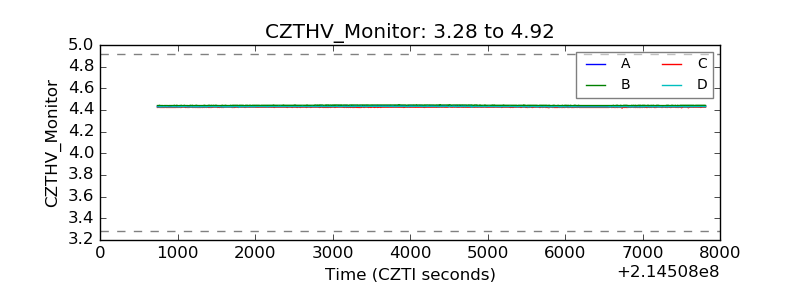 |
| D_VDD | 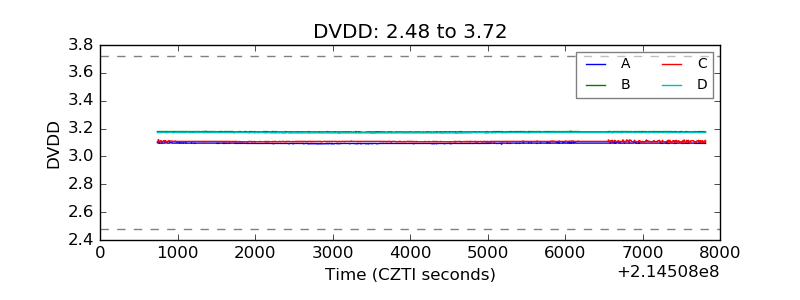 |
| Temperature 1 | 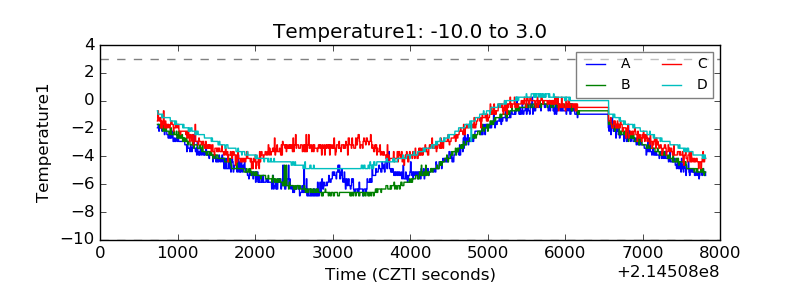 |
| Veto HV Monitor |  |
| Veto LLD | 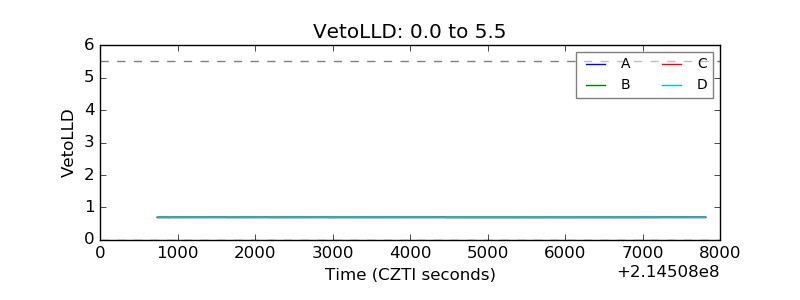 |
| Alpha Counter | 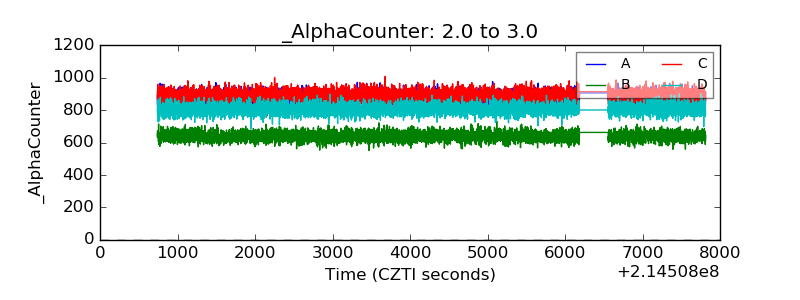 |
| _CPM_Rate | 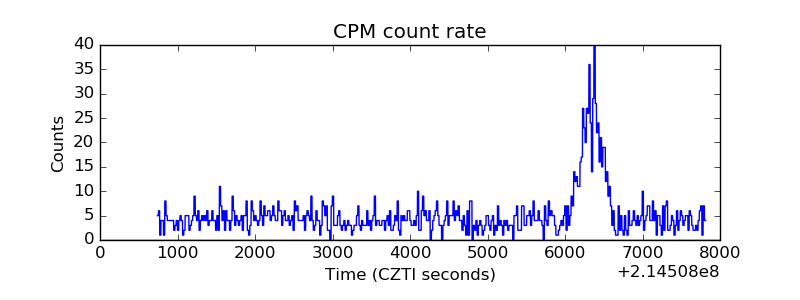 |
| CZT Counter | 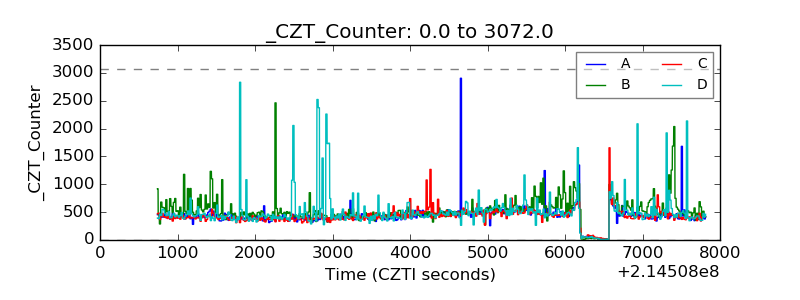 |
| +2.5 Volts monitor |  |
| +5 Volts monitor |  |
| _ROLL_ROT | 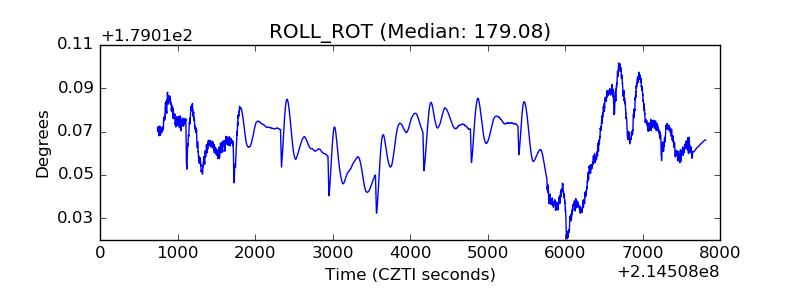 |
| _Roll_DEC | 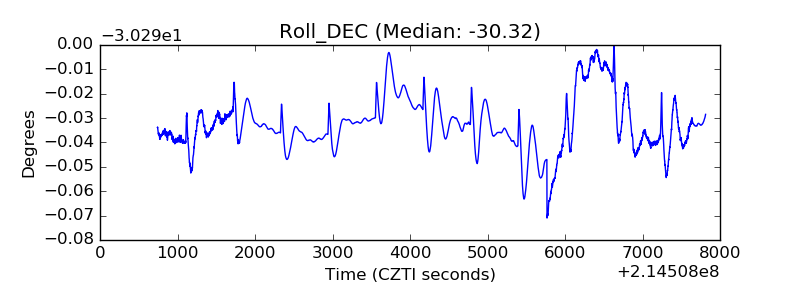 |
| _Roll_RA | 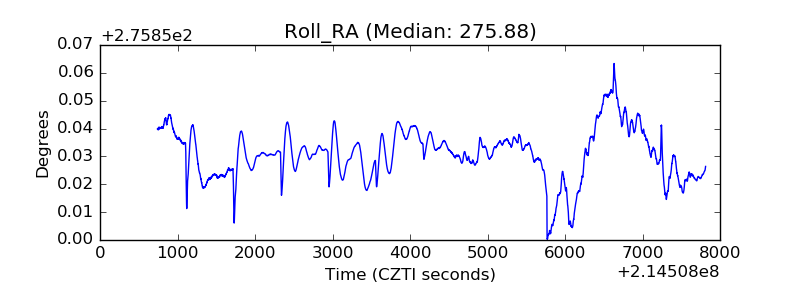 |
| Veto Counter | 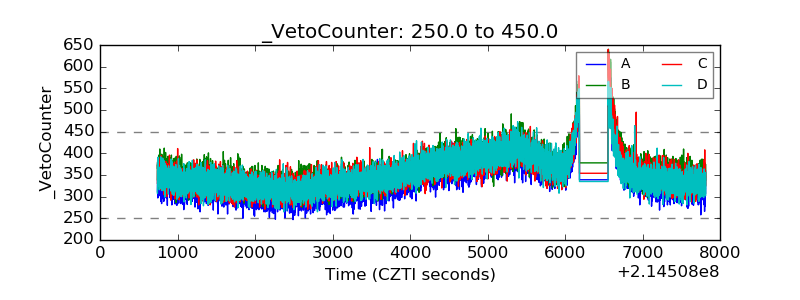 |