| Param | Original file | Final file |
|---|---|---|
| Filename | modeM0/AS1A02_150T01_9000000738cztM0_level2.fits | modeM0/AS1A02_150T01_9000000738cztM0_level2_quad_clean.evt |
| Size (bytes) | 509,060,160 | 485,395,200 |
| Size | 485.5 MB | 462.9 MB |
| Events in quadrant A | 3,081,880 | 2,844,734 |
| Events in quadrant B | 2,992,572 | 2,873,846 |
| Events in quadrant C | 3,046,448 | 2,775,026 |
| Events in quadrant D | 2,620,196 | 2,530,665 |
| Mode M0 | |||
|---|---|---|---|
| Quadrant | BADHDUFLAG | Total packets | Discarded packets |
| A | 0 | 109814 | 0 |
| B | 0 | 118007 | 0 |
| C | 0 | 109672 | 0 |
| D | 0 | 121502 | 0 |
| Mode M9 | |||
|---|---|---|---|
| Quadrant | BADHDUFLAG | Total packets | Discarded packets |
| A | 0 | 103 | 0 |
| B | 0 | 103 | 0 |
| C | 0 | 103 | 0 |
| D | 0 | 103 | 0 |
| Mode SS | |||
|---|---|---|---|
| Quadrant | BADHDUFLAG | Total packets | Discarded packets |
| A | 0 | 1090 | 0 |
| B | 0 | 1090 | 0 |
| C | 0 | 1090 | 0 |
| D | 0 | 1090 | 0 |
| Quadrant | Total seconds | Saturated seconds | Saturation percentage |
|---|---|---|---|
| A | 53572 | 447 | 0.834391% |
| B | 53593 | 593 | 1.106488% |
| C | 53571 | 386 | 0.720539% |
| D | 53559 | 1083 | 2.022069% |
Noise dominated data is calculated using 1-second bins in cleaned event files. If a bin has >2000 counts, and if more than 50% of those come from <1% of pixels, then it is considered to be noise-dominated and hence unusable.
| Quadrant | # 1 sec bins | Bins with >0 counts | Bins with >2000 counts | High rate bins dominated by noise | Noise dominated (total time) | Noise dominated (detector-on time) | Marked lightcurve |
|---|---|---|---|---|---|---|---|
| A | 63937 | 53661 | 0 | 0 | 0.00% | 0.00% | 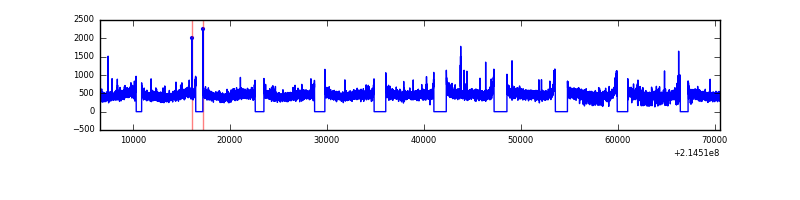 |
| B | 63937 | 53658 | 0 | 0 | 0.00% | 0.00% | 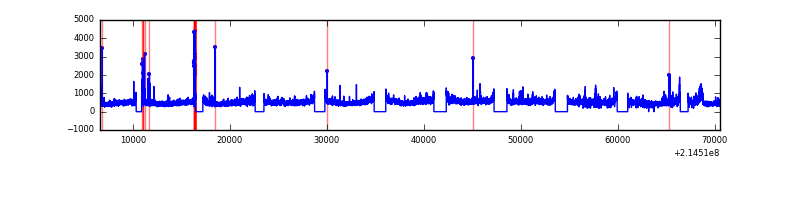 |
| C | 63937 | 53659 | 0 | 0 | 0.00% | 0.00% |  |
| D | 63937 | 53643 | 0 | 0 | 0.00% | 0.00% | 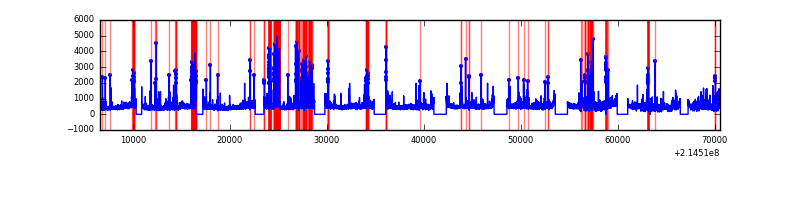 |
Top three noisy pixels from each quadrant. If the there are fewer than three noisy pixels in the level2.evt file, extra rows are filled as -1
| Pixel properties | Quadrant properties | ||||||
|---|---|---|---|---|---|---|---|
| Quadrant | DetID | PixID | Counts | Sigma | Mean | Median | Sigma |
| A | 0 | 29 | 2941 | 10.82 | 800 | 748 | 202.6 |
| A | 7 | 110 | 2654 | 9.41 | 800 | 748 | 202.6 |
| A | 0 | 30 | 2351 | 7.91 | 800 | 748 | 202.6 |
| B | 2 | 9 | 2593 | 11.52 | 788 | 749 | 160.1 |
| B | 5 | 128 | 2063 | 8.21 | 788 | 749 | 160.1 |
| B | 14 | 254 | 2047 | 8.11 | 788 | 749 | 160.1 |
| C | 1 | 80 | 2193 | 6.77 | 804 | 745 | 213.9 |
| C | 12 | 241 | 2126 | 6.46 | 804 | 745 | 213.9 |
| C | 1 | 81 | 2114 | 6.4 | 804 | 745 | 213.9 |
| D | 11 | 82 | 2067 | 6.94 | 747 | 679 | 200.1 |
| D | 6 | 231 | 2029 | 6.75 | 747 | 679 | 200.1 |
| D | 3 | 14 | 2010 | 6.65 | 747 | 679 | 200.1 |
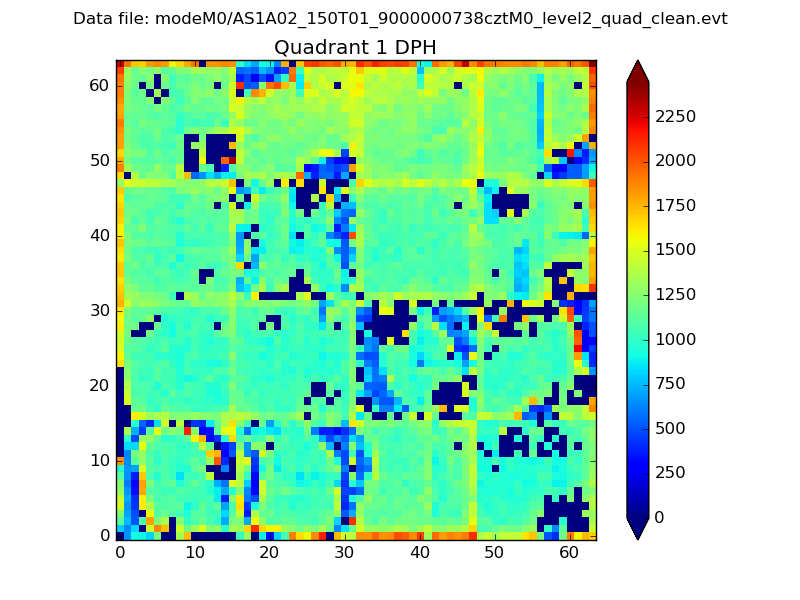
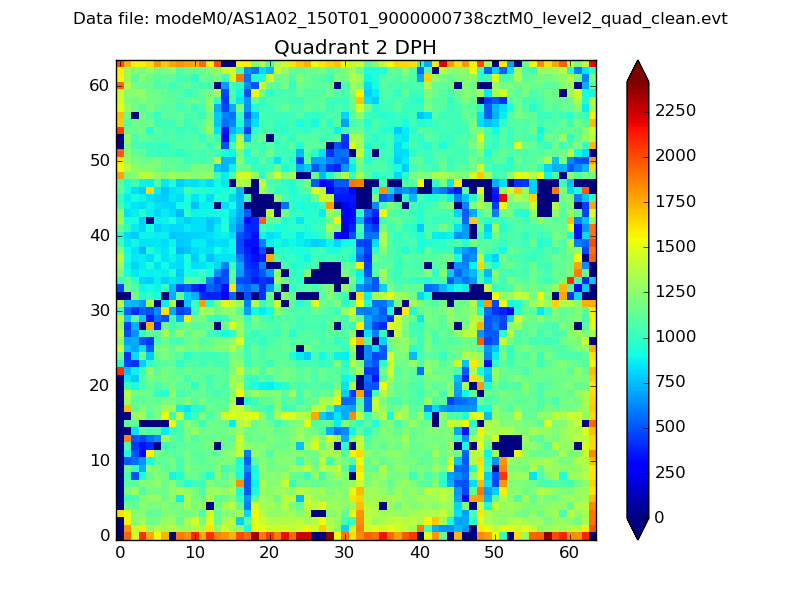
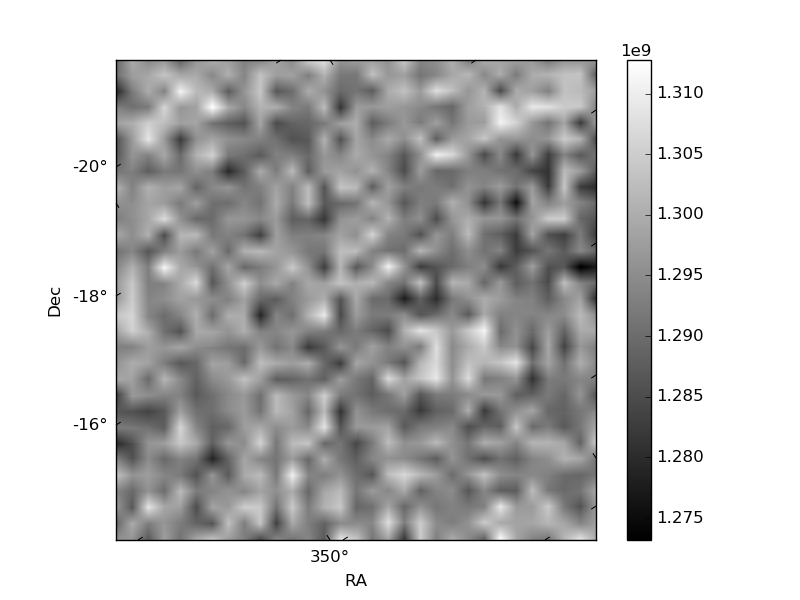
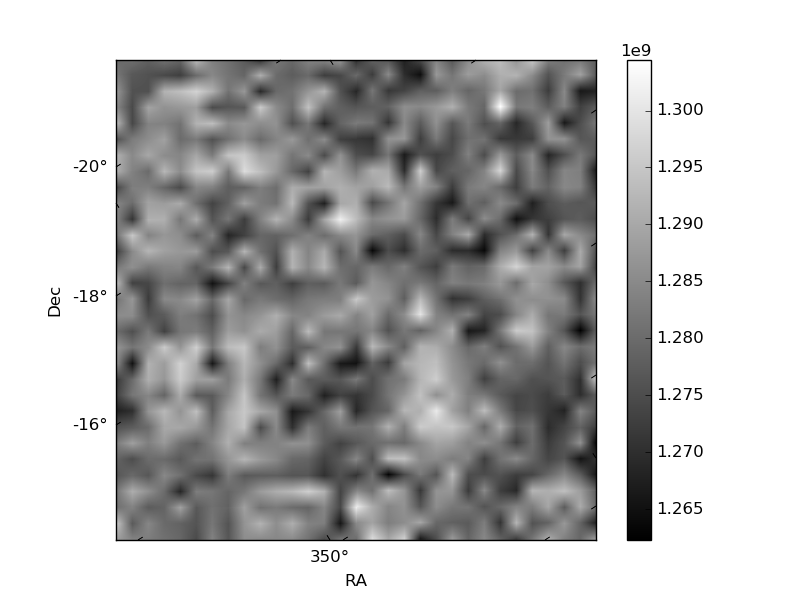
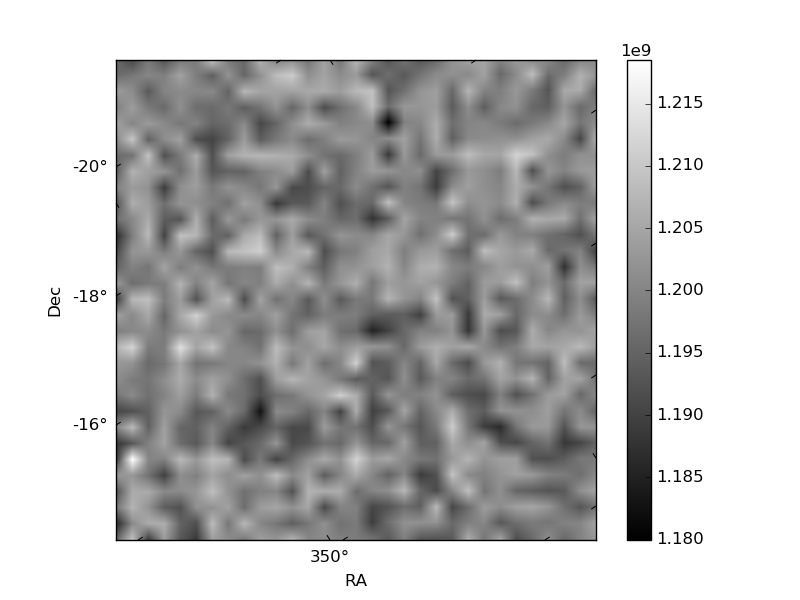
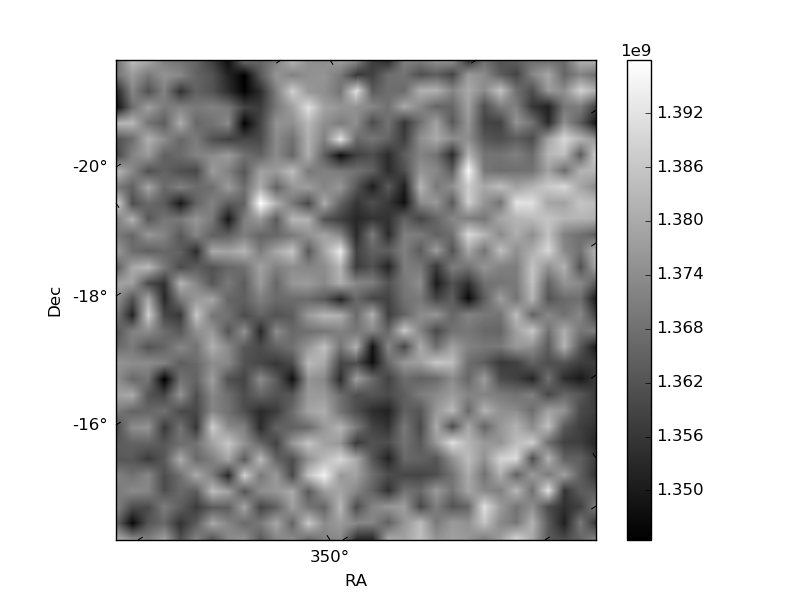
Histogram calculated using DETX and DETY for each event in the final _common_clean file
| Quadrant A | 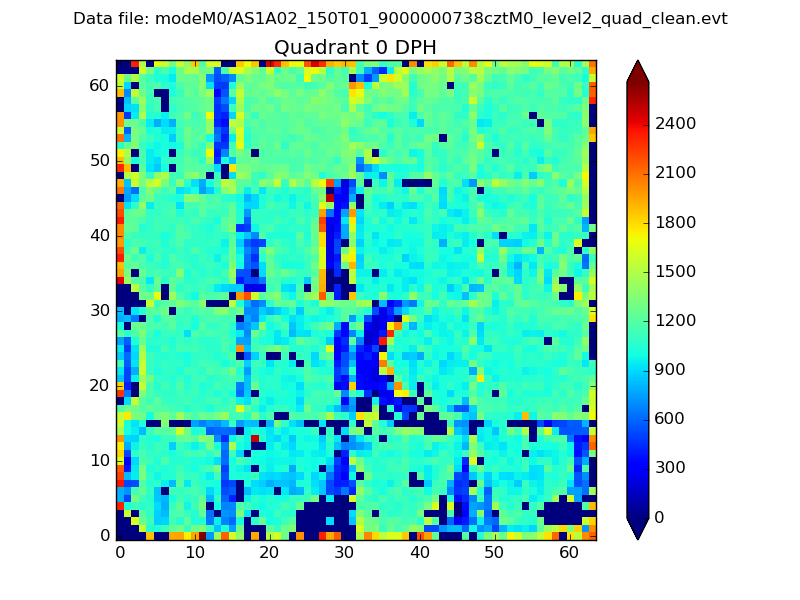 |
 |
Quadrant B |
|---|---|---|---|
| Quadrant D | 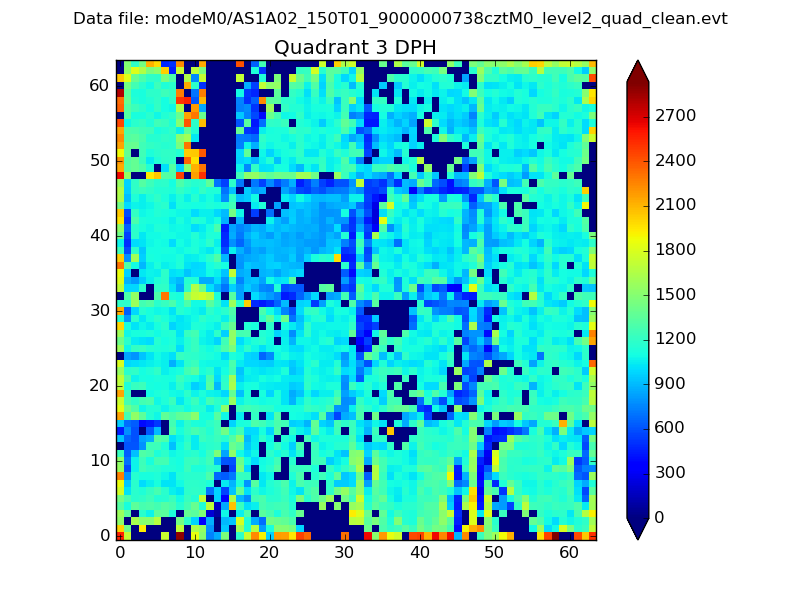 |
 |
Quadrant C |
| Plot type | Count rate plots | Images |
|---|---|---|
| Comparison with Poisson distribution Blue bars denote a histogram of data divided into 1 sec bins. Red curve is a Poisson curve with rate = median count rate of data. |
 |
 |
| Quadrant-wise count rates Data is divided into 100 sec bins |
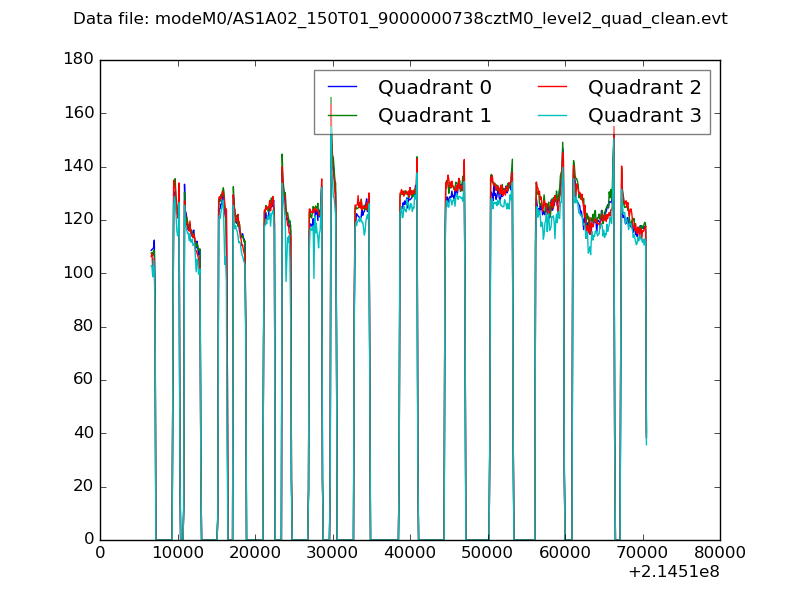 |
|
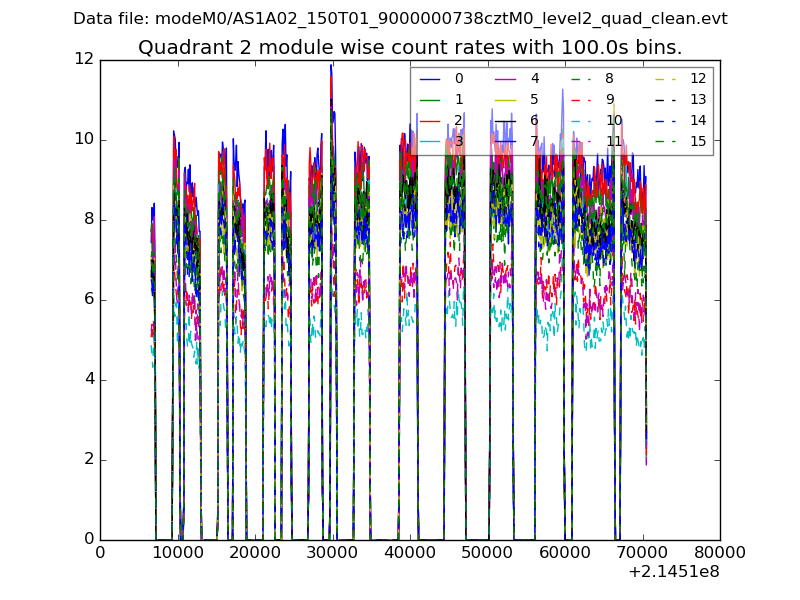
| Module-wise count rates for Quadrant A Data is divided into 100 sec bins |
 |
 |
| Module-wise count rates for Quadrant B Data is divided into 100 sec bins |
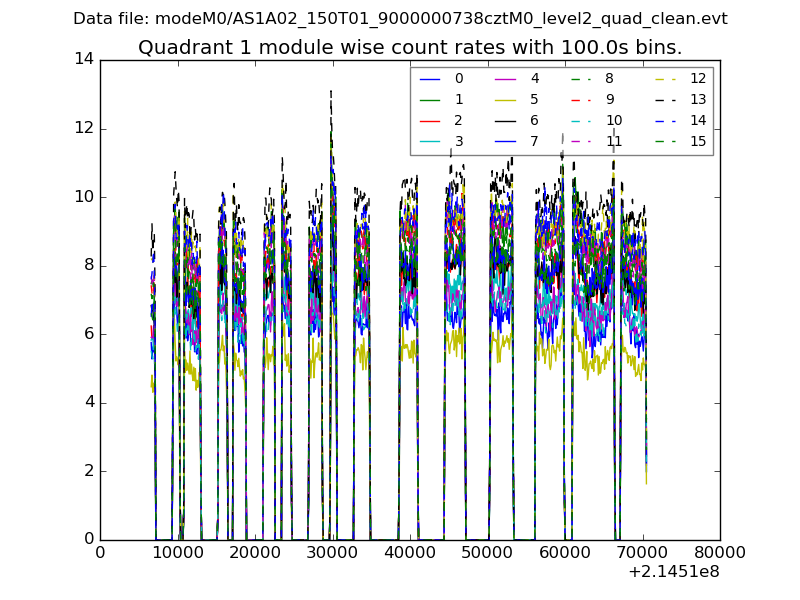 |
 |
| Module-wise count rates for Quadrant C Data is divided into 100 sec bins |
 |
 |
| Module-wise count rates for Quadrant D Data is divided into 100 sec bins |
 |
 |
| Parameter | Plot |
|---|---|
| CZT HV Monitor | 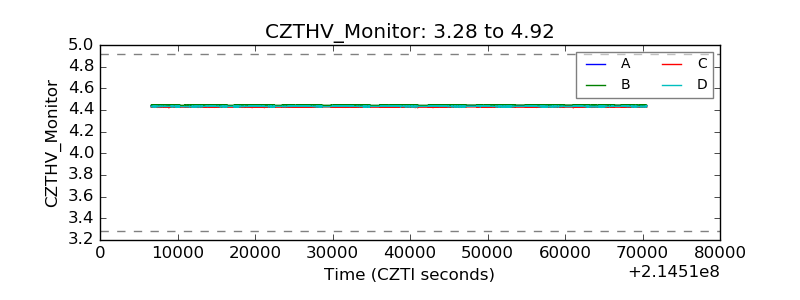 |
| D_VDD | 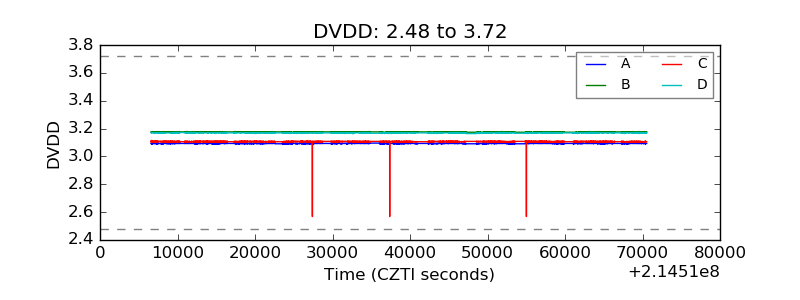 |
| Temperature 1 | 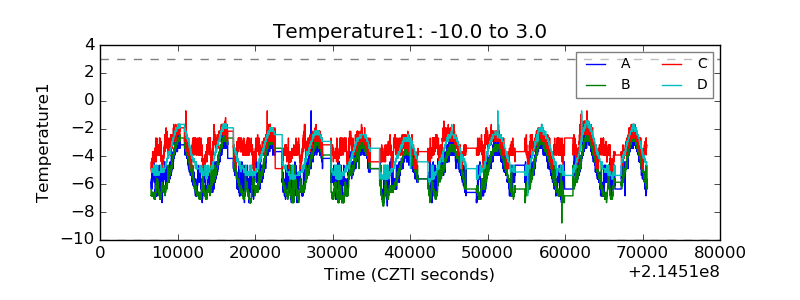 |
| Veto HV Monitor | 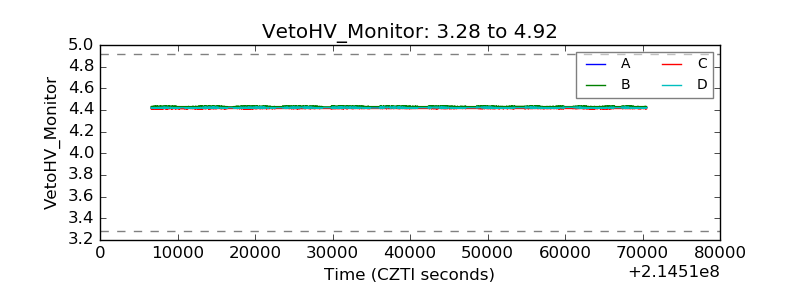 |
| Veto LLD | 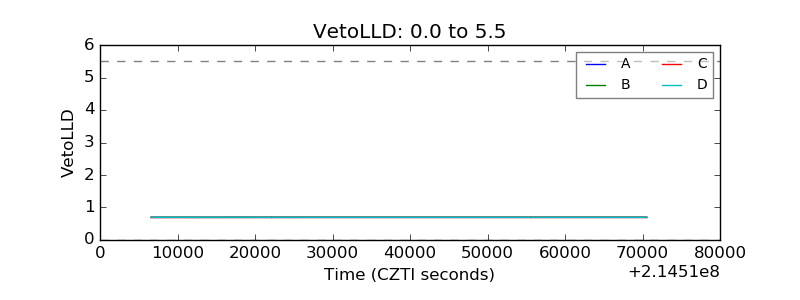 |
| Alpha Counter | 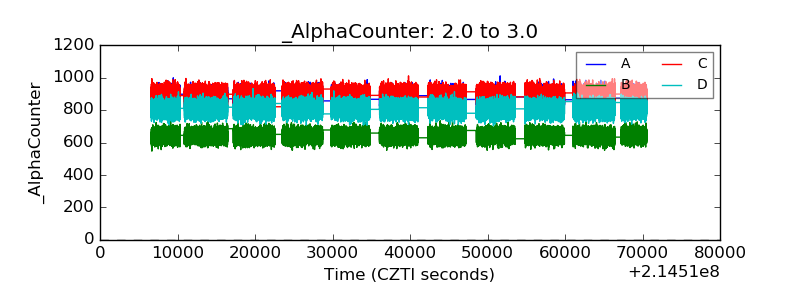 |
| _CPM_Rate | 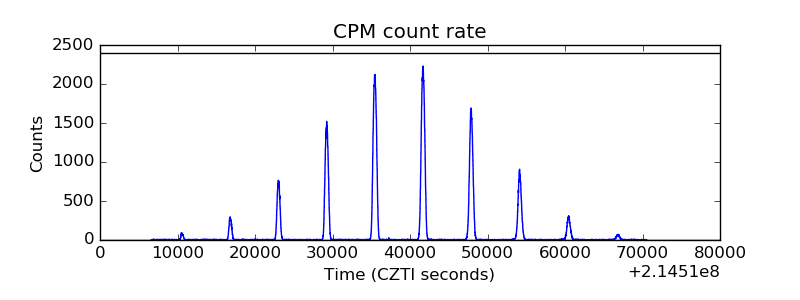 |
| CZT Counter | 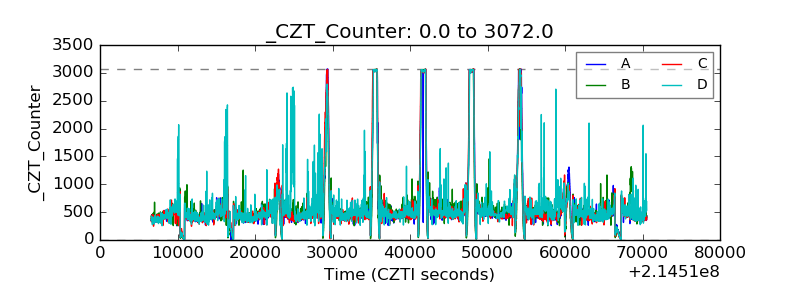 |
| +2.5 Volts monitor | 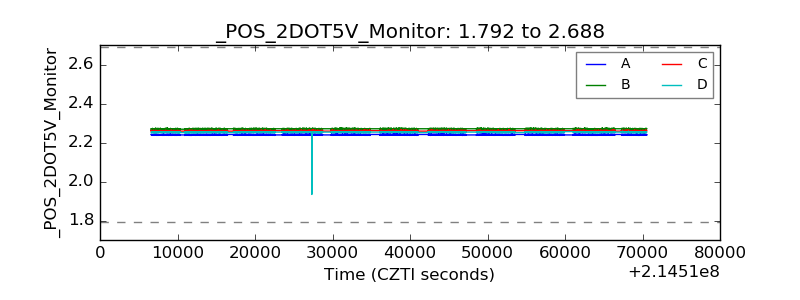 |
| +5 Volts monitor | 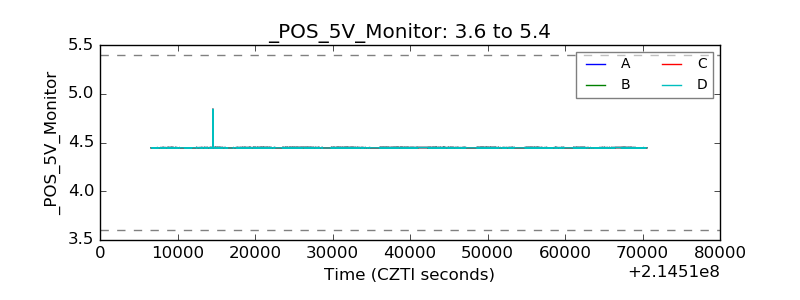 |
| _ROLL_ROT | 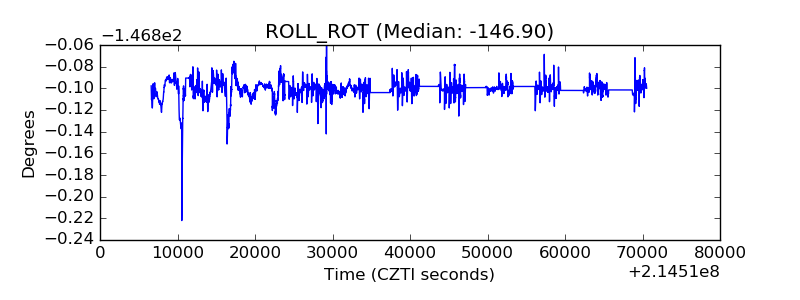 |
| _Roll_DEC |  |
| _Roll_RA | 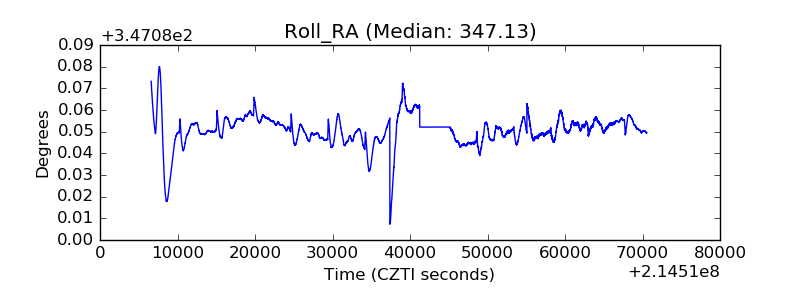 |
| Veto Counter | 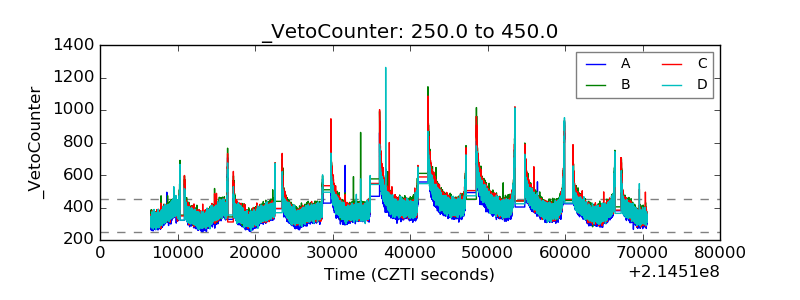 |