| Param | Original file | Final file |
|---|---|---|
| Filename | modeM0/AS1A02_150T01_9000000738_05729cztM0_level2.evt | modeM0/AS1A02_150T01_9000000738_05729cztM0_level2_quad_clean.evt |
| Size (bytes) | 450,696,960 | 65,675,520 |
| Size | 429.8 MB | 62.6 MB |
| Events in quadrant A | 3,088,974 | 382,750 |
| Events in quadrant B | 3,549,570 | 389,536 |
| Events in quadrant C | 3,081,046 | 386,604 |
| Events in quadrant D | 3,481,920 | 369,916 |
| Mode M0 | |||
|---|---|---|---|
| Quadrant | BADHDUFLAG | Total packets | Discarded packets |
| A | 0 | 13481 | 3 |
| B | 0 | 14969 | 2 |
| C | 0 | 13506 | 2 |
| D | 0 | 14482 | 2 |
| Mode M9 | |||
|---|---|---|---|
| Quadrant | BADHDUFLAG | Total packets | Discarded packets |
| A | 0 | 22 | 0 |
| B | 0 | 22 | 0 |
| C | 0 | 22 | 0 |
| D | 0 | 22 | 0 |
| Mode SS | |||
|---|---|---|---|
| Quadrant | BADHDUFLAG | Total packets | Discarded packets |
| A | 0 | 138 | 0 |
| B | 0 | 138 | 0 |
| C | 0 | 138 | 0 |
| D | 0 | 138 | 0 |
| Quadrant | Total seconds | Saturated seconds | Saturation percentage |
|---|---|---|---|
| A | 6584 | 19 | 0.288578% |
| B | 6584 | 47 | 0.713852% |
| C | 6584 | 30 | 0.455650% |
| D | 6584 | 60 | 0.911300% |
Noise dominated data is calculated using 1-second bins in cleaned event files. If a bin has >2000 counts, and if more than 50% of those come from <1% of pixels, then it is considered to be noise-dominated and hence unusable.
| Quadrant | # 1 sec bins | Bins with >0 counts | Bins with >2000 counts | High rate bins dominated by noise | Noise dominated (total time) | Noise dominated (detector-on time) | Marked lightcurve |
|---|---|---|---|---|---|---|---|
| A | 8859 | 6586 | 0 | 0 | 0.00% | 0.00% | 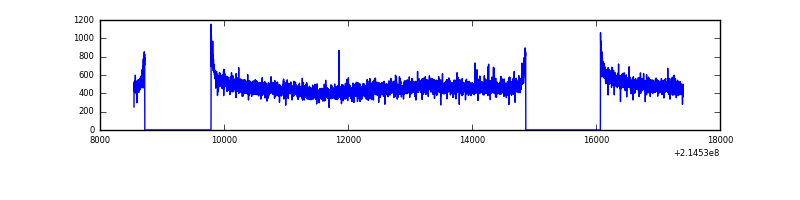 |
| B | 8859 | 6586 | 1 | 1 | 0.01% | 0.02% | 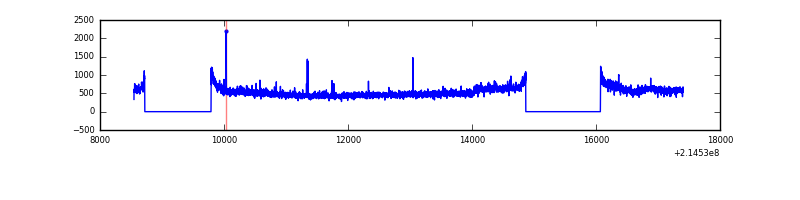 |
| C | 8859 | 6586 | 0 | 0 | 0.00% | 0.00% | 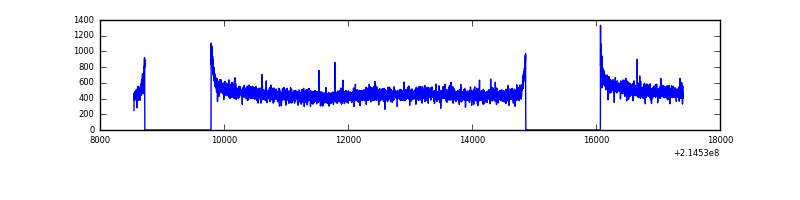 |
| D | 8859 | 6586 | 32 | 32 | 0.36% | 0.49% | 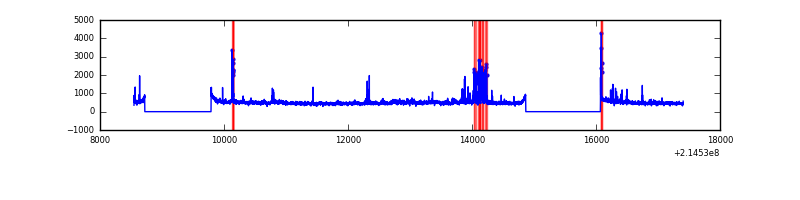 |
Top three noisy pixels from each quadrant. If the there are fewer than three noisy pixels in the level2.evt file, extra rows are filled as -1
| Pixel properties | Quadrant properties | ||||||
|---|---|---|---|---|---|---|---|
| Quadrant | DetID | PixID | Counts | Sigma | Mean | Median | Sigma |
| A | 13 | 14 | 14864 | 87.14 | 798 | 780 | 161.6 |
| A | 12 | 194 | 7848 | 43.73 | 798 | 780 | 161.6 |
| A | 0 | 226 | 7763 | 43.21 | 798 | 780 | 161.6 |
| B | 5 | 172 | 298456 | 1916.75 | 813 | 795 | 155.3 |
| B | 15 | 204 | 42078 | 265.84 | 813 | 795 | 155.3 |
| B | 0 | 229 | 23509 | 146.26 | 813 | 795 | 155.3 |
| C | 13 | 61 | 6358 | 30.55 | 788 | 794 | 182.1 |
| C | 9 | 16 | 3318 | 13.86 | 788 | 794 | 182.1 |
| C | 8 | 222 | 3152 | 12.95 | 788 | 794 | 182.1 |
| D | 2 | 152 | 195904 | 1023.68 | 780 | 757 | 190.6 |
| D | 1 | 20 | 163195 | 852.1 | 780 | 757 | 190.6 |
| D | 2 | 14 | 54458 | 281.7 | 780 | 757 | 190.6 |
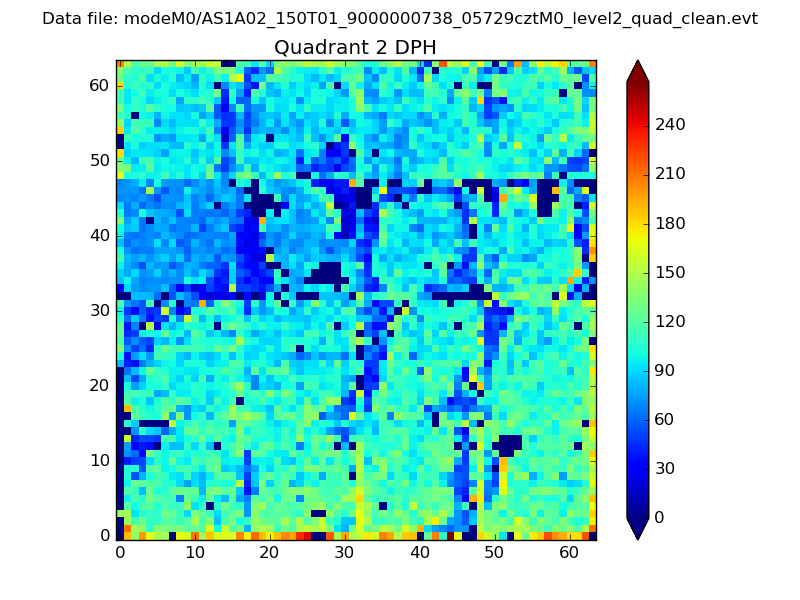
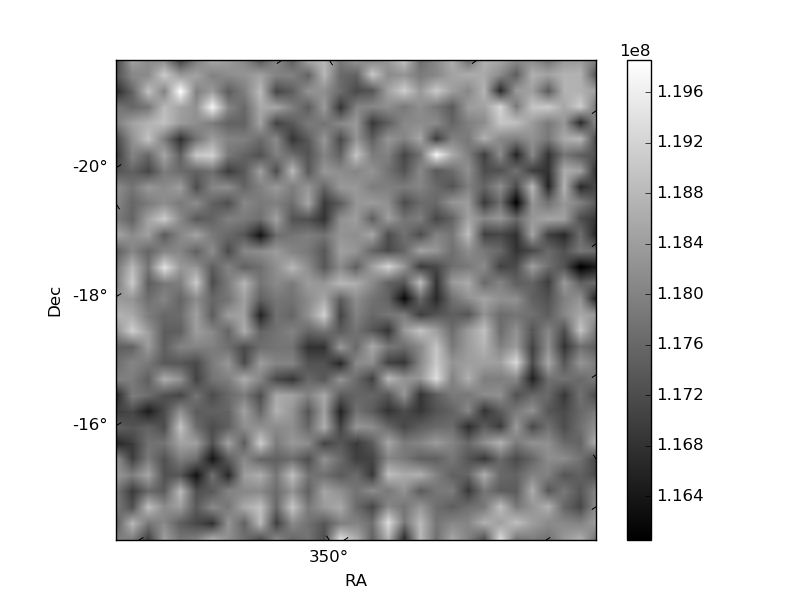
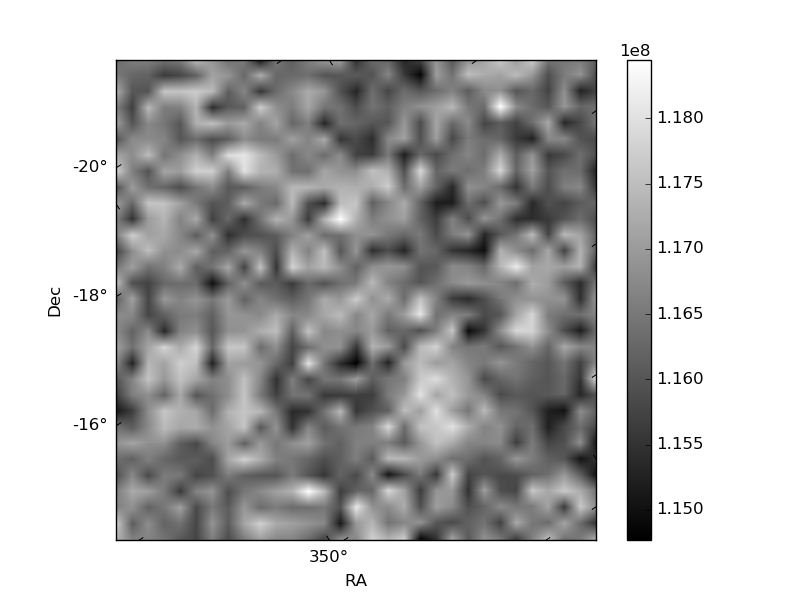
Histogram calculated using DETX and DETY for each event in the final _common_clean file
| Quadrant A | 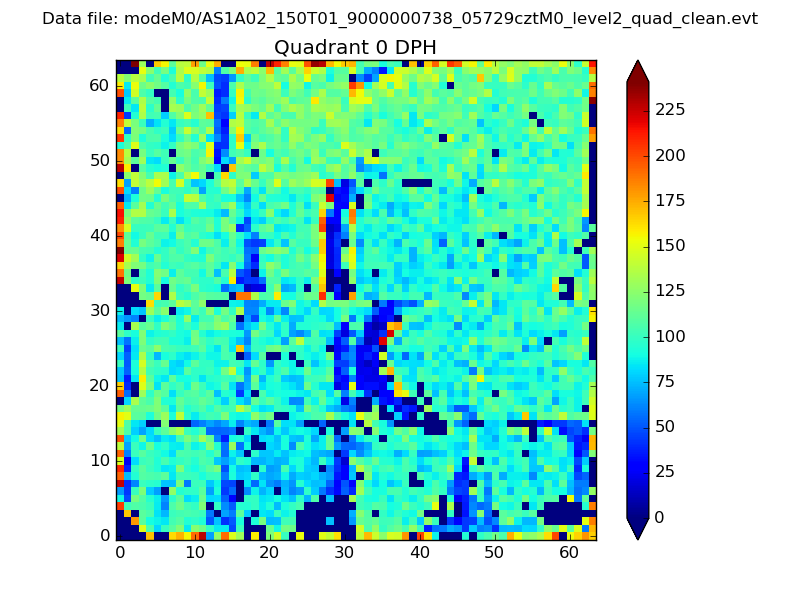 |
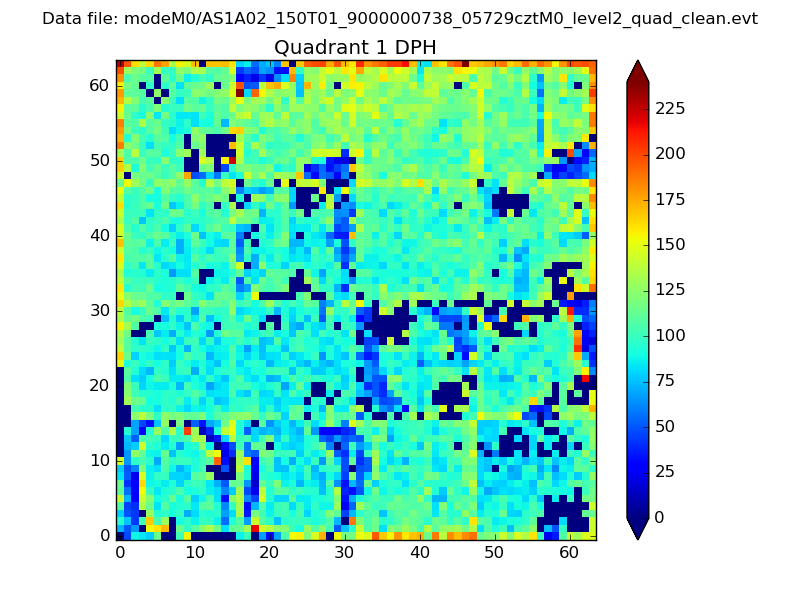 |
Quadrant B |
|---|---|---|---|
| Quadrant D | 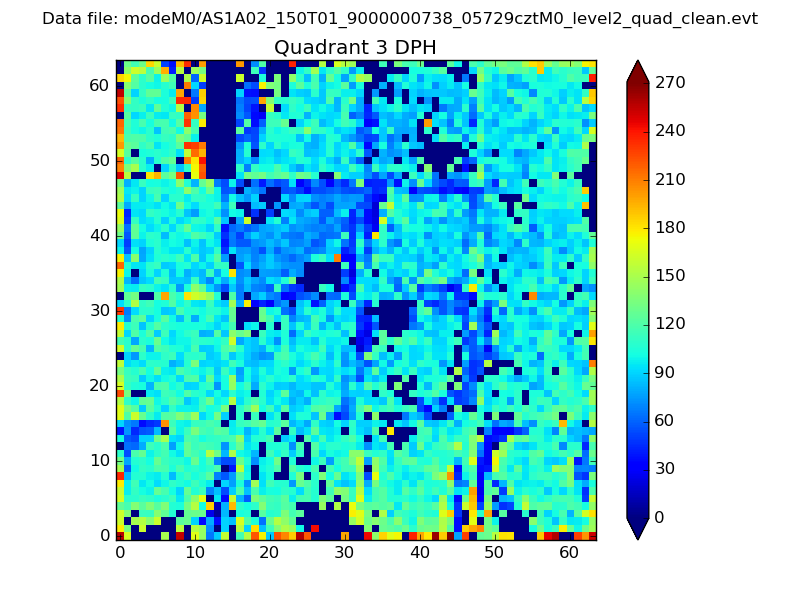 |
 |
Quadrant C |
| Plot type | Count rate plots | Images |
|---|---|---|
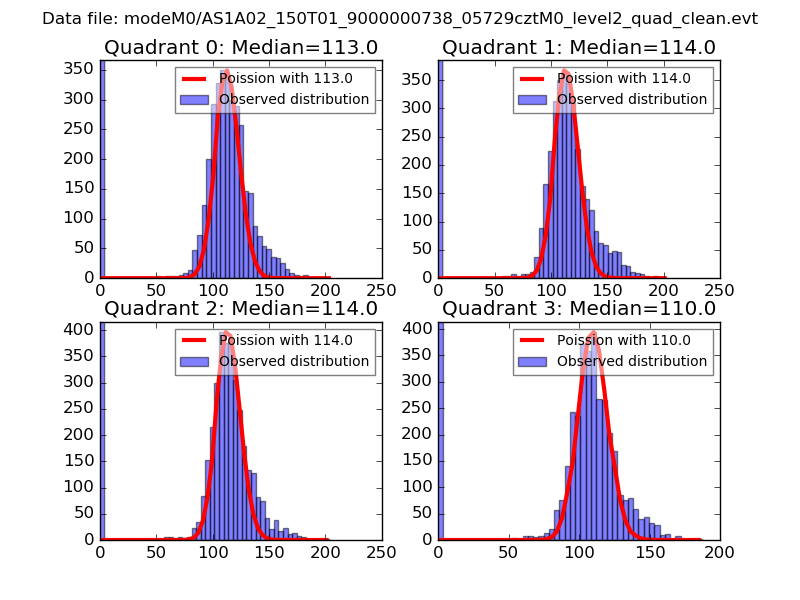
| Comparison with Poisson distribution Blue bars denote a histogram of data divided into 1 sec bins. Red curve is a Poisson curve with rate = median count rate of data. |
 |
 |
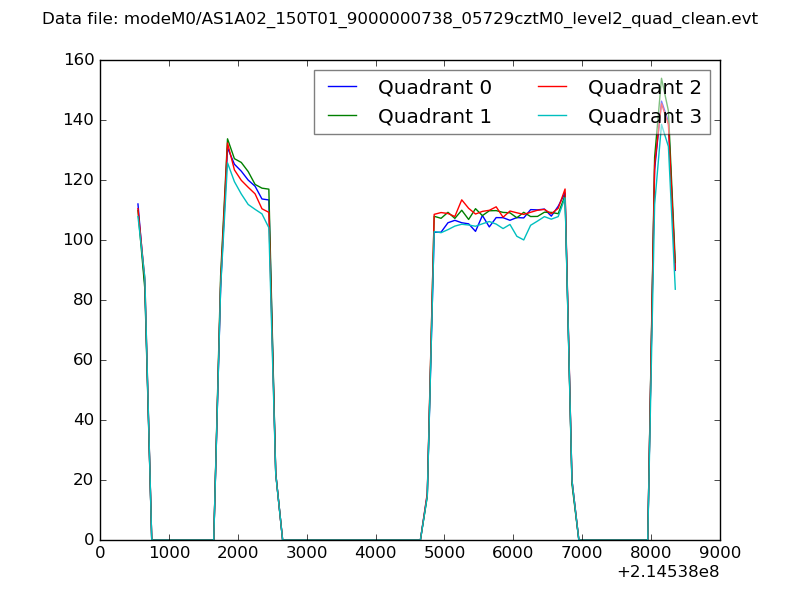
| Quadrant-wise count rates Data is divided into 100 sec bins |
 |
|
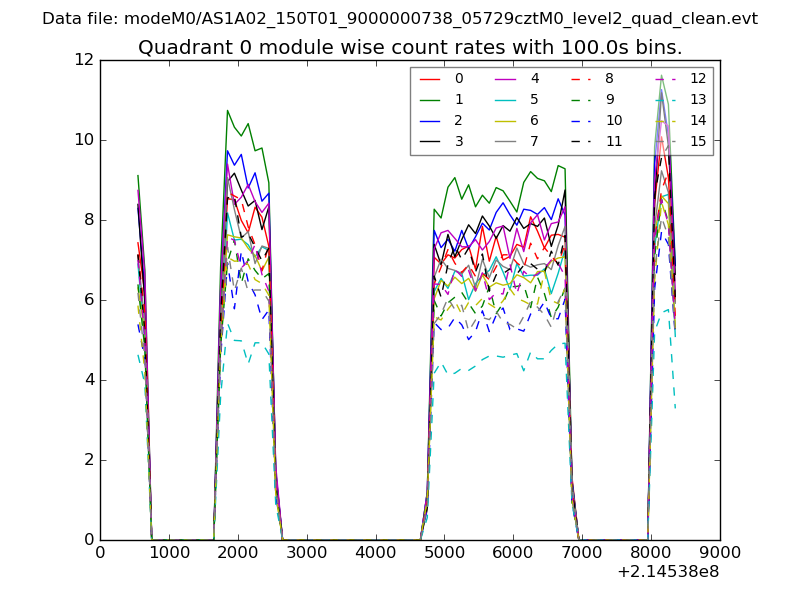
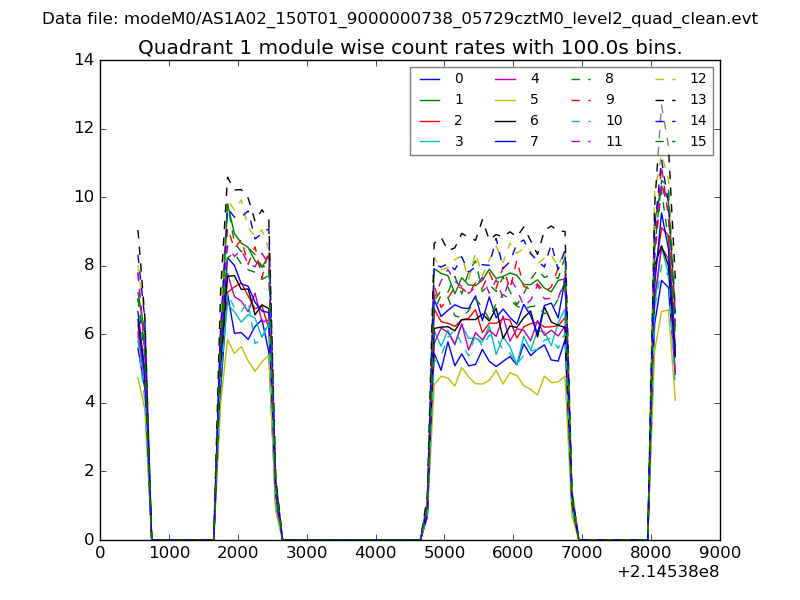
| Module-wise count rates for Quadrant A Data is divided into 100 sec bins |
 |
 |
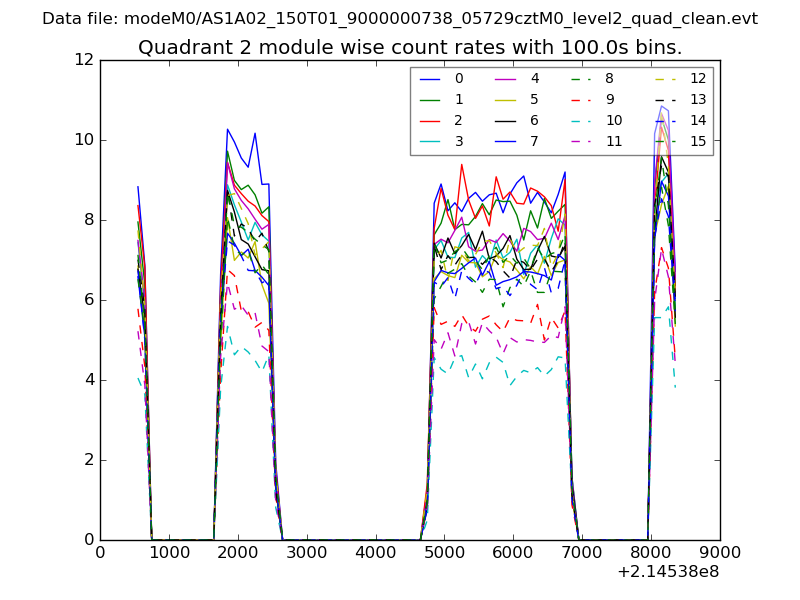
| Module-wise count rates for Quadrant B Data is divided into 100 sec bins |
 |
 |
| Module-wise count rates for Quadrant C Data is divided into 100 sec bins |
 |
 |
| Module-wise count rates for Quadrant D Data is divided into 100 sec bins |
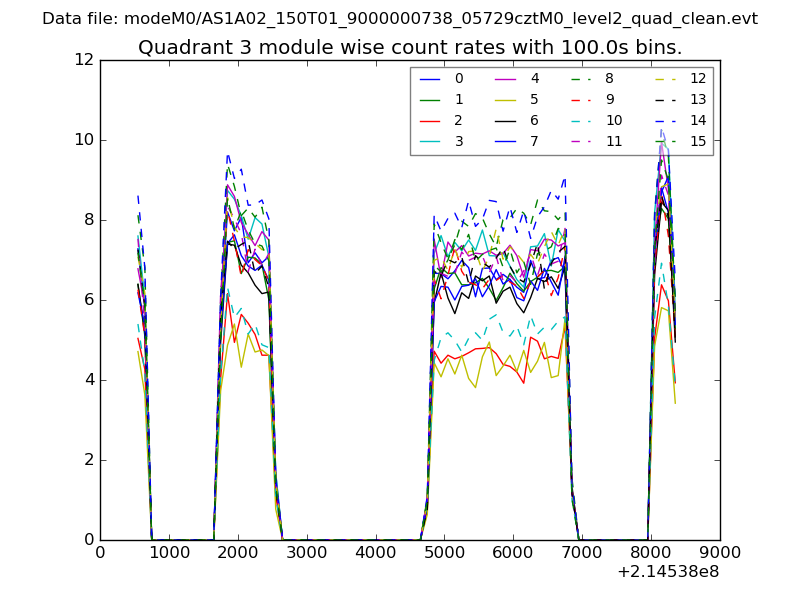 |
 |
| Parameter | Plot |
|---|---|
| CZT HV Monitor | 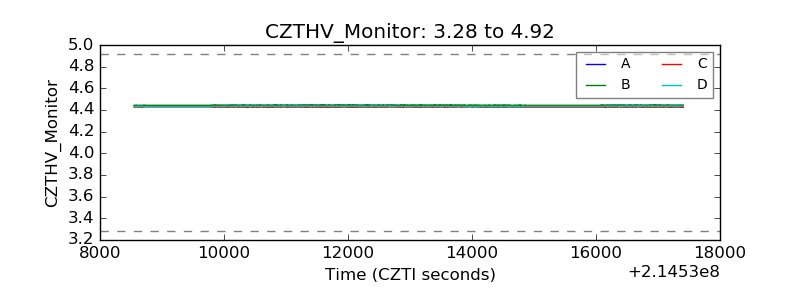 |
| D_VDD | 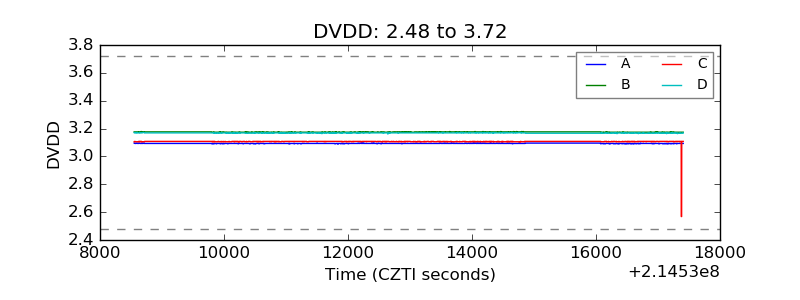 |
| Temperature 1 | 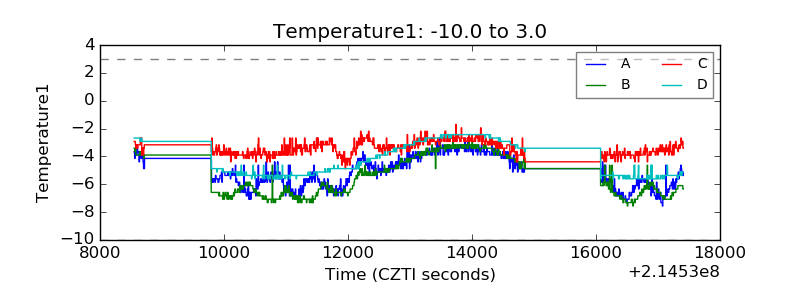 |
| Veto HV Monitor | 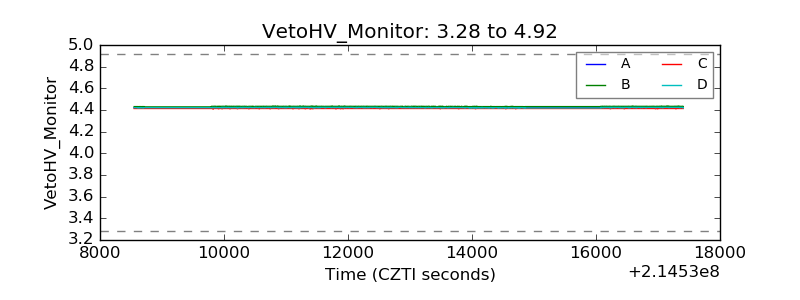 |
| Veto LLD | 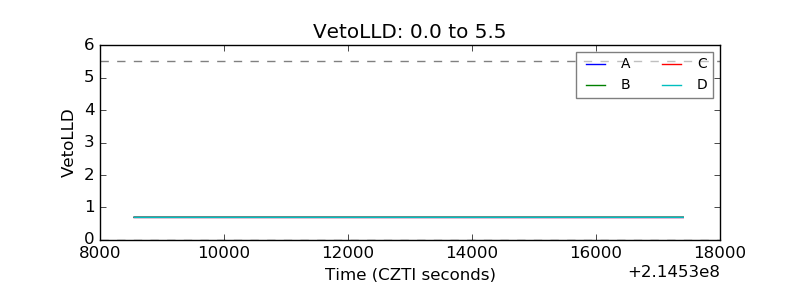 |
| Alpha Counter | 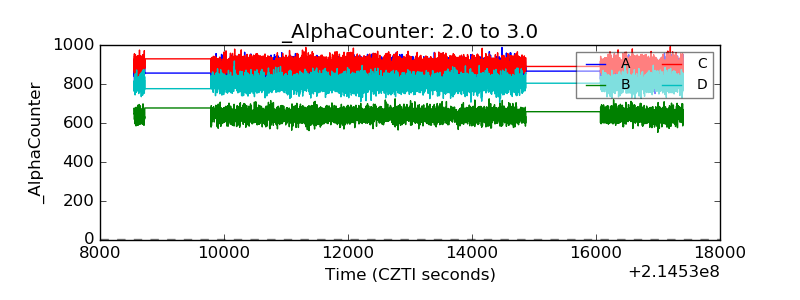 |
| _CPM_Rate | 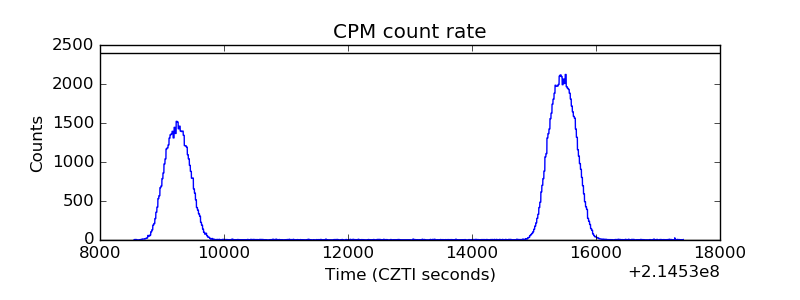 |
| CZT Counter | 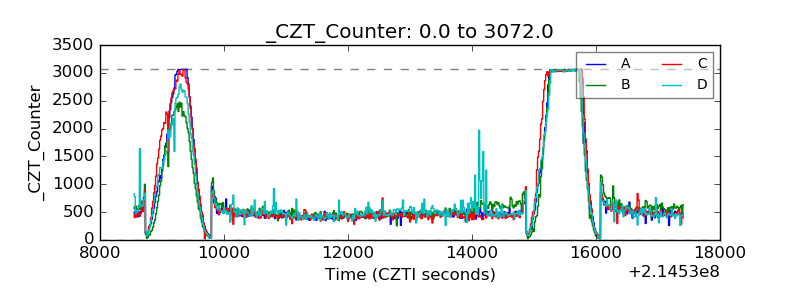 |
| +2.5 Volts monitor |  |
| +5 Volts monitor |  |
| _ROLL_ROT | 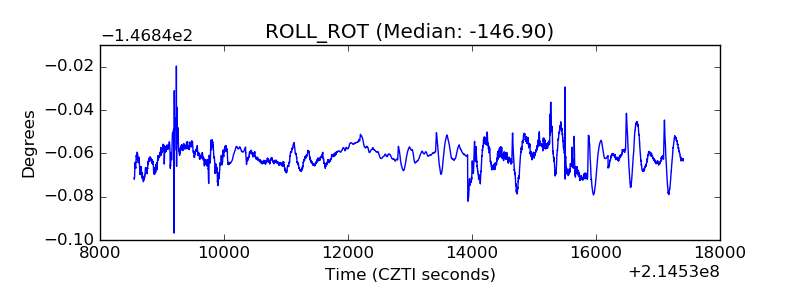 |
| _Roll_DEC | 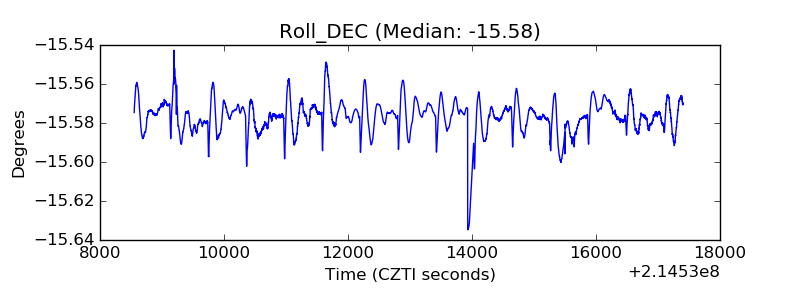 |
| _Roll_RA | 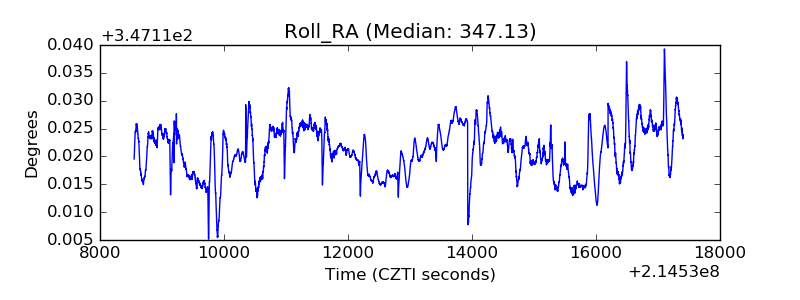 |
| Veto Counter | 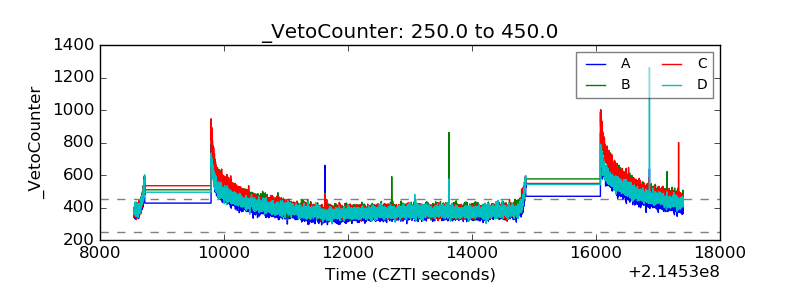 |