| Param | Original file | Final file |
|---|---|---|
| Filename | modeM0/AS1A02_150T01_9000000738_05730cztM0_level2.evt | modeM0/AS1A02_150T01_9000000738_05730cztM0_level2_quad_clean.evt |
| Size (bytes) | 440,959,680 | 56,050,560 |
| Size | 420.5 MB | 53.5 MB |
| Events in quadrant A | 3,067,830 | 312,904 |
| Events in quadrant B | 3,667,623 | 318,607 |
| Events in quadrant C | 3,065,570 | 320,262 |
| Events in quadrant D | 3,126,896 | 306,886 |
| Mode M0 | |||
|---|---|---|---|
| Quadrant | BADHDUFLAG | Total packets | Discarded packets |
| A | 0 | 12998 | 3 |
| B | 0 | 15270 | 2 |
| C | 0 | 13044 | 2 |
| D | 0 | 13274 | 2 |
| Mode M9 | |||
|---|---|---|---|
| Quadrant | BADHDUFLAG | Total packets | Discarded packets |
| A | 0 | 25 | 0 |
| B | 0 | 25 | 0 |
| C | 0 | 25 | 0 |
| D | 0 | 25 | 0 |
| Mode SS | |||
|---|---|---|---|
| Quadrant | BADHDUFLAG | Total packets | Discarded packets |
| A | 0 | 130 | 0 |
| B | 0 | 130 | 0 |
| C | 0 | 130 | 0 |
| D | 0 | 130 | 0 |
| Quadrant | Total seconds | Saturated seconds | Saturation percentage |
|---|---|---|---|
| A | 6275 | 20 | 0.318725% |
| B | 6275 | 50 | 0.796813% |
| C | 6275 | 35 | 0.557769% |
| D | 6275 | 36 | 0.573705% |
Noise dominated data is calculated using 1-second bins in cleaned event files. If a bin has >2000 counts, and if more than 50% of those come from <1% of pixels, then it is considered to be noise-dominated and hence unusable.
| Quadrant | # 1 sec bins | Bins with >0 counts | Bins with >2000 counts | High rate bins dominated by noise | Noise dominated (total time) | Noise dominated (detector-on time) | Marked lightcurve |
|---|---|---|---|---|---|---|---|
| A | 8765 | 6277 | 0 | 0 | 0.00% | 0.00% | 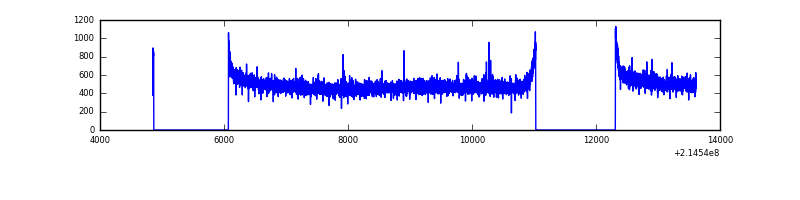 |
| B | 8765 | 6277 | 0 | 0 | 0.00% | 0.00% | 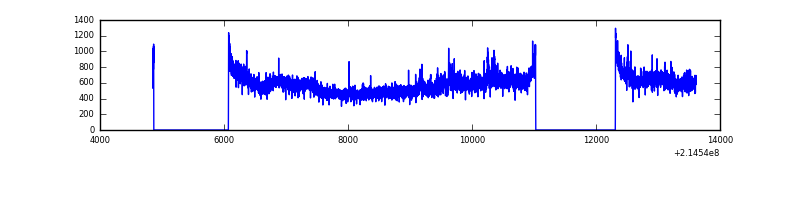 |
| C | 8765 | 6277 | 0 | 0 | 0.00% | 0.00% | 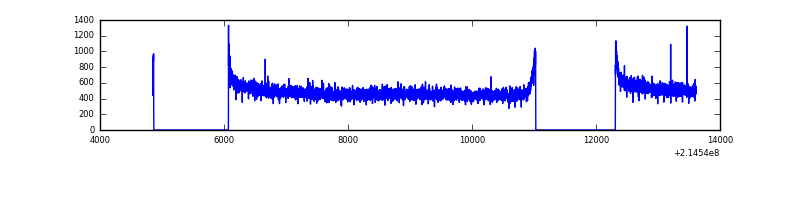 |
| D | 8765 | 6277 | 6 | 6 | 0.07% | 0.10% | 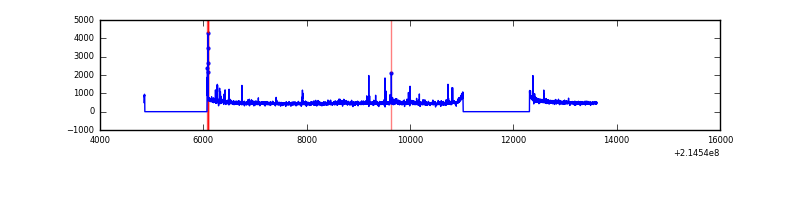 |
Top three noisy pixels from each quadrant. If the there are fewer than three noisy pixels in the level2.evt file, extra rows are filled as -1
| Pixel properties | Quadrant properties | ||||||
|---|---|---|---|---|---|---|---|
| Quadrant | DetID | PixID | Counts | Sigma | Mean | Median | Sigma |
| A | 13 | 14 | 12358 | 72.49 | 793 | 778 | 159.7 |
| A | 12 | 194 | 7573 | 42.54 | 793 | 778 | 159.7 |
| A | 0 | 226 | 7350 | 41.14 | 793 | 778 | 159.7 |
| B | 5 | 172 | 361205 | 2364.1 | 809 | 792 | 152.5 |
| B | 15 | 204 | 148111 | 966.33 | 809 | 792 | 152.5 |
| B | 12 | 111 | 14575 | 90.41 | 809 | 792 | 152.5 |
| C | 13 | 61 | 6168 | 29.87 | 783 | 790 | 180.1 |
| C | 8 | 222 | 4098 | 18.37 | 783 | 790 | 180.1 |
| C | 1 | 16 | 3488 | 14.98 | 783 | 790 | 180.1 |
| D | 11 | 241 | 67027 | 356.61 | 775 | 755 | 185.8 |
| D | 2 | 14 | 32683 | 171.8 | 775 | 755 | 185.8 |
| D | 2 | 206 | 28866 | 151.26 | 775 | 755 | 185.8 |
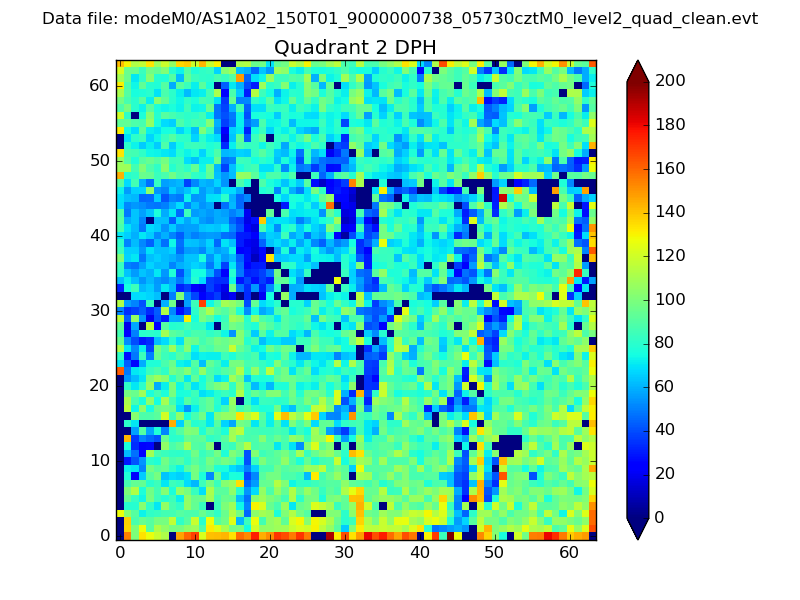
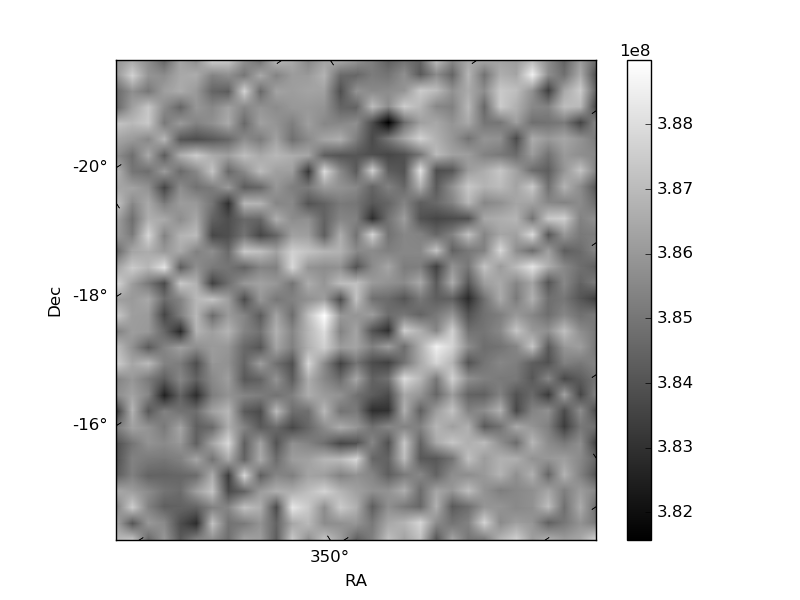
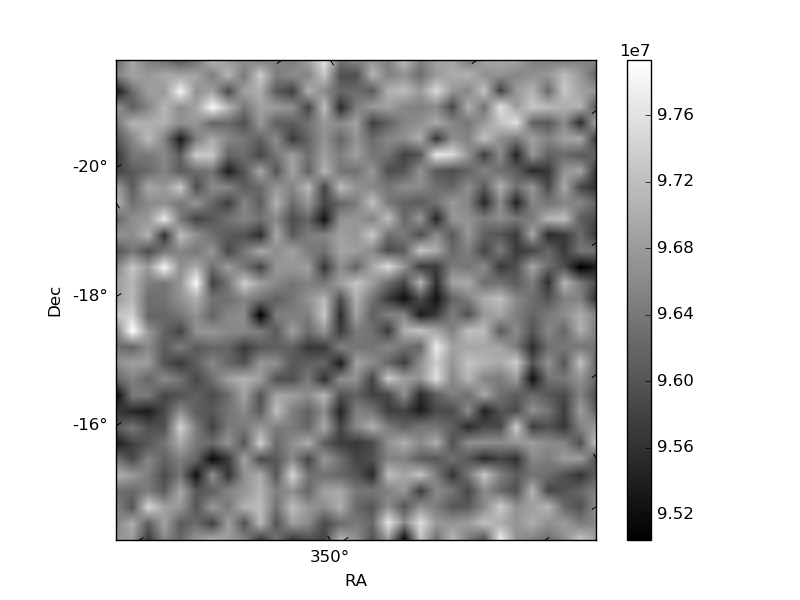
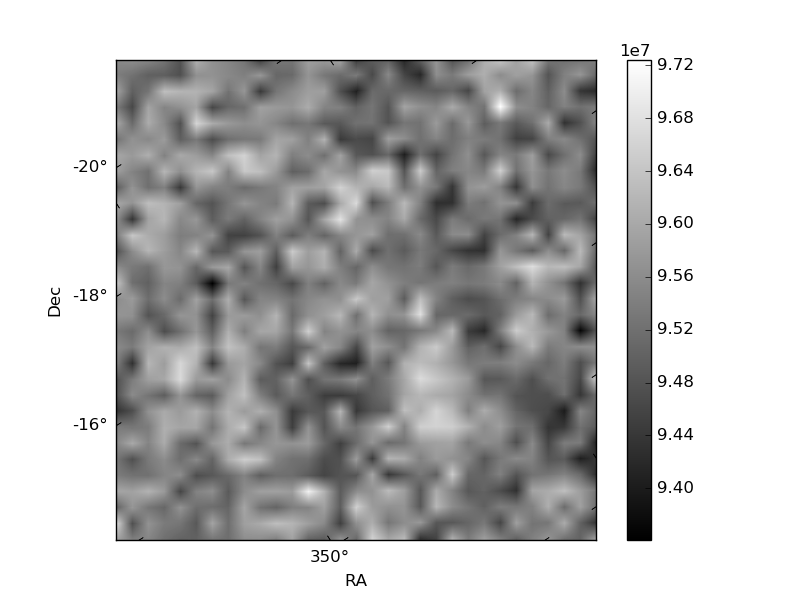
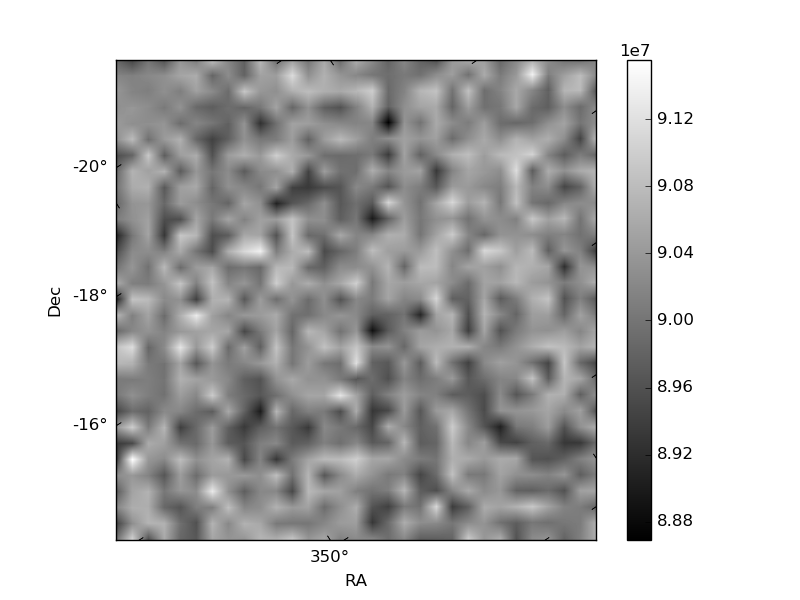
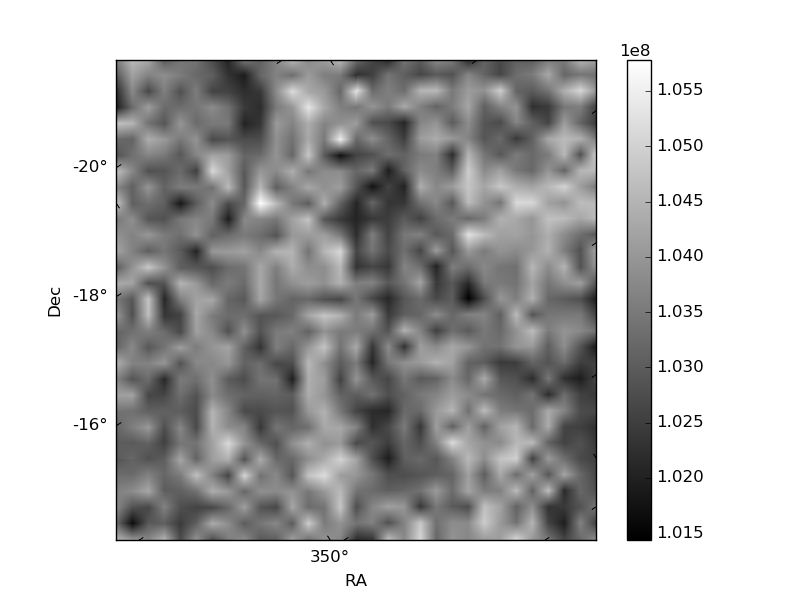
Histogram calculated using DETX and DETY for each event in the final _common_clean file
| Quadrant A | 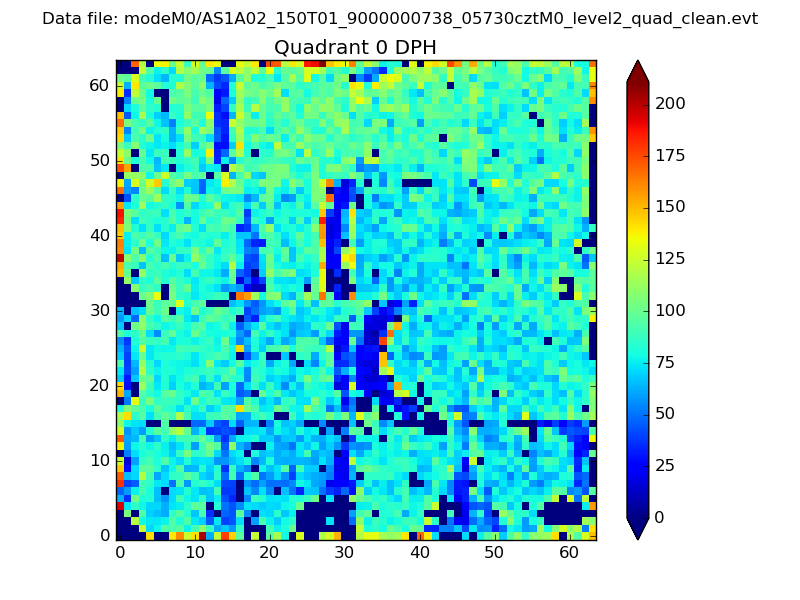 |
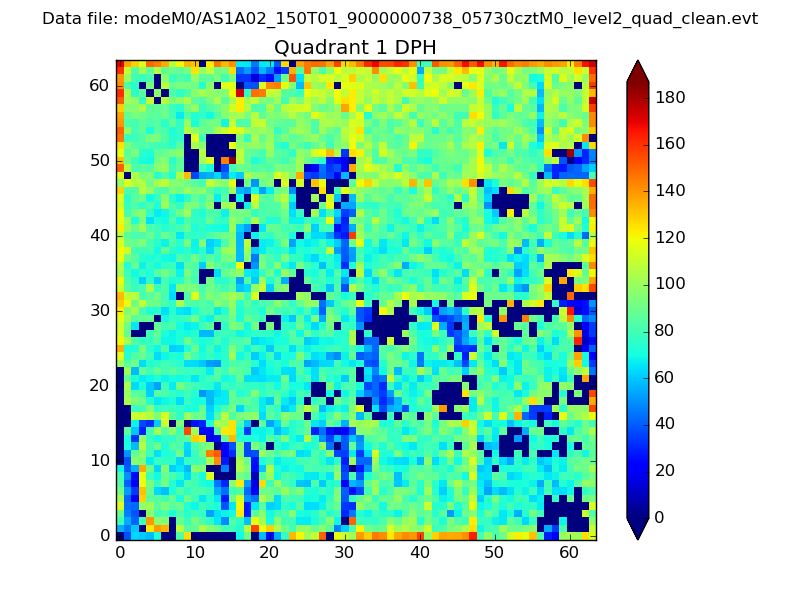 |
Quadrant B |
|---|---|---|---|
| Quadrant D | 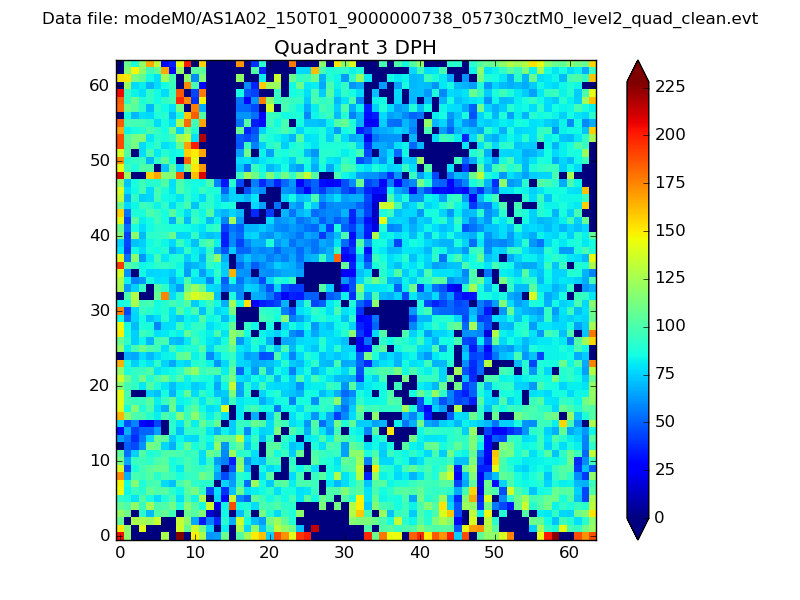 |
 |
Quadrant C |
| Plot type | Count rate plots | Images |
|---|---|---|
| Comparison with Poisson distribution Blue bars denote a histogram of data divided into 1 sec bins. Red curve is a Poisson curve with rate = median count rate of data. |
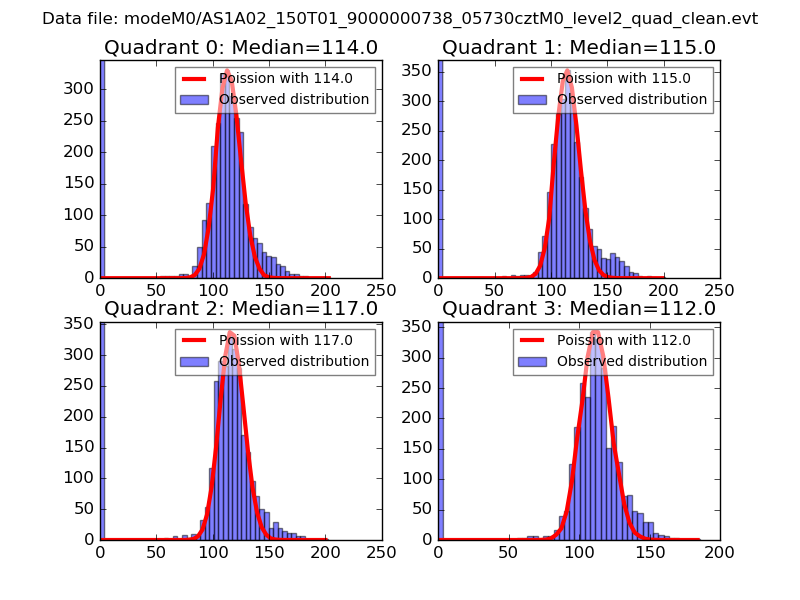 |
 |
| Quadrant-wise count rates Data is divided into 100 sec bins |
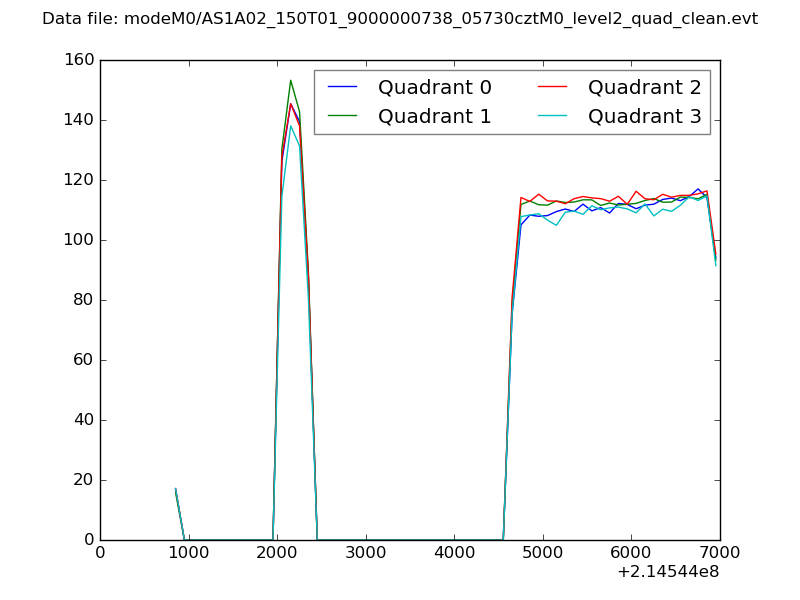 |
|
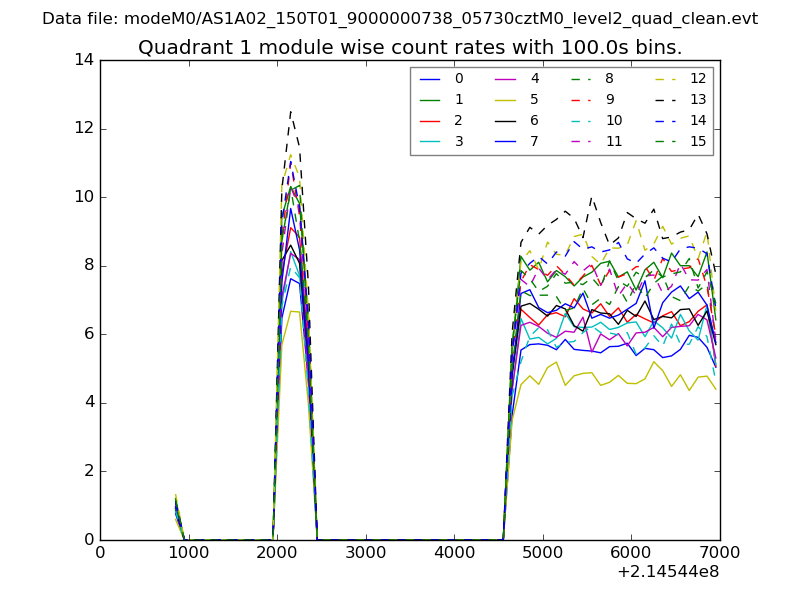
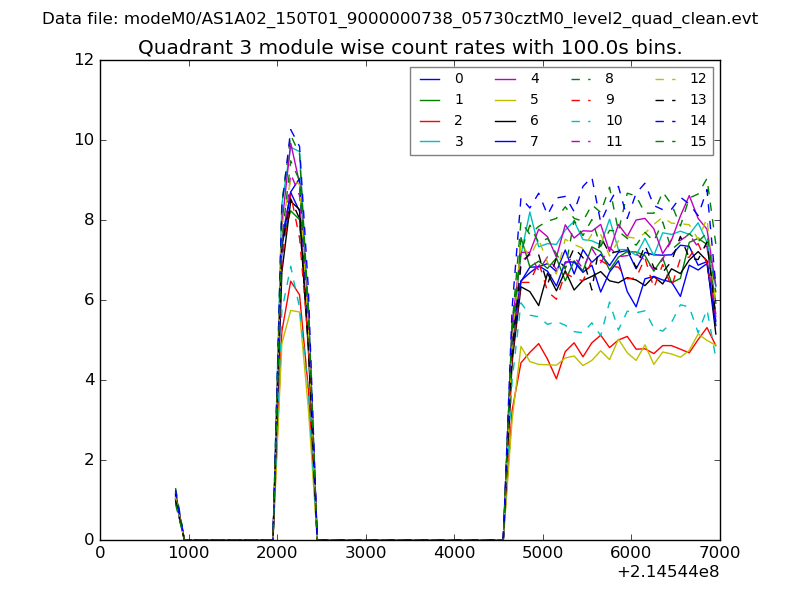
| Module-wise count rates for Quadrant A Data is divided into 100 sec bins |
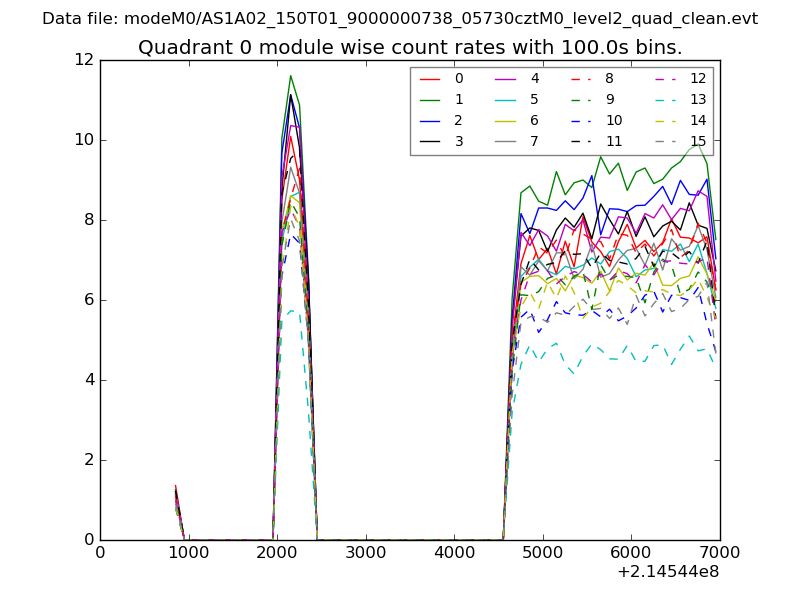 |
 |
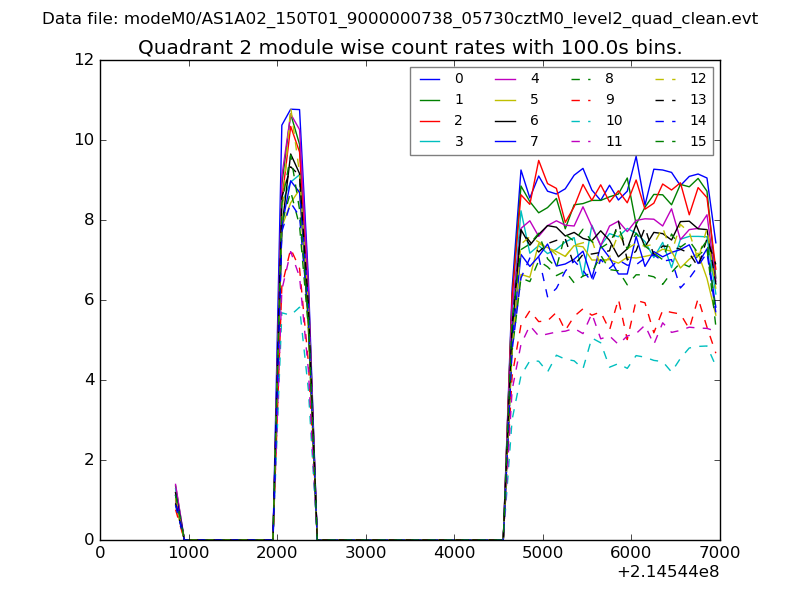
| Module-wise count rates for Quadrant B Data is divided into 100 sec bins |
 |
 |
| Module-wise count rates for Quadrant C Data is divided into 100 sec bins |
 |
 |
| Module-wise count rates for Quadrant D Data is divided into 100 sec bins |
 |
 |
| Parameter | Plot |
|---|---|
| CZT HV Monitor | 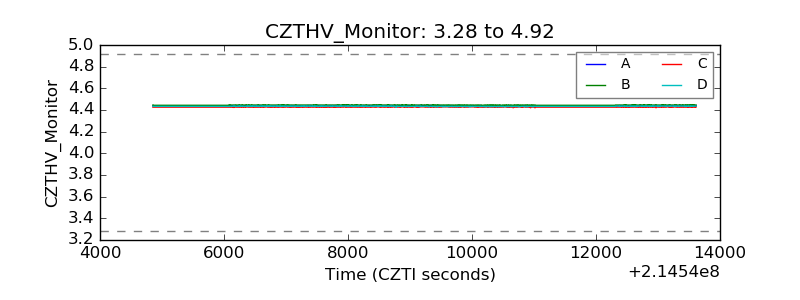 |
| D_VDD | 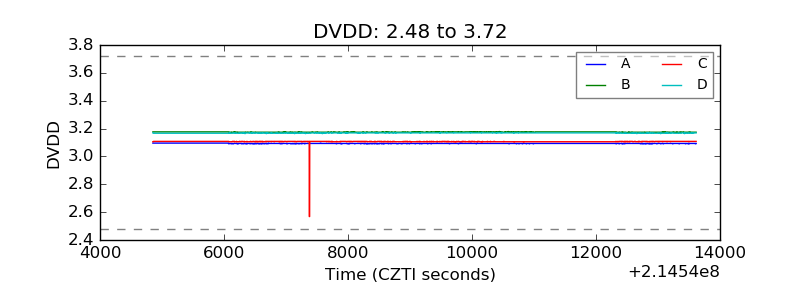 |
| Temperature 1 | 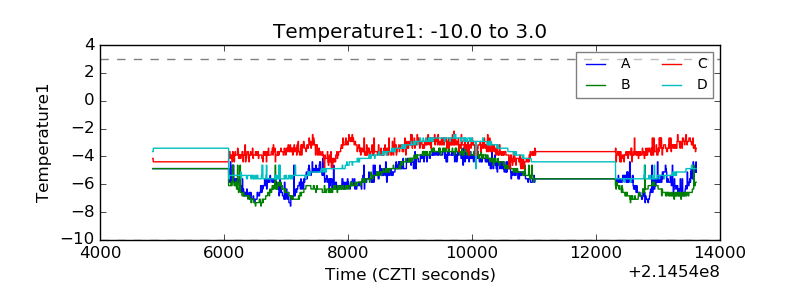 |
| Veto HV Monitor | 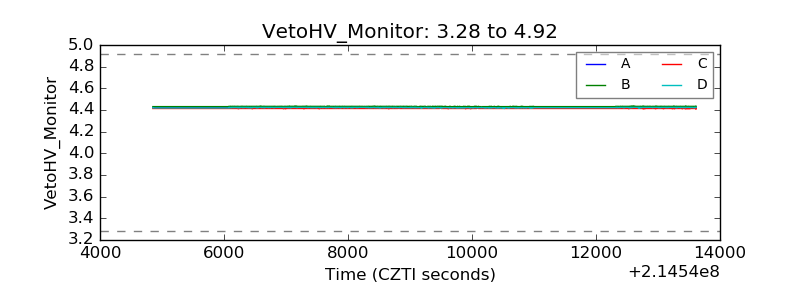 |
| Veto LLD | 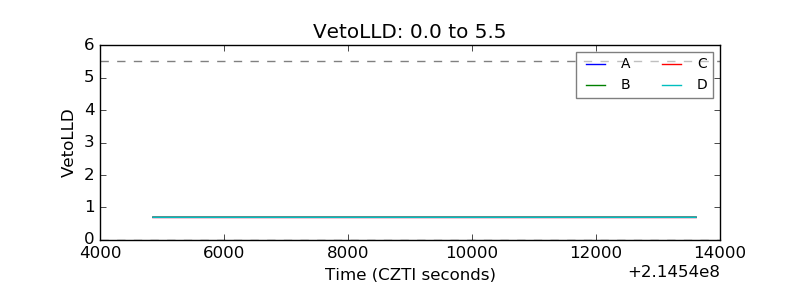 |
| Alpha Counter | 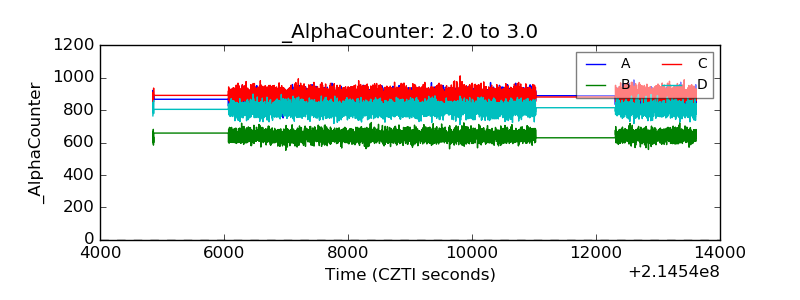 |
| _CPM_Rate | 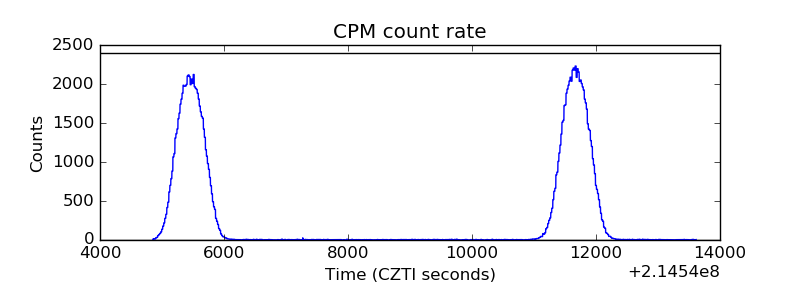 |
| CZT Counter | 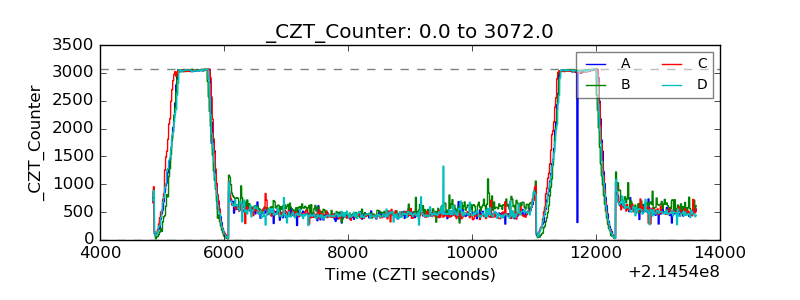 |
| +2.5 Volts monitor |  |
| +5 Volts monitor |  |
| _ROLL_ROT | 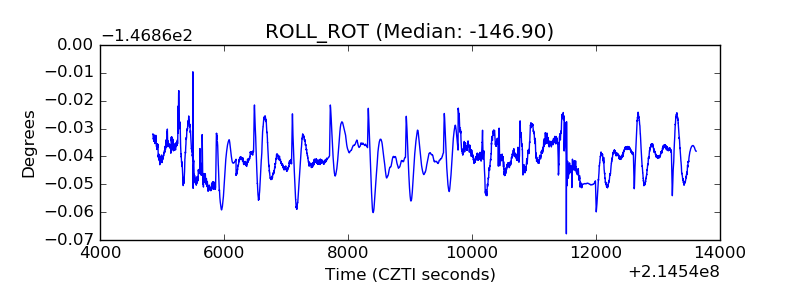 |
| _Roll_DEC | 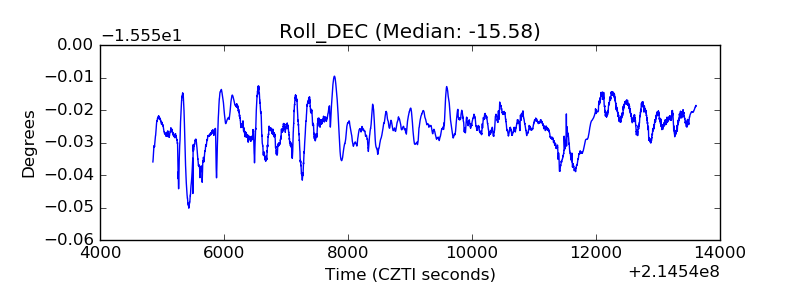 |
| _Roll_RA | 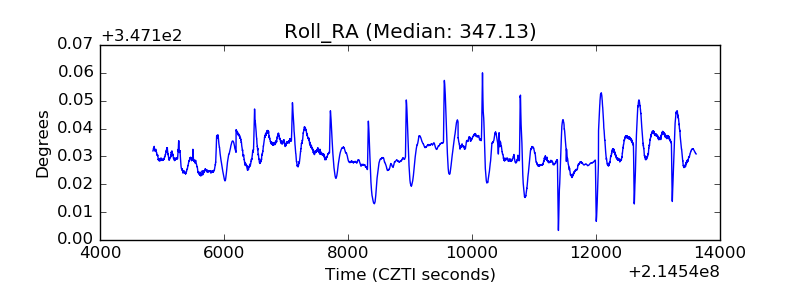 |
| Veto Counter | 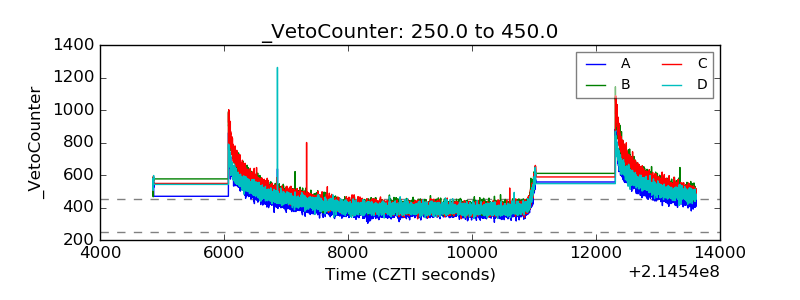 |