| Param | Original file | Final file |
|---|---|---|
| Filename | modeM0/AS1A02_150T01_9000000738_05732cztM0_level2.evt | modeM0/AS1A02_150T01_9000000738_05732cztM0_level2_quad_clean.evt |
| Size (bytes) | 458,507,520 | 64,013,760 |
| Size | 437.3 MB | 61.0 MB |
| Events in quadrant A | 3,218,671 | 373,286 |
| Events in quadrant B | 3,646,045 | 378,699 |
| Events in quadrant C | 3,200,781 | 378,434 |
| Events in quadrant D | 3,388,488 | 364,187 |
| Mode M0 | |||
|---|---|---|---|
| Quadrant | BADHDUFLAG | Total packets | Discarded packets |
| A | 0 | 13375 | 7 |
| B | 0 | 14491 | 2 |
| C | 0 | 13445 | 7 |
| D | 0 | 13901 | 5 |
| Mode M9 | |||
|---|---|---|---|
| Quadrant | BADHDUFLAG | Total packets | Discarded packets |
| A | 0 | 26 | 0 |
| B | 0 | 26 | 0 |
| C | 0 | 26 | 0 |
| D | 0 | 26 | 0 |
| Mode SS | |||
|---|---|---|---|
| Quadrant | BADHDUFLAG | Total packets | Discarded packets |
| A | 0 | 132 | 0 |
| B | 0 | 132 | 0 |
| C | 0 | 132 | 0 |
| D | 0 | 132 | 0 |
| Quadrant | Total seconds | Saturated seconds | Saturation percentage |
|---|---|---|---|
| A | 6350 | 142 | 2.236220% |
| B | 6352 | 151 | 2.377204% |
| C | 6350 | 142 | 2.236220% |
| D | 6351 | 151 | 2.377578% |
Noise dominated data is calculated using 1-second bins in cleaned event files. If a bin has >2000 counts, and if more than 50% of those come from <1% of pixels, then it is considered to be noise-dominated and hence unusable.
| Quadrant | # 1 sec bins | Bins with >0 counts | Bins with >2000 counts | High rate bins dominated by noise | Noise dominated (total time) | Noise dominated (detector-on time) | Marked lightcurve |
|---|---|---|---|---|---|---|---|
| A | 8947 | 6353 | 0 | 0 | 0.00% | 0.00% | 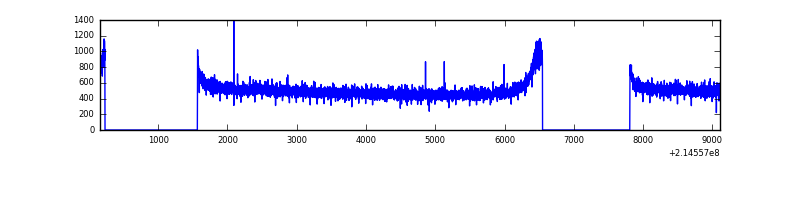 |
| B | 8947 | 6353 | 0 | 0 | 0.00% | 0.00% | 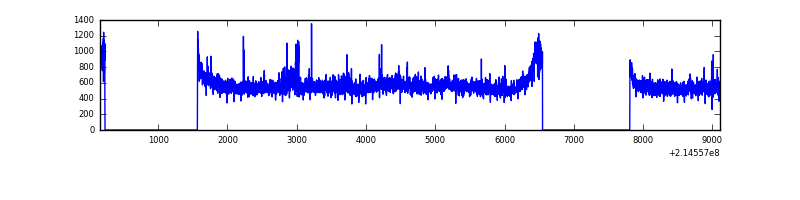 |
| C | 8947 | 6353 | 0 | 0 | 0.00% | 0.00% | 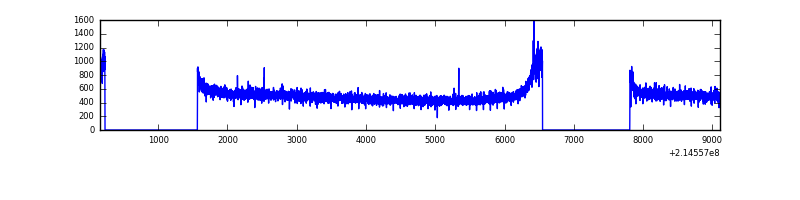 |
| D | 8947 | 6353 | 7 | 7 | 0.08% | 0.11% | 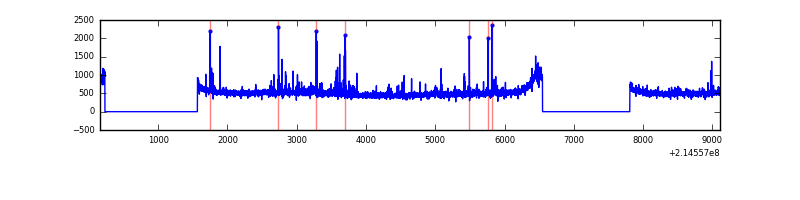 |
Top three noisy pixels from each quadrant. If the there are fewer than three noisy pixels in the level2.evt file, extra rows are filled as -1
| Pixel properties | Quadrant properties | ||||||
|---|---|---|---|---|---|---|---|
| Quadrant | DetID | PixID | Counts | Sigma | Mean | Median | Sigma |
| A | 0 | 226 | 8026 | 42.9 | 834 | 816 | 168.1 |
| A | 12 | 194 | 7984 | 42.65 | 834 | 816 | 168.1 |
| A | 15 | 174 | 4381 | 21.21 | 834 | 816 | 168.1 |
| B | 5 | 172 | 293609 | 1828.19 | 844 | 827 | 160.1 |
| B | 15 | 204 | 34854 | 212.47 | 844 | 827 | 160.1 |
| B | 11 | 51 | 28216 | 171.02 | 844 | 827 | 160.1 |
| C | 13 | 61 | 6602 | 30.63 | 816 | 822 | 188.7 |
| C | 9 | 16 | 6230 | 28.66 | 816 | 822 | 188.7 |
| C | 8 | 222 | 4675 | 20.42 | 816 | 822 | 188.7 |
| D | 1 | 20 | 160590 | 798.41 | 816 | 794 | 200.1 |
| D | 2 | 152 | 58555 | 288.6 | 816 | 794 | 200.1 |
| D | 2 | 136 | 46674 | 229.24 | 816 | 794 | 200.1 |
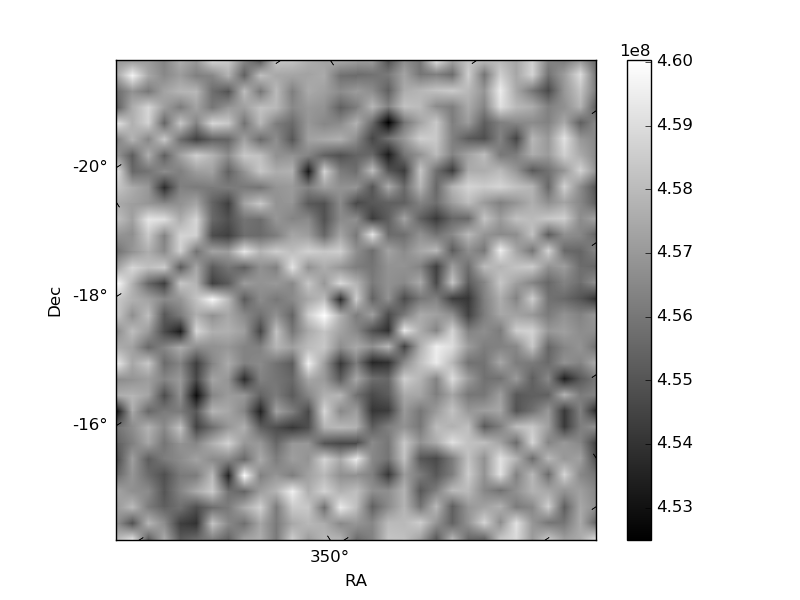
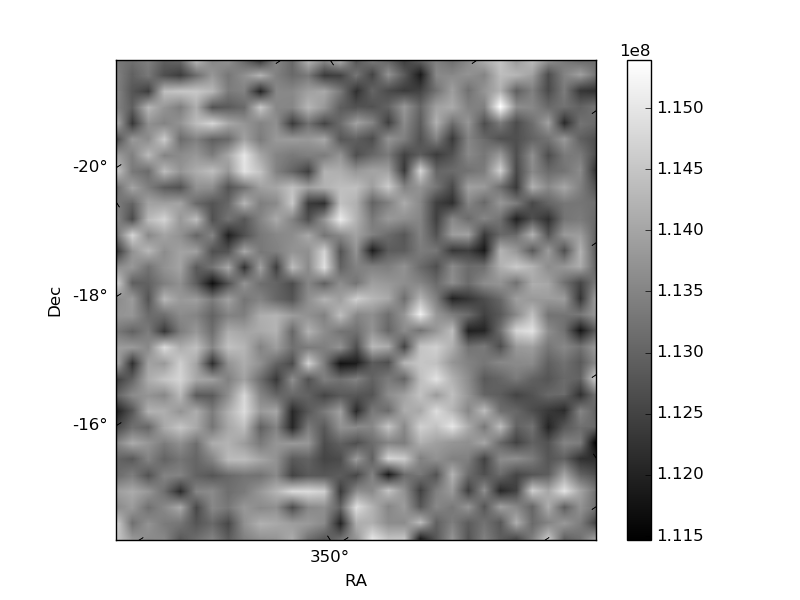
Histogram calculated using DETX and DETY for each event in the final _common_clean file
| Quadrant A | 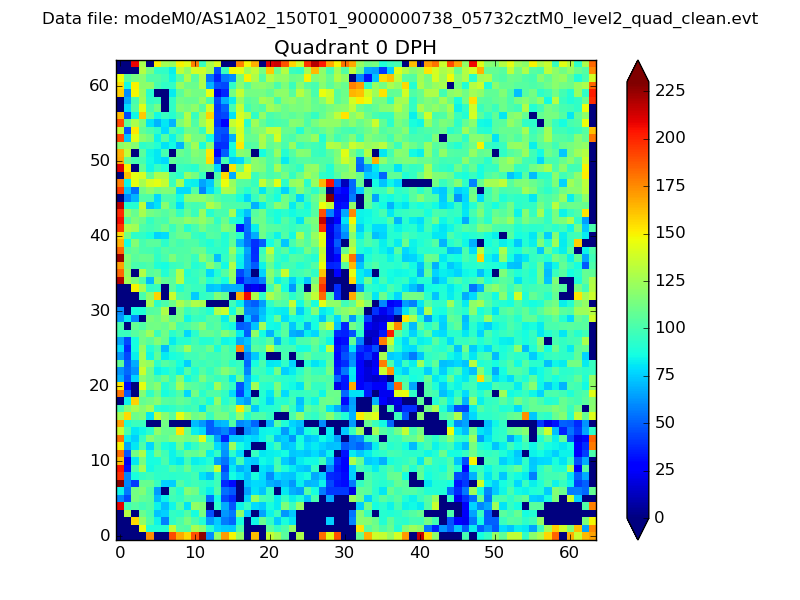 |
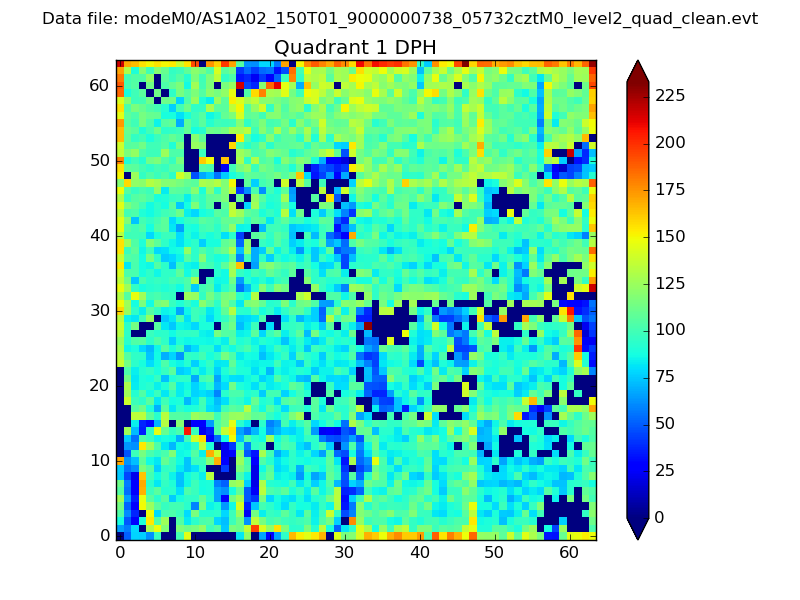 |
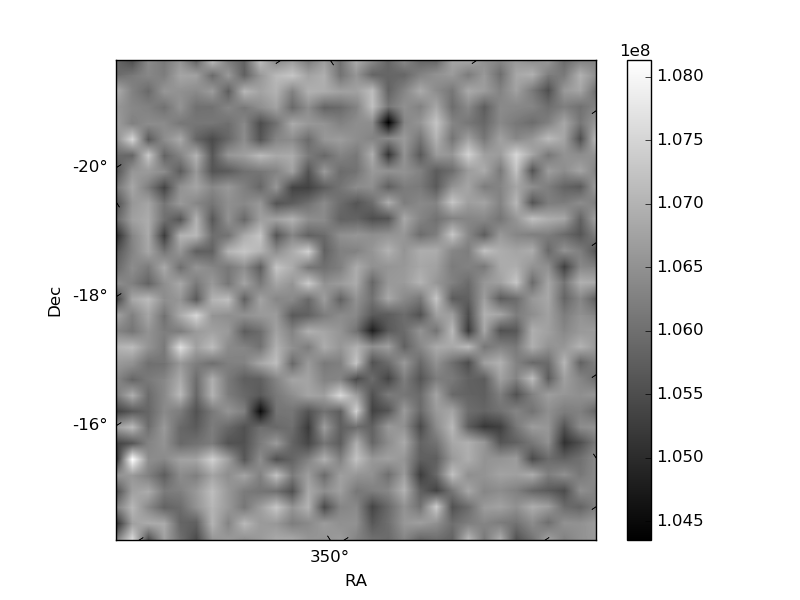
Quadrant B |
|---|---|---|---|
| Quadrant D | 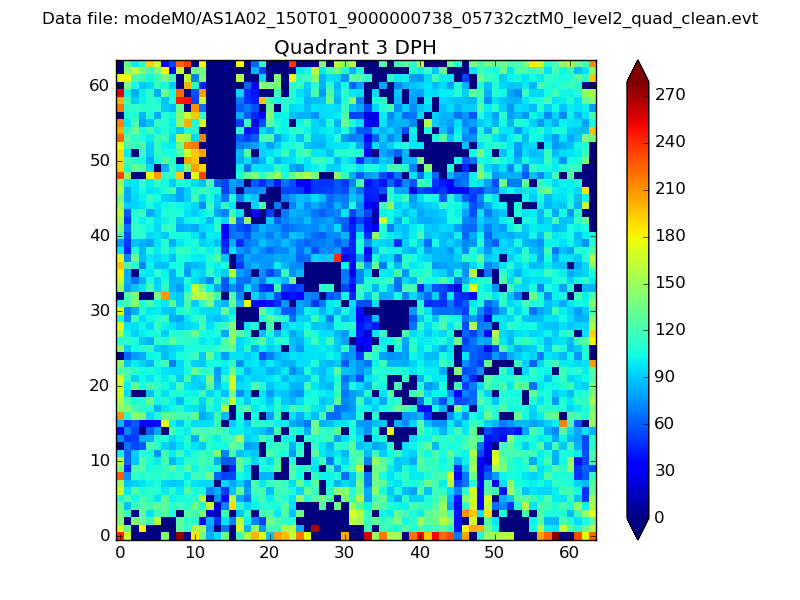 |
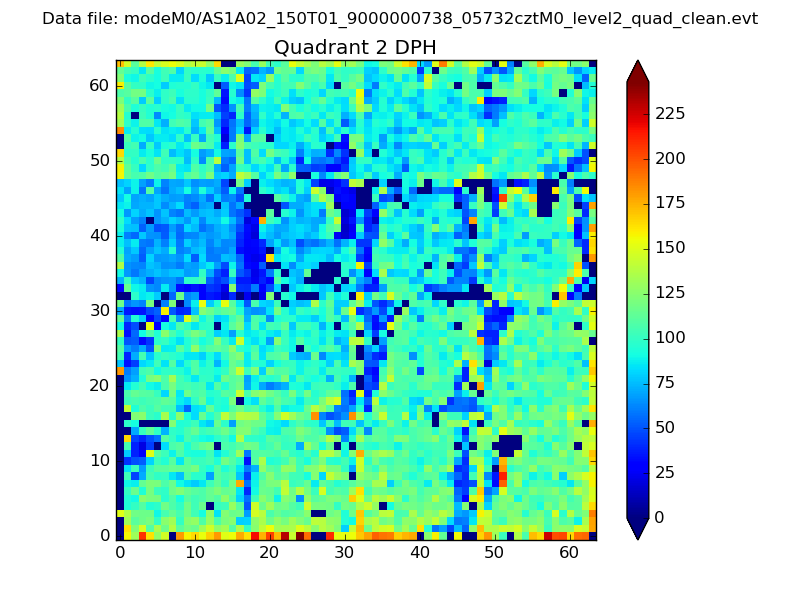 |
Quadrant C |
| Plot type | Count rate plots | Images |
|---|---|---|
| Comparison with Poisson distribution Blue bars denote a histogram of data divided into 1 sec bins. Red curve is a Poisson curve with rate = median count rate of data. |
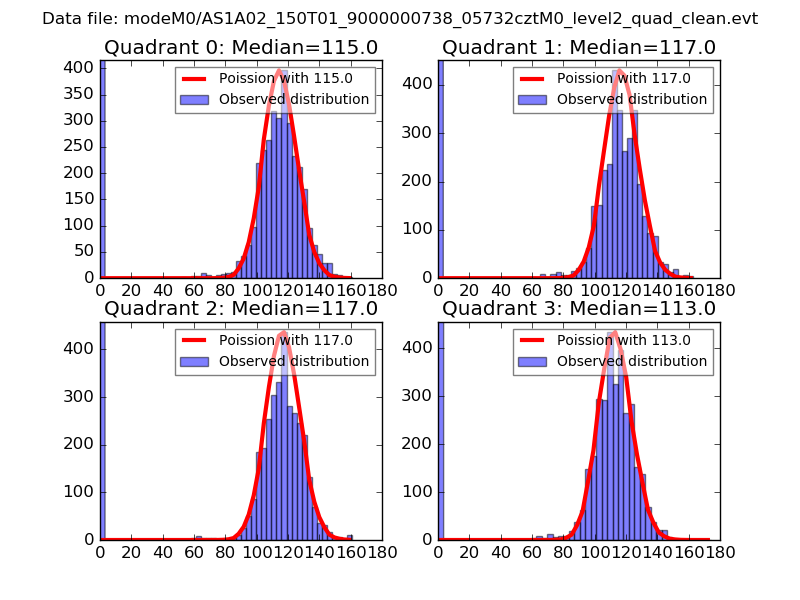 |
 |
| Quadrant-wise count rates Data is divided into 100 sec bins |
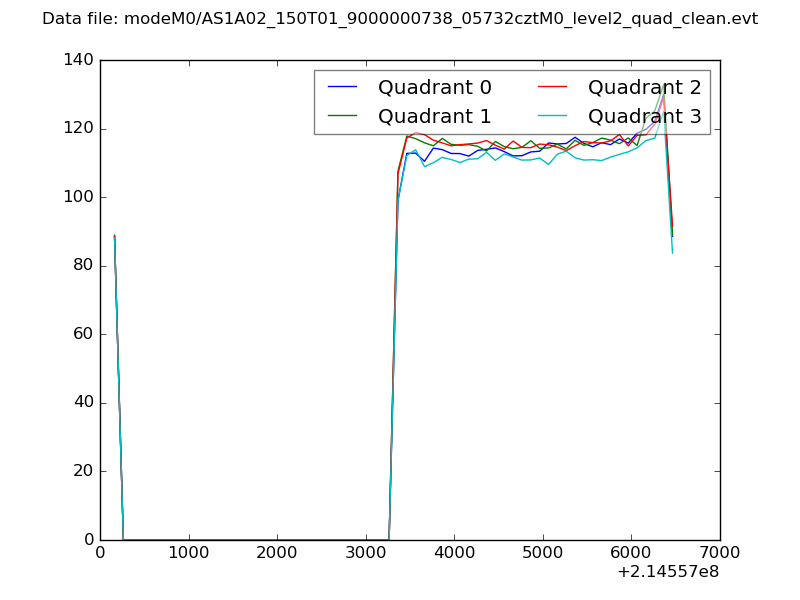 |
|
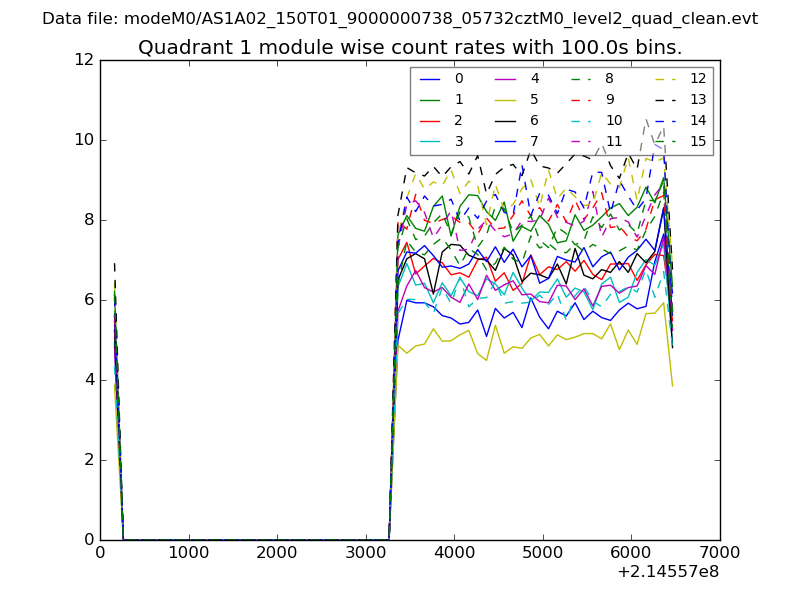
| Module-wise count rates for Quadrant A Data is divided into 100 sec bins |
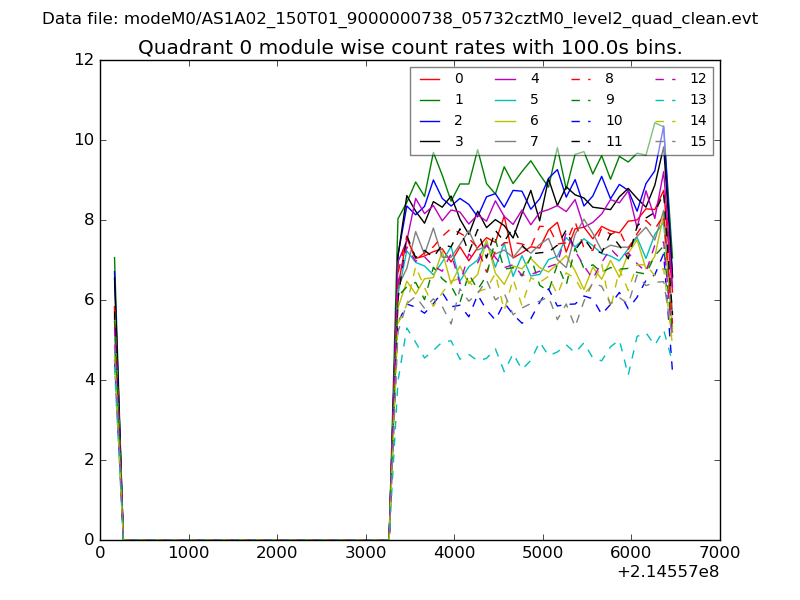 |
 |
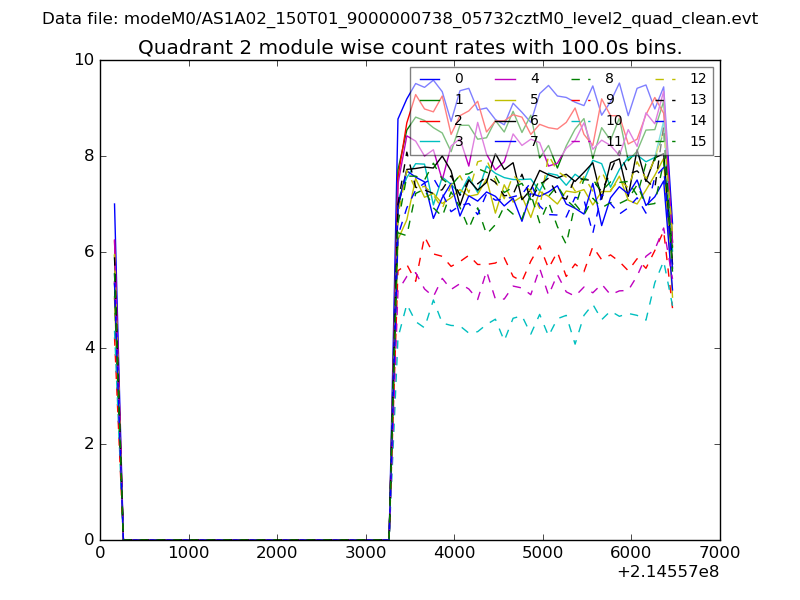
| Module-wise count rates for Quadrant B Data is divided into 100 sec bins |
 |
 |
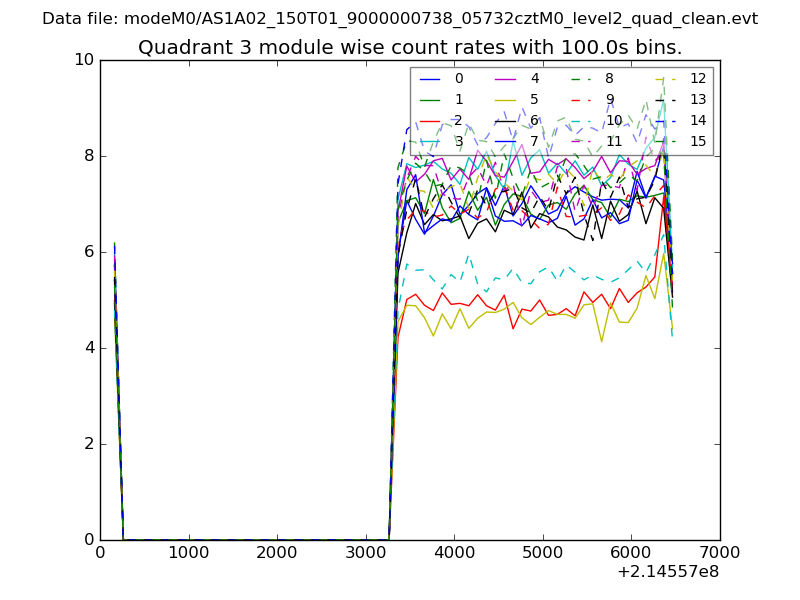
| Module-wise count rates for Quadrant C Data is divided into 100 sec bins |
 |
 |
| Module-wise count rates for Quadrant D Data is divided into 100 sec bins |
 |
 |
| Parameter | Plot |
|---|---|
| CZT HV Monitor | 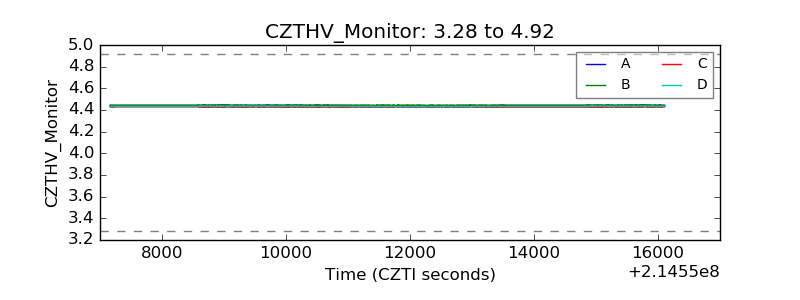 |
| D_VDD | 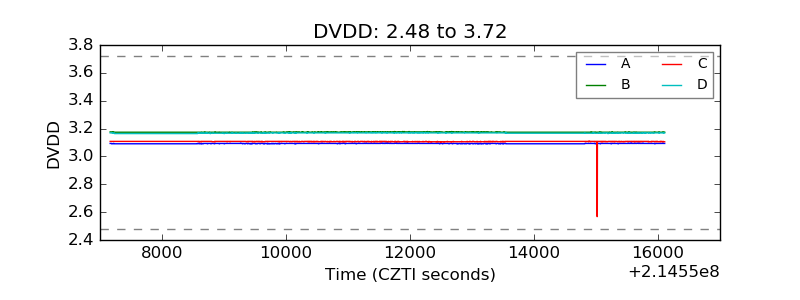 |
| Temperature 1 | 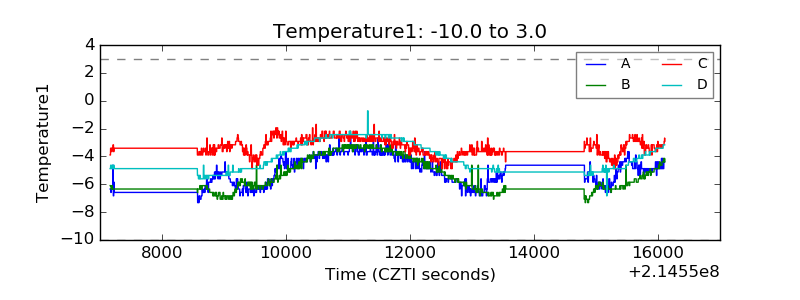 |
| Veto HV Monitor | 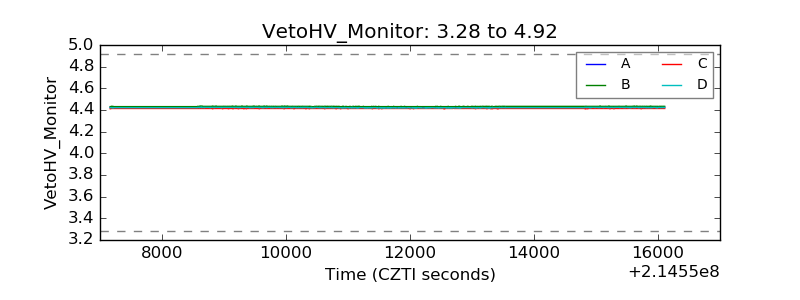 |
| Veto LLD | 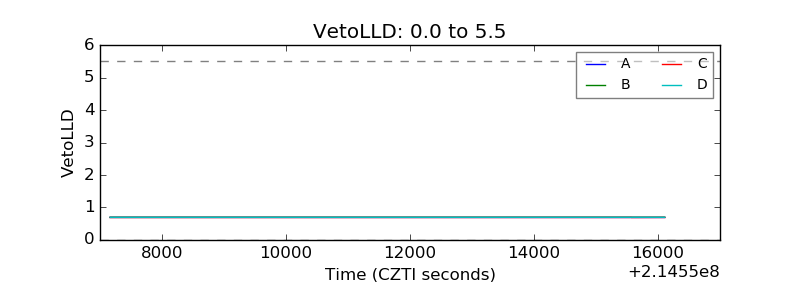 |
| Alpha Counter | 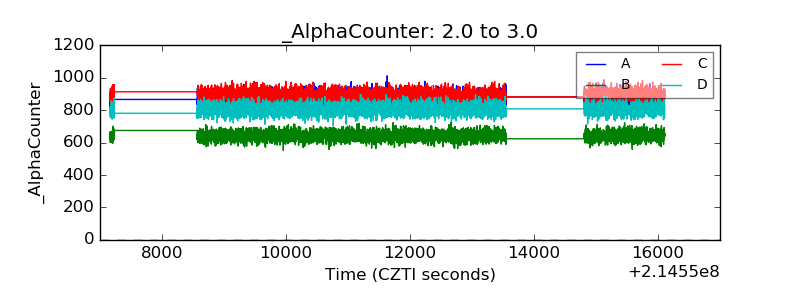 |
| _CPM_Rate | 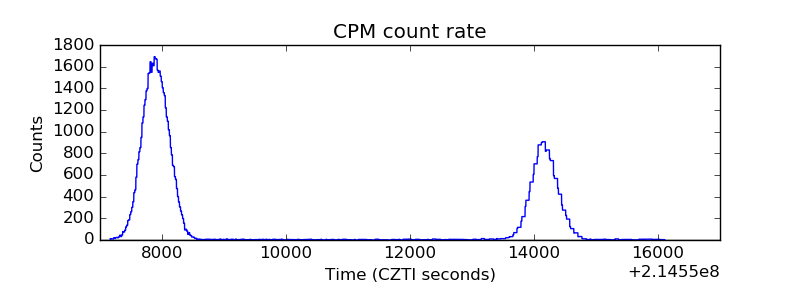 |
| CZT Counter | 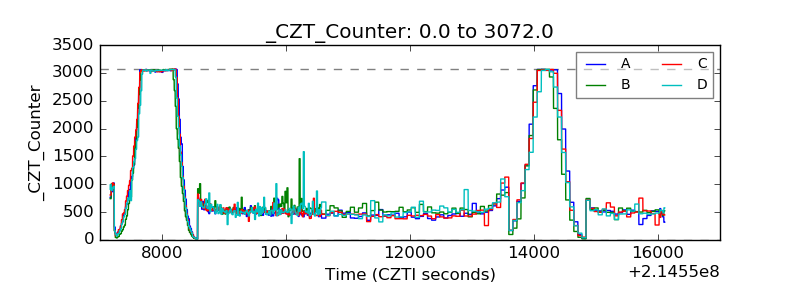 |
| +2.5 Volts monitor |  |
| +5 Volts monitor |  |
| _ROLL_ROT | 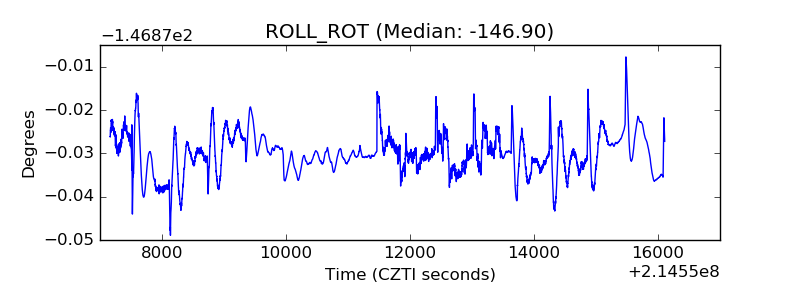 |
| _Roll_DEC | 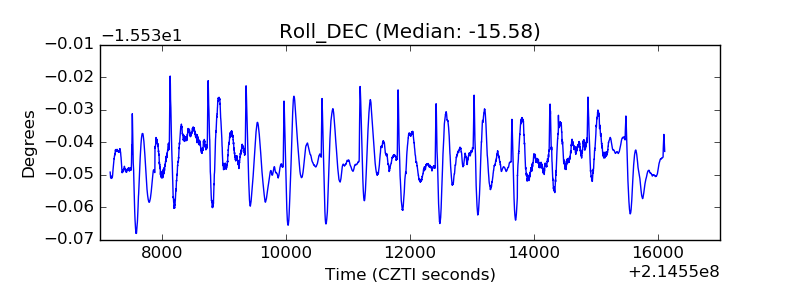 |
| _Roll_RA | 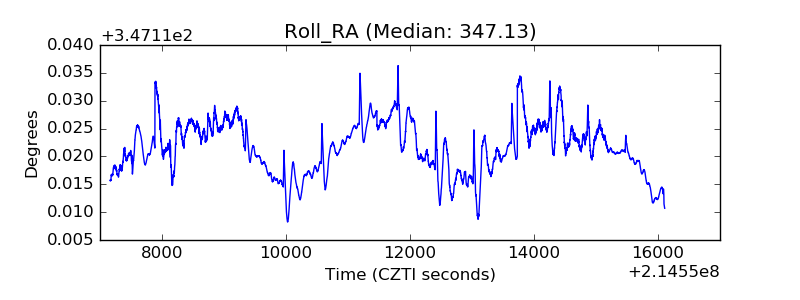 |
| Veto Counter | 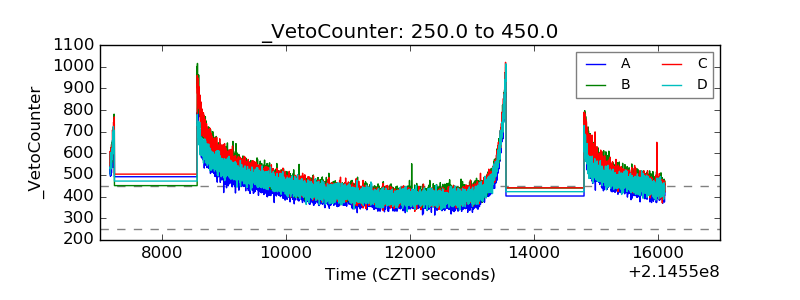 |