| Param | Original file | Final file |
|---|---|---|
| Filename | modeM0/AS1A02_150T01_9000000738_05733cztM0_level2.evt | modeM0/AS1A02_150T01_9000000738_05733cztM0_level2_quad_clean.evt |
| Size (bytes) | 481,412,160 | 74,704,320 |
| Size | 459.1 MB | 71.2 MB |
| Events in quadrant A | 3,310,951 | 449,953 |
| Events in quadrant B | 3,592,082 | 458,198 |
| Events in quadrant C | 3,277,706 | 456,974 |
| Events in quadrant D | 3,949,308 | 435,406 |
| Mode M0 | |||
|---|---|---|---|
| Quadrant | BADHDUFLAG | Total packets | Discarded packets |
| A | 0 | 14177 | 128 |
| B | 0 | 14574 | 120 |
| C | 0 | 14188 | 107 |
| D | 0 | 16149 | 156 |
| Mode M9 | |||
|---|---|---|---|
| Quadrant | BADHDUFLAG | Total packets | Discarded packets |
| A | 0 | 24 | 0 |
| B | 0 | 24 | 0 |
| C | 0 | 24 | 0 |
| D | 0 | 24 | 0 |
| Mode SS | |||
|---|---|---|---|
| Quadrant | BADHDUFLAG | Total packets | Discarded packets |
| A | 0 | 136 | 0 |
| B | 0 | 136 | 0 |
| C | 0 | 136 | 0 |
| D | 0 | 136 | 0 |
| Quadrant | Total seconds | Saturated seconds | Saturation percentage |
|---|---|---|---|
| A | 6613 | 234 | 3.538485% |
| B | 6615 | 231 | 3.492063% |
| C | 6621 | 205 | 3.096209% |
| D | 6607 | 258 | 3.904949% |
Noise dominated data is calculated using 1-second bins in cleaned event files. If a bin has >2000 counts, and if more than 50% of those come from <1% of pixels, then it is considered to be noise-dominated and hence unusable.
| Quadrant | # 1 sec bins | Bins with >0 counts | Bins with >2000 counts | High rate bins dominated by noise | Noise dominated (total time) | Noise dominated (detector-on time) | Marked lightcurve |
|---|---|---|---|---|---|---|---|
| A | 9018 | 6667 | 0 | 0 | 0.00% | 0.00% | 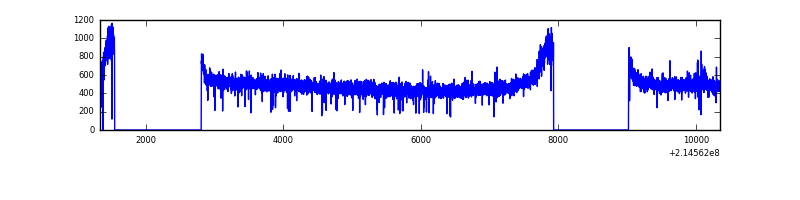 |
| B | 9018 | 6668 | 0 | 0 | 0.00% | 0.00% | 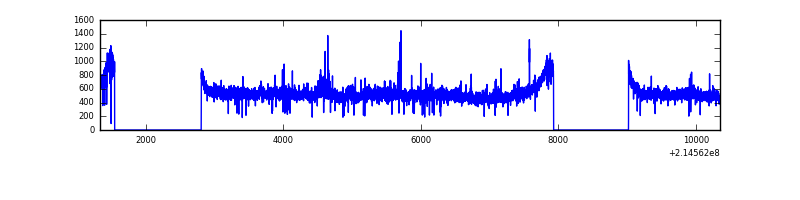 |
| C | 9018 | 6668 | 0 | 0 | 0.00% | 0.00% | 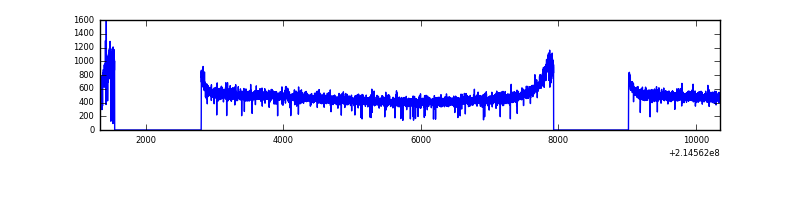 |
| D | 9018 | 6667 | 48 | 48 | 0.53% | 0.72% | 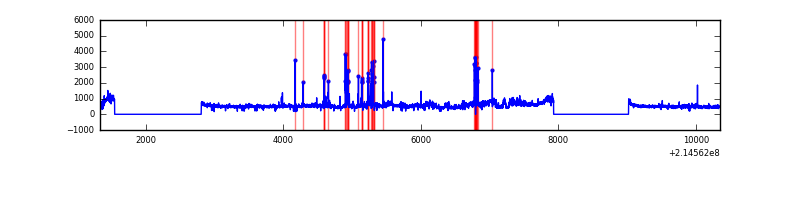 |
Top three noisy pixels from each quadrant. If the there are fewer than three noisy pixels in the level2.evt file, extra rows are filled as -1
| Pixel properties | Quadrant properties | ||||||
|---|---|---|---|---|---|---|---|
| Quadrant | DetID | PixID | Counts | Sigma | Mean | Median | Sigma |
| A | 15 | 174 | 10188 | 53.14 | 858 | 839 | 175.9 |
| A | 12 | 194 | 8494 | 43.51 | 858 | 839 | 175.9 |
| A | 0 | 226 | 8290 | 42.35 | 858 | 839 | 175.9 |
| B | 5 | 172 | 95254 | 562.54 | 866 | 847 | 167.8 |
| B | 15 | 204 | 81358 | 479.74 | 866 | 847 | 167.8 |
| B | 11 | 51 | 40439 | 235.91 | 866 | 847 | 167.8 |
| C | 13 | 61 | 6636 | 29.76 | 837 | 842 | 194.7 |
| C | 9 | 16 | 5301 | 22.91 | 837 | 842 | 194.7 |
| C | 12 | 4 | 3247 | 12.35 | 837 | 842 | 194.7 |
| D | 1 | 20 | 440354 | 2146.67 | 837 | 812 | 204.8 |
| D | 12 | 233 | 83739 | 405.0 | 837 | 812 | 204.8 |
| D | 2 | 206 | 82545 | 399.17 | 837 | 812 | 204.8 |
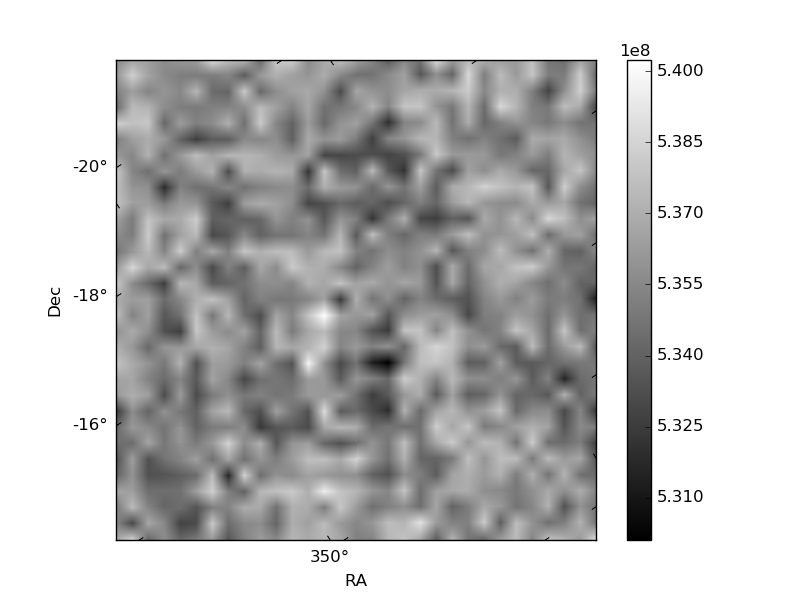
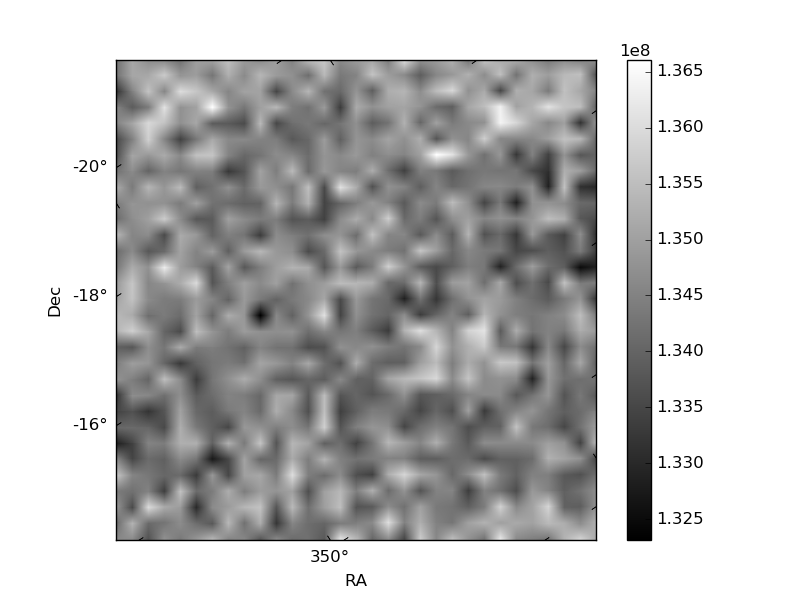
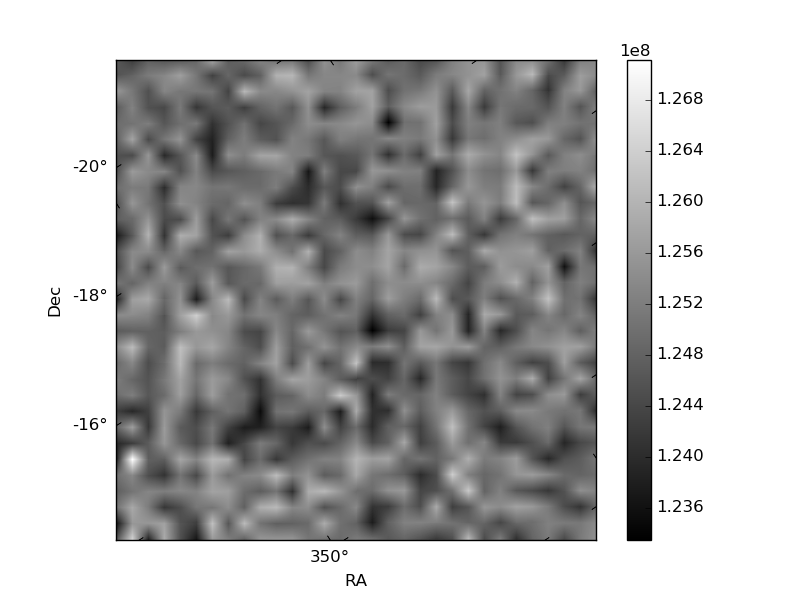
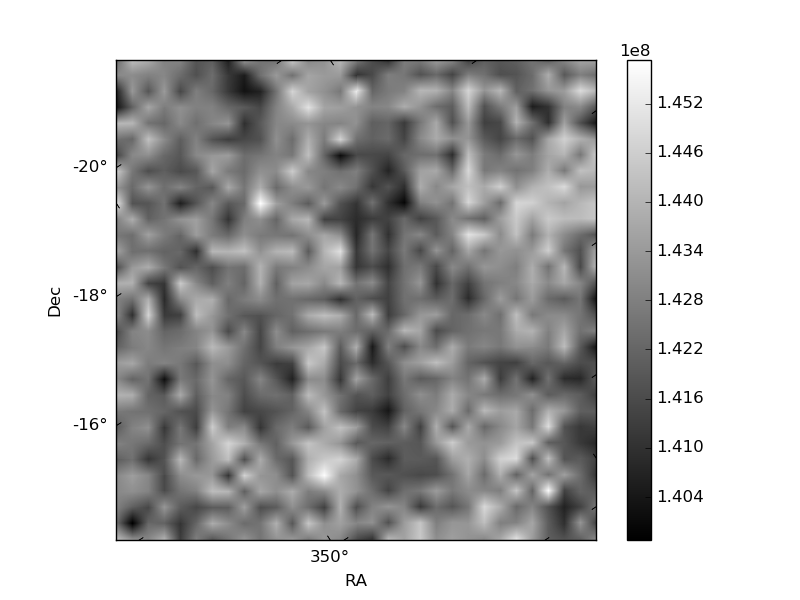
Histogram calculated using DETX and DETY for each event in the final _common_clean file
| Quadrant A | 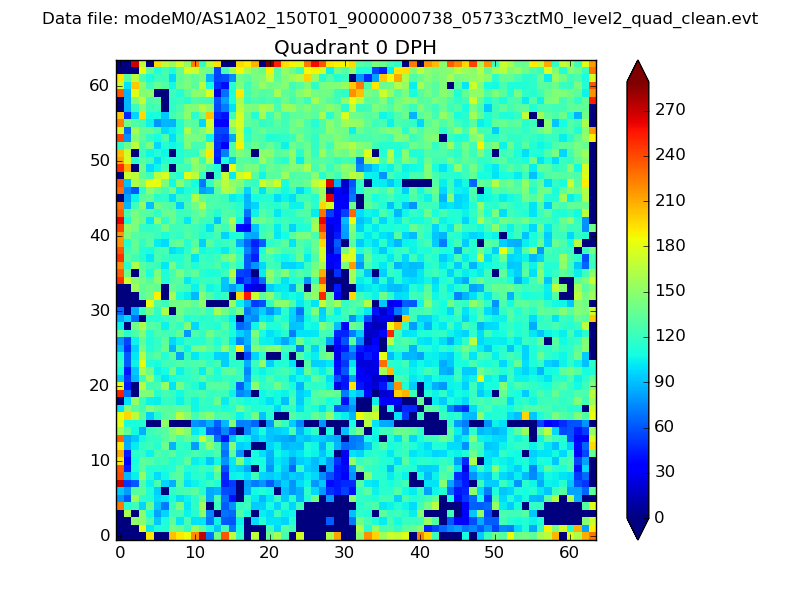 |
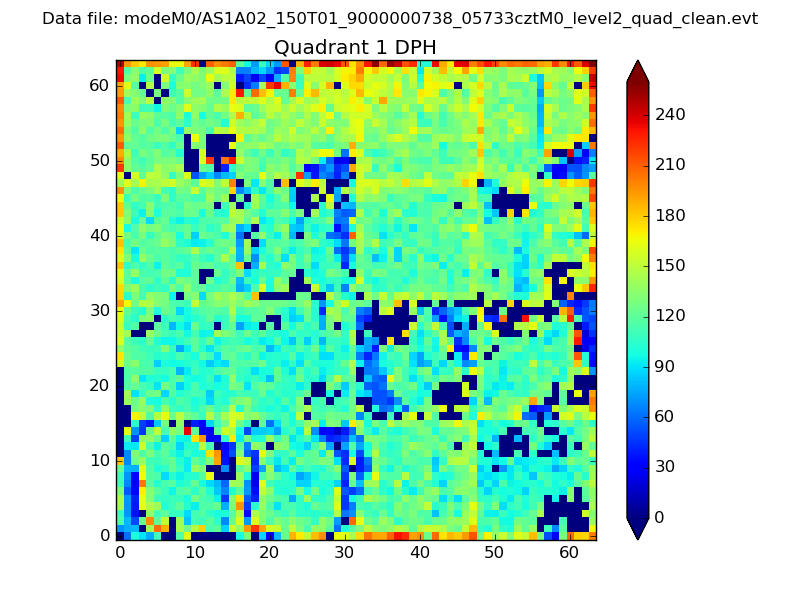 |
Quadrant B |
|---|---|---|---|
| Quadrant D | 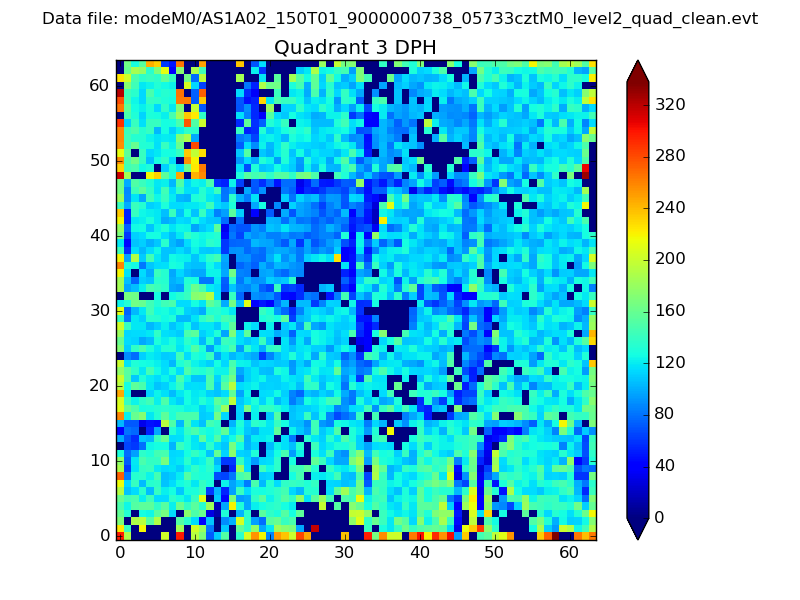 |
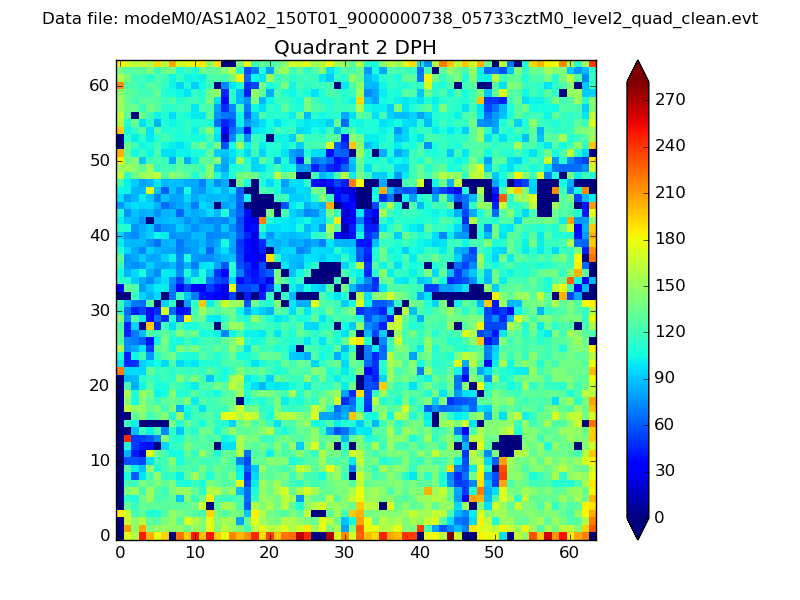 |
Quadrant C |
| Plot type | Count rate plots | Images |
|---|---|---|
| Comparison with Poisson distribution Blue bars denote a histogram of data divided into 1 sec bins. Red curve is a Poisson curve with rate = median count rate of data. |
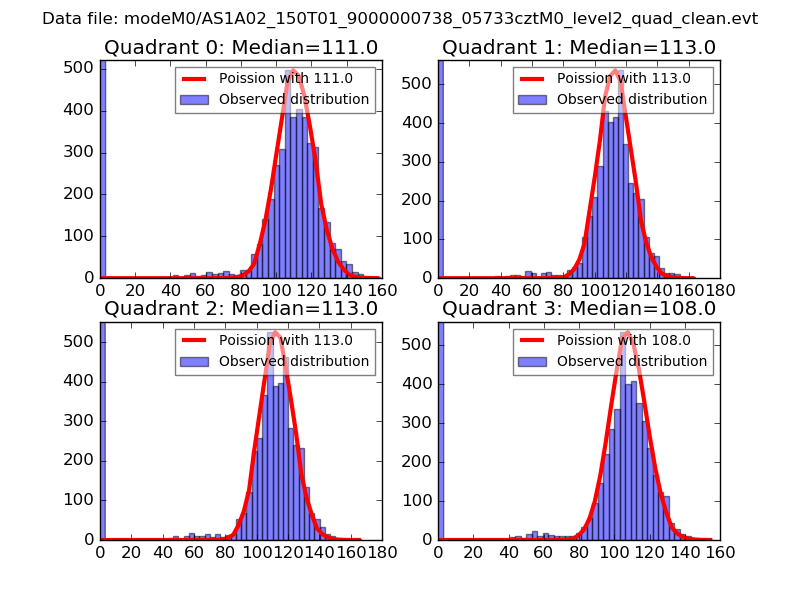 |
 |
| Quadrant-wise count rates Data is divided into 100 sec bins |
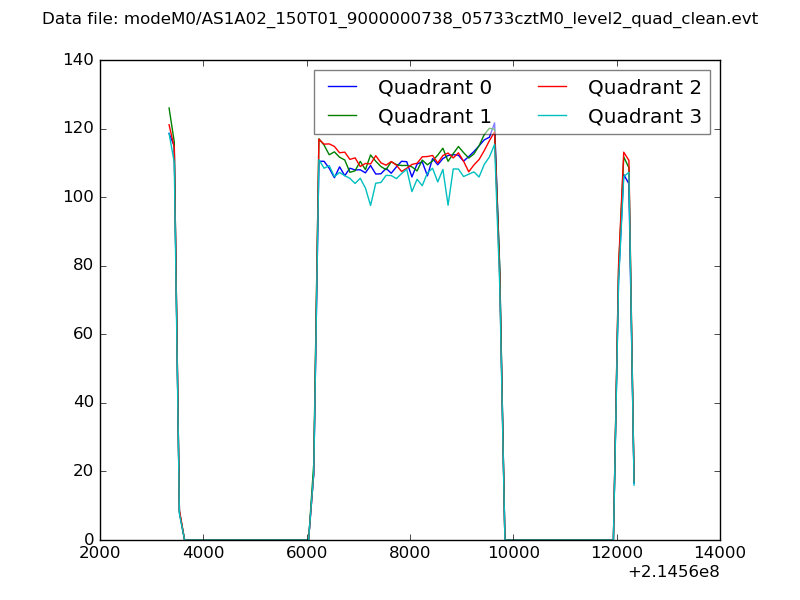 |
|
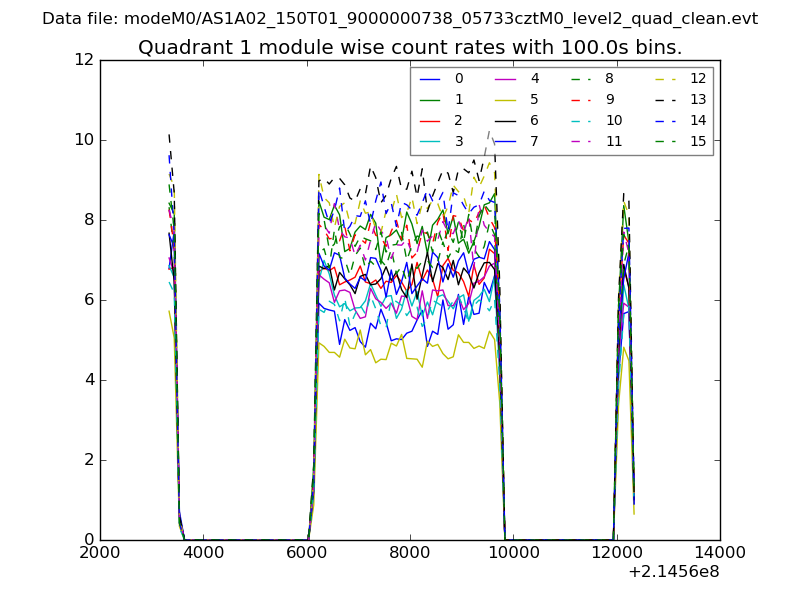
| Module-wise count rates for Quadrant A Data is divided into 100 sec bins |
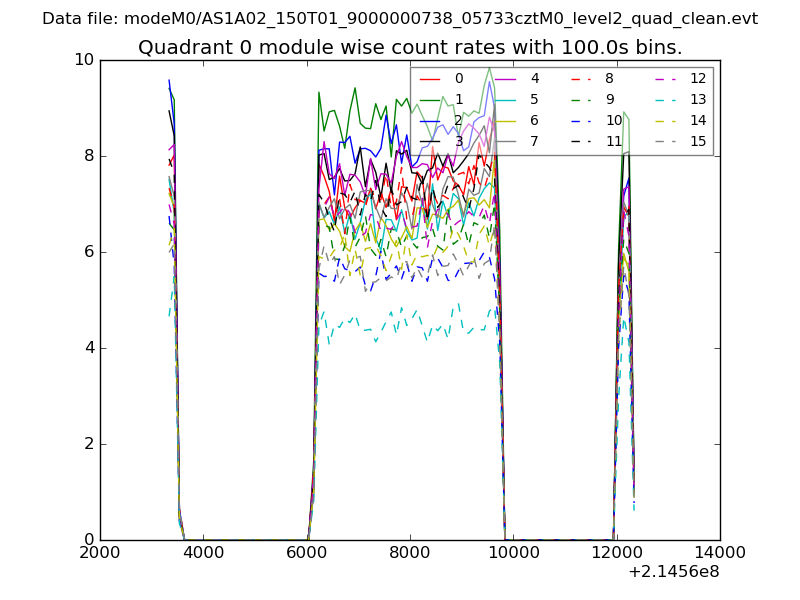 |
 |
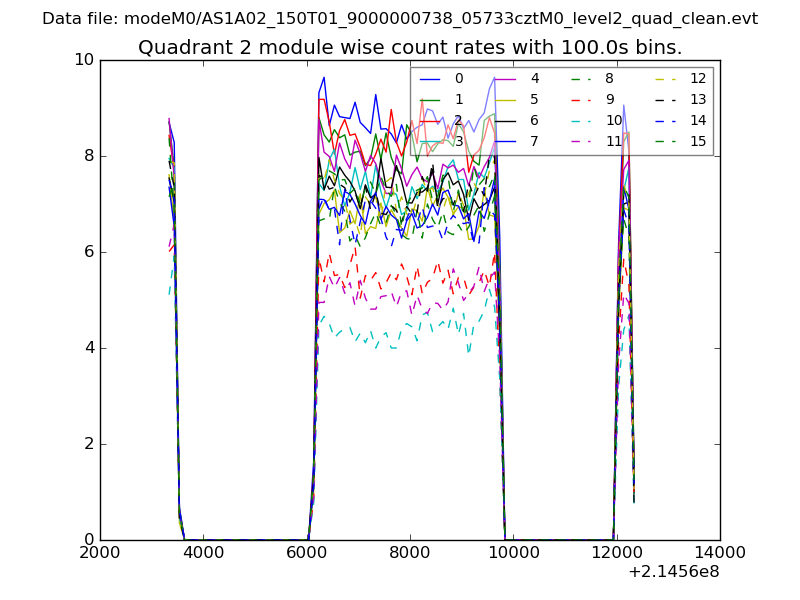
| Module-wise count rates for Quadrant B Data is divided into 100 sec bins |
 |
 |
| Module-wise count rates for Quadrant C Data is divided into 100 sec bins |
 |
 |
| Module-wise count rates for Quadrant D Data is divided into 100 sec bins |
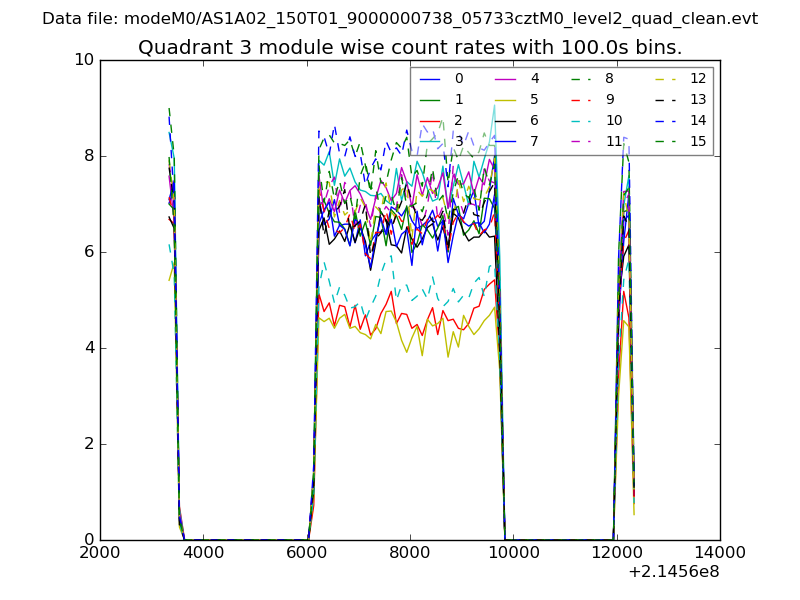 |
 |
| Parameter | Plot |
|---|---|
| CZT HV Monitor | 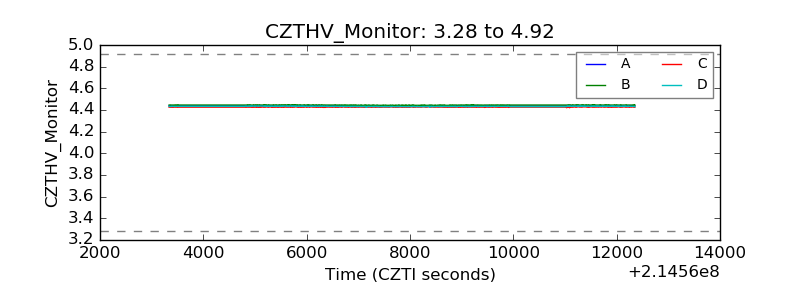 |
| D_VDD | 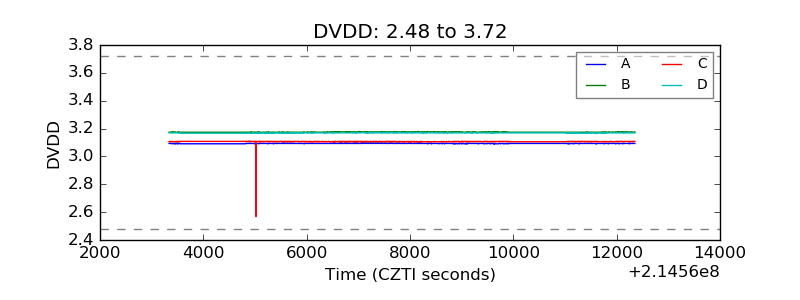 |
| Temperature 1 | 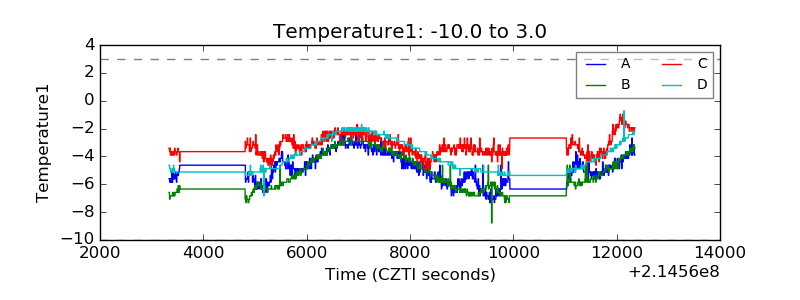 |
| Veto HV Monitor | 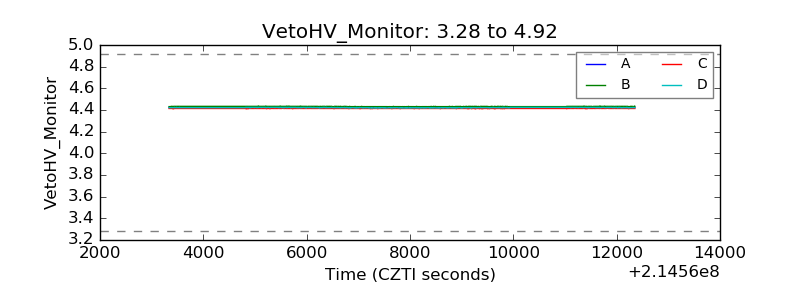 |
| Veto LLD | 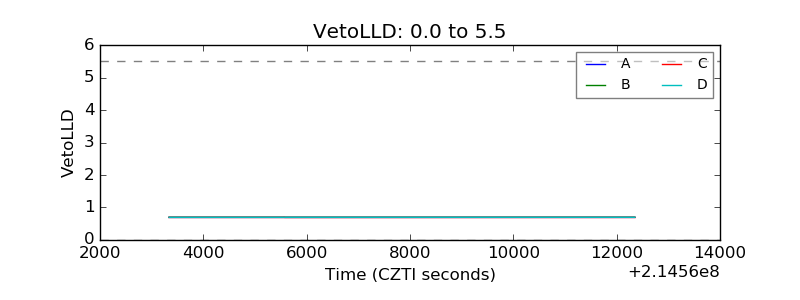 |
| Alpha Counter | 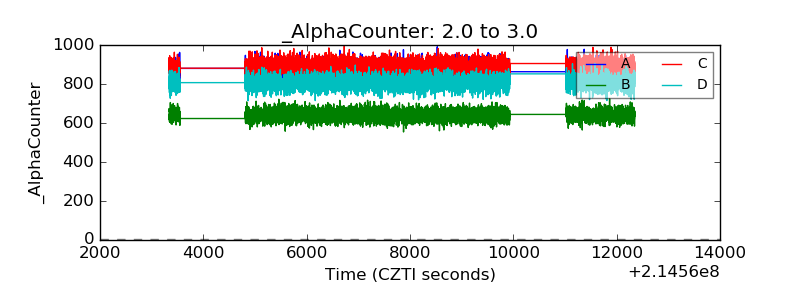 |
| _CPM_Rate | 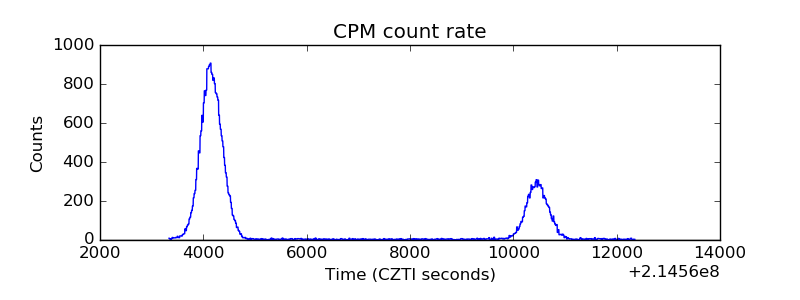 |
| CZT Counter | 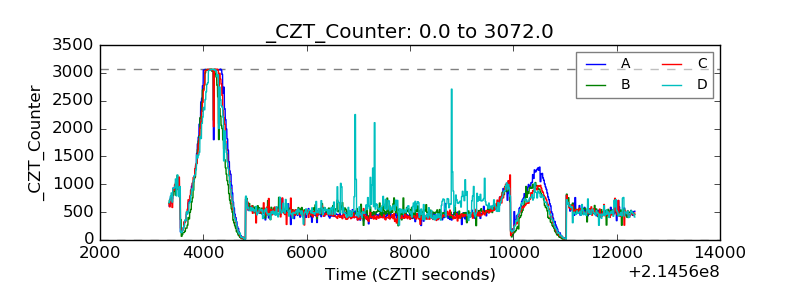 |
| +2.5 Volts monitor |  |
| +5 Volts monitor |  |
| _ROLL_ROT | 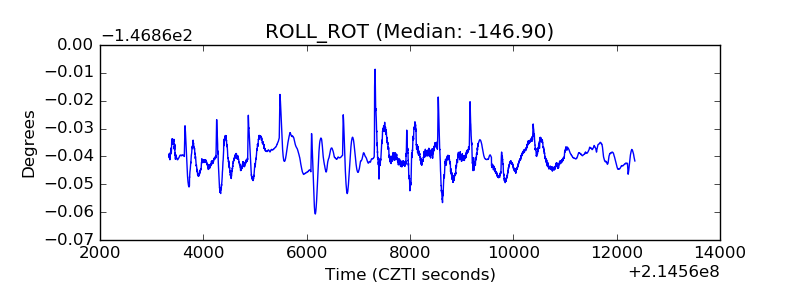 |
| _Roll_DEC | 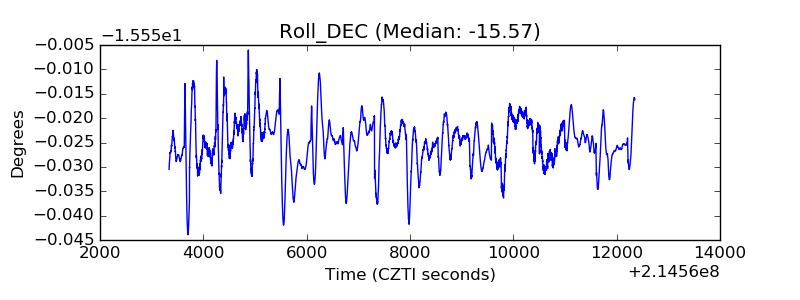 |
| _Roll_RA | 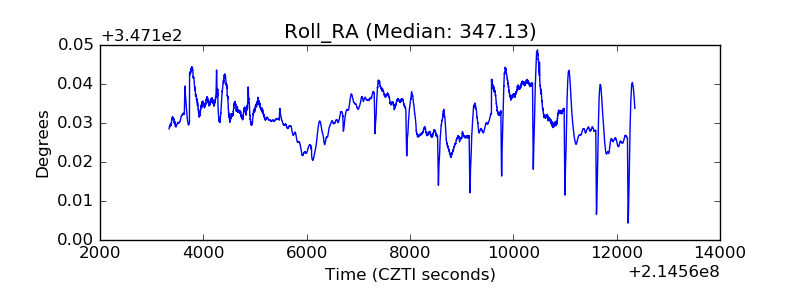 |
| Veto Counter | 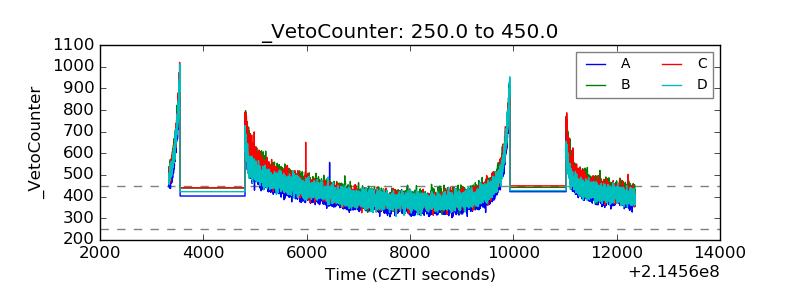 |