| Param | Original file | Final file |
|---|---|---|
| Filename | modeM0/AS1A02_150T01_9000000738_05734cztM0_level2.evt | modeM0/AS1A02_150T01_9000000738_05734cztM0_level2_quad_clean.evt |
| Size (bytes) | 502,868,160 | 82,442,880 |
| Size | 479.6 MB | 78.6 MB |
| Events in quadrant A | 3,498,205 | 497,118 |
| Events in quadrant B | 3,972,488 | 506,168 |
| Events in quadrant C | 3,461,495 | 502,730 |
| Events in quadrant D | 3,802,435 | 483,776 |
| Mode M0 | |||
|---|---|---|---|
| Quadrant | BADHDUFLAG | Total packets | Discarded packets |
| A | 0 | 15459 | 217 |
| B | 0 | 16490 | 152 |
| C | 0 | 15437 | 198 |
| D | 0 | 16377 | 243 |
| Mode M9 | |||
|---|---|---|---|
| Quadrant | BADHDUFLAG | Total packets | Discarded packets |
| A | 0 | 19 | 0 |
| B | 0 | 19 | 0 |
| C | 0 | 19 | 0 |
| D | 0 | 19 | 0 |
| Mode SS | |||
|---|---|---|---|
| Quadrant | BADHDUFLAG | Total packets | Discarded packets |
| A | 0 | 150 | 0 |
| B | 0 | 150 | 0 |
| C | 0 | 150 | 0 |
| D | 0 | 150 | 0 |
| Quadrant | Total seconds | Saturated seconds | Saturation percentage |
|---|---|---|---|
| A | 7264 | 204 | 2.808370% |
| B | 7295 | 237 | 3.248801% |
| C | 7274 | 137 | 1.883420% |
| D | 7268 | 171 | 2.352779% |
Noise dominated data is calculated using 1-second bins in cleaned event files. If a bin has >2000 counts, and if more than 50% of those come from <1% of pixels, then it is considered to be noise-dominated and hence unusable.
| Quadrant | # 1 sec bins | Bins with >0 counts | Bins with >2000 counts | High rate bins dominated by noise | Noise dominated (total time) | Noise dominated (detector-on time) | Marked lightcurve |
|---|---|---|---|---|---|---|---|
| A | 9263 | 7361 | 0 | 0 | 0.00% | 0.00% | 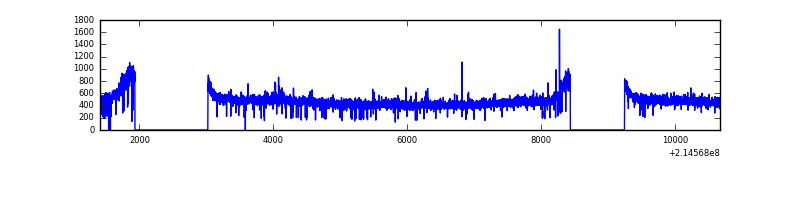 |
| B | 9263 | 7361 | 1 | 1 | 0.01% | 0.01% | 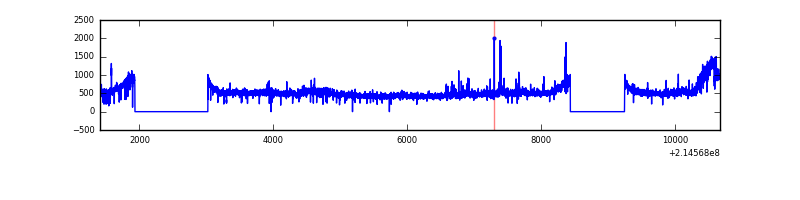 |
| C | 9263 | 7359 | 0 | 0 | 0.00% | 0.00% | 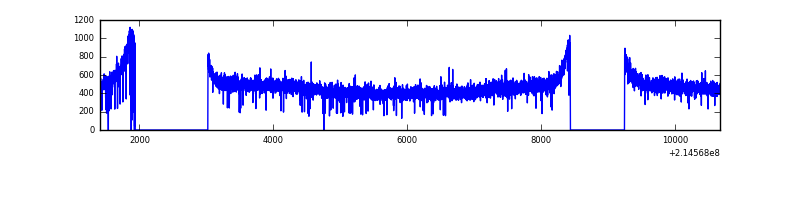 |
| D | 9263 | 7358 | 17 | 17 | 0.18% | 0.23% | 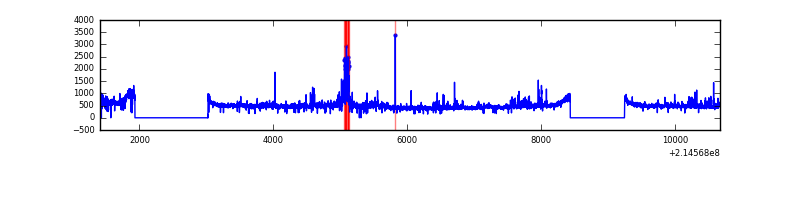 |
Top three noisy pixels from each quadrant. If the there are fewer than three noisy pixels in the level2.evt file, extra rows are filled as -1
| Pixel properties | Quadrant properties | ||||||
|---|---|---|---|---|---|---|---|
| Quadrant | DetID | PixID | Counts | Sigma | Mean | Median | Sigma |
| A | 15 | 174 | 9949 | 48.79 | 906 | 882 | 185.8 |
| A | 0 | 226 | 8770 | 42.44 | 906 | 882 | 185.8 |
| A | 12 | 194 | 8769 | 42.44 | 906 | 882 | 185.8 |
| B | 5 | 172 | 270628 | 1508.97 | 918 | 896 | 178.8 |
| B | 11 | 51 | 55079 | 303.12 | 918 | 896 | 178.8 |
| B | 15 | 204 | 47355 | 259.91 | 918 | 896 | 178.8 |
| C | 14 | 67 | 8983 | 39.03 | 883 | 886 | 207.4 |
| C | 13 | 61 | 7191 | 30.39 | 883 | 886 | 207.4 |
| C | 12 | 4 | 3197 | 11.14 | 883 | 886 | 207.4 |
| D | 12 | 233 | 168527 | 767.57 | 887 | 859 | 218.4 |
| D | 1 | 20 | 144271 | 656.52 | 887 | 859 | 218.4 |
| D | 2 | 136 | 38741 | 173.42 | 887 | 859 | 218.4 |
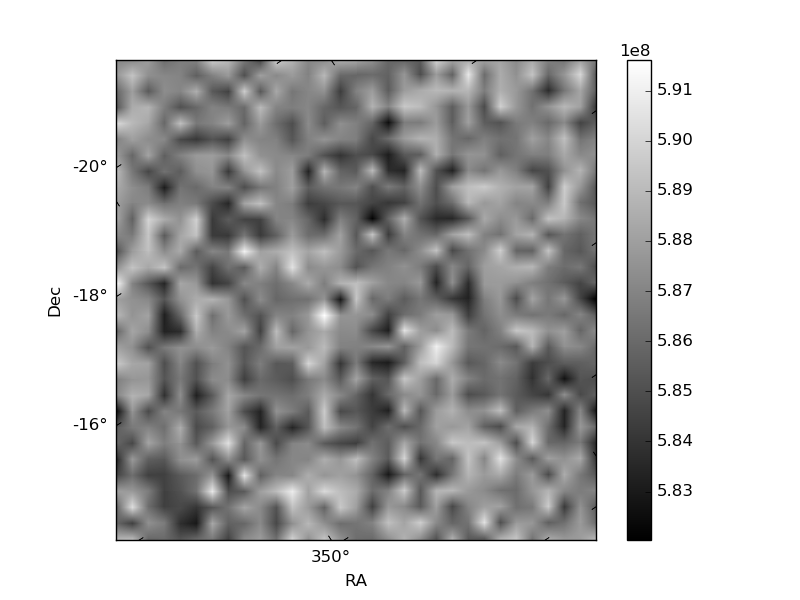
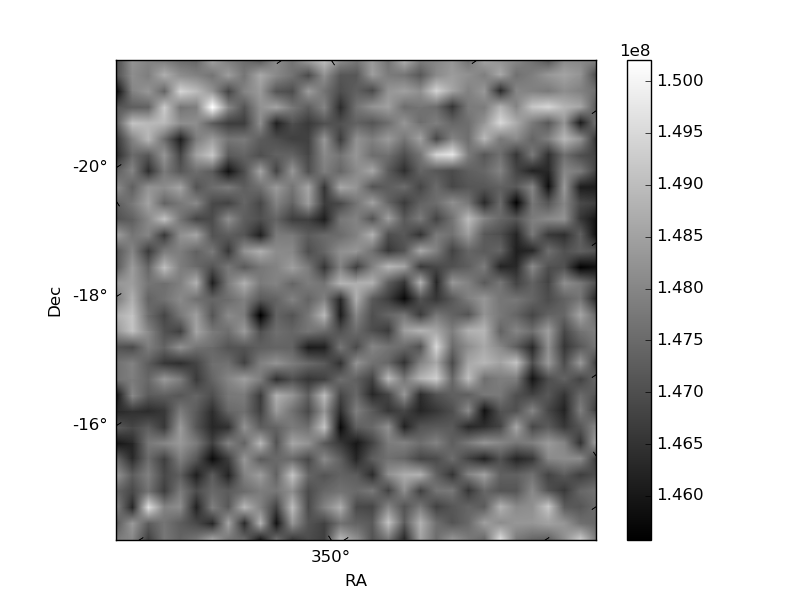
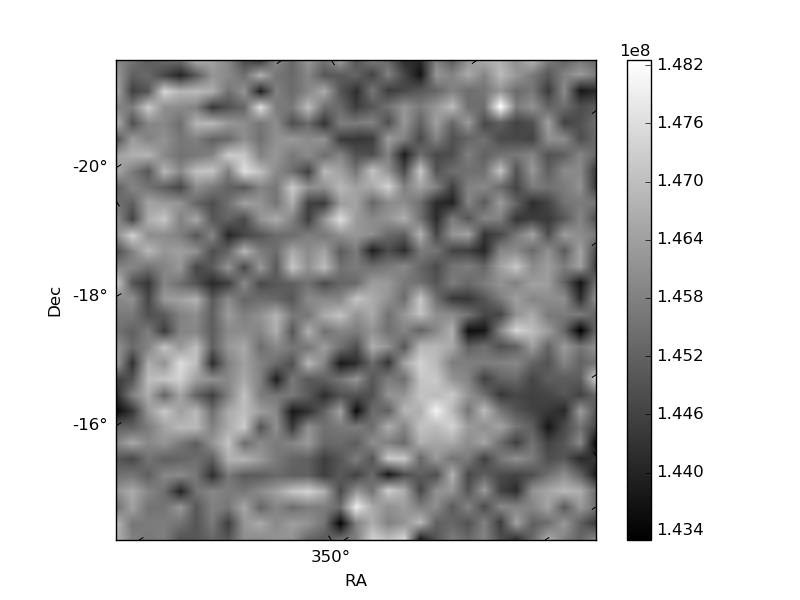
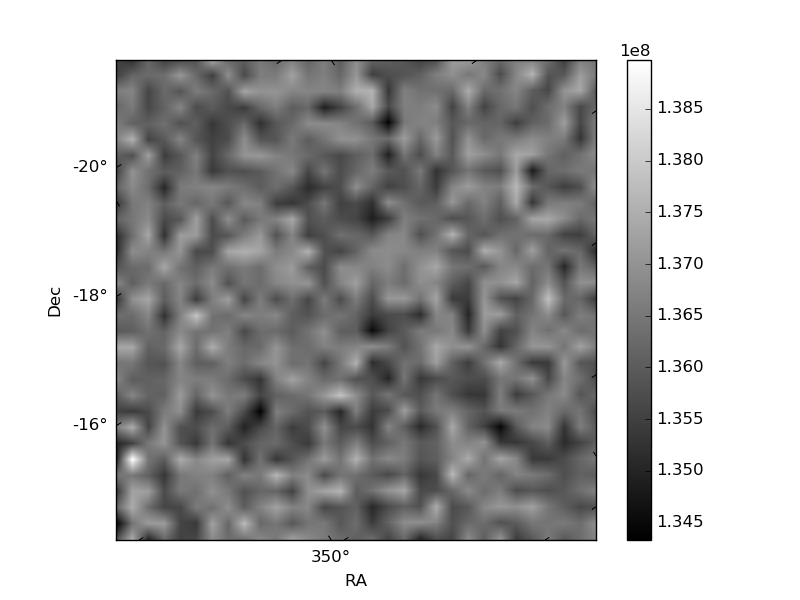
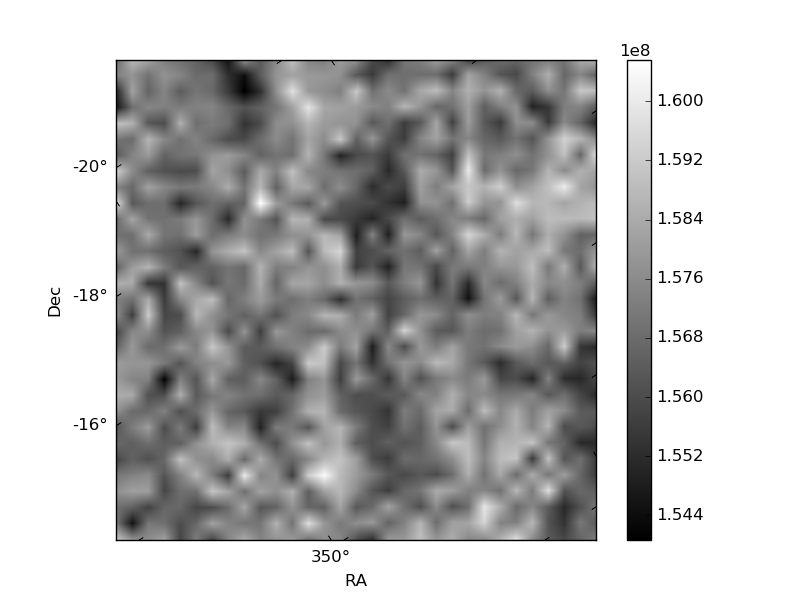
Histogram calculated using DETX and DETY for each event in the final _common_clean file
| Quadrant A | 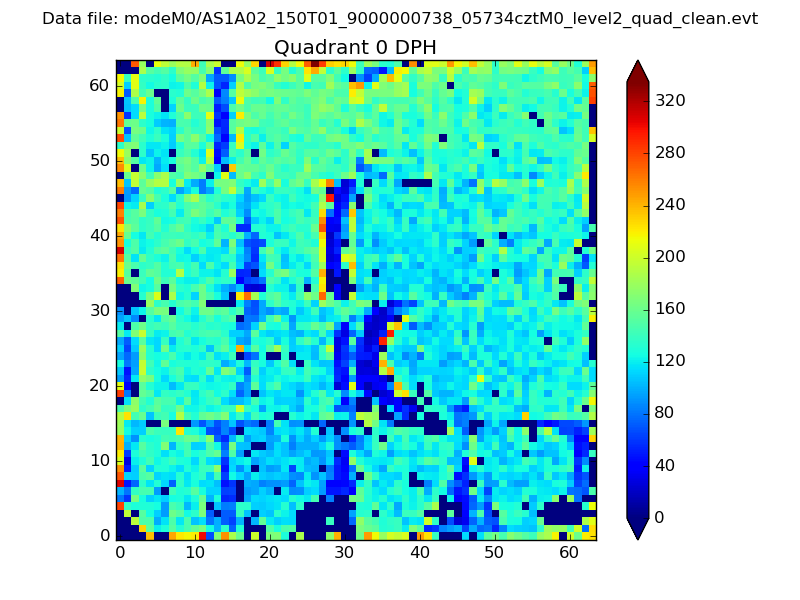 |
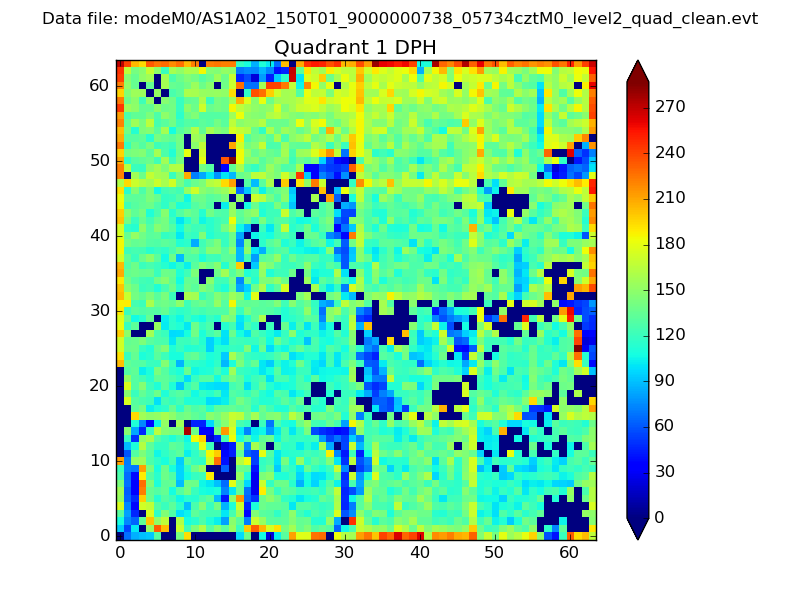 |
Quadrant B |
|---|---|---|---|
| Quadrant D | 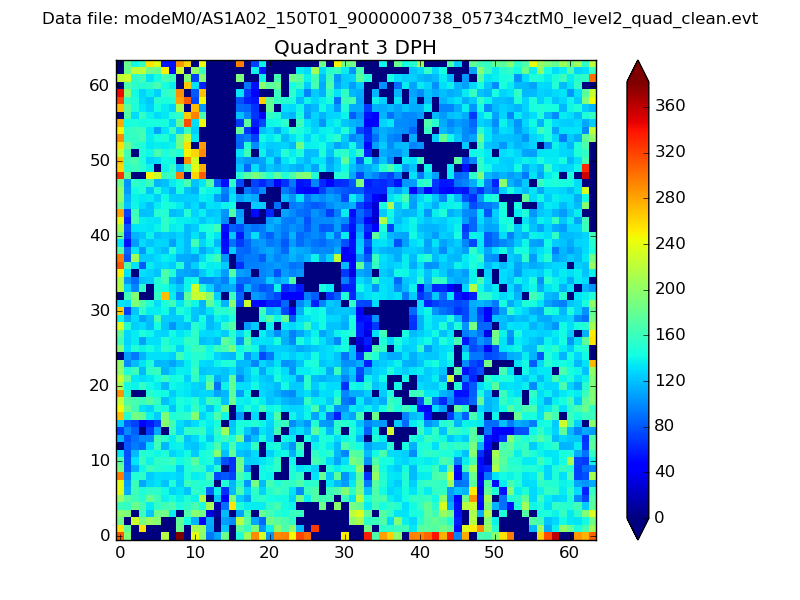 |
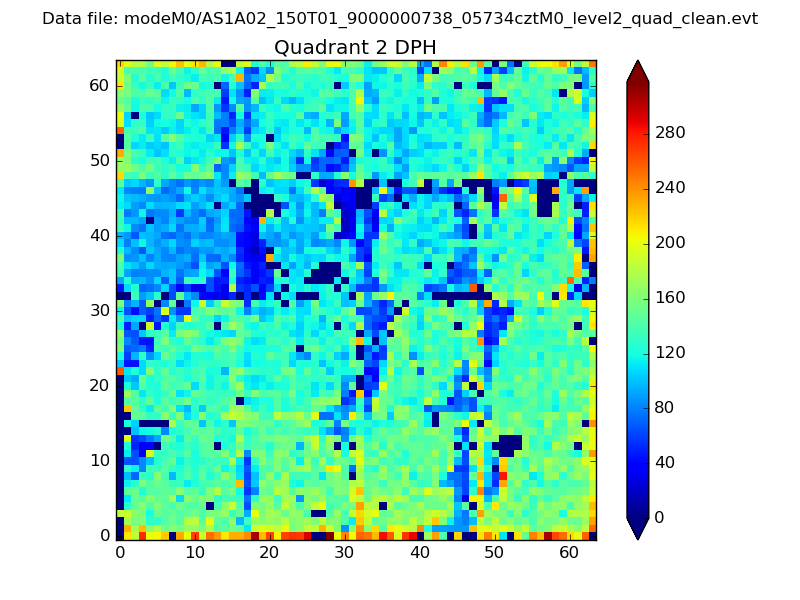 |
Quadrant C |
| Plot type | Count rate plots | Images |
|---|---|---|
| Comparison with Poisson distribution Blue bars denote a histogram of data divided into 1 sec bins. Red curve is a Poisson curve with rate = median count rate of data. |
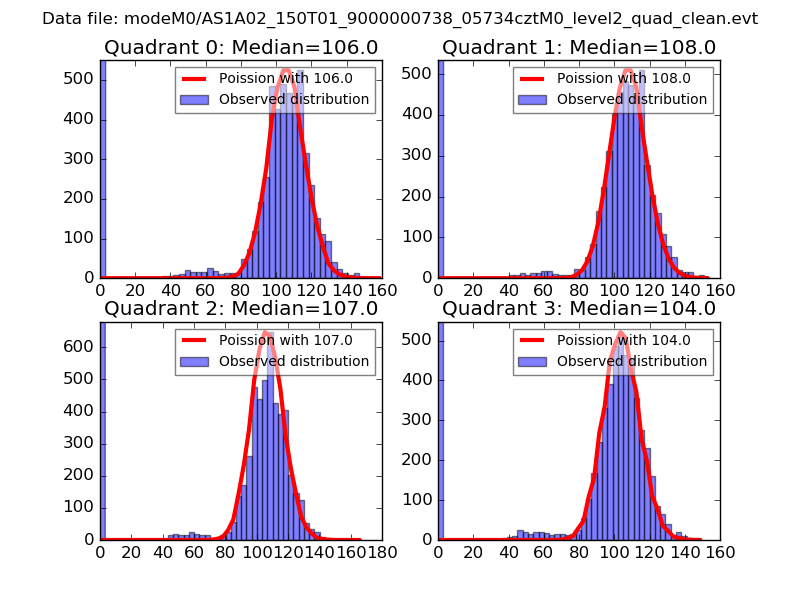 |
 |
| Quadrant-wise count rates Data is divided into 100 sec bins |
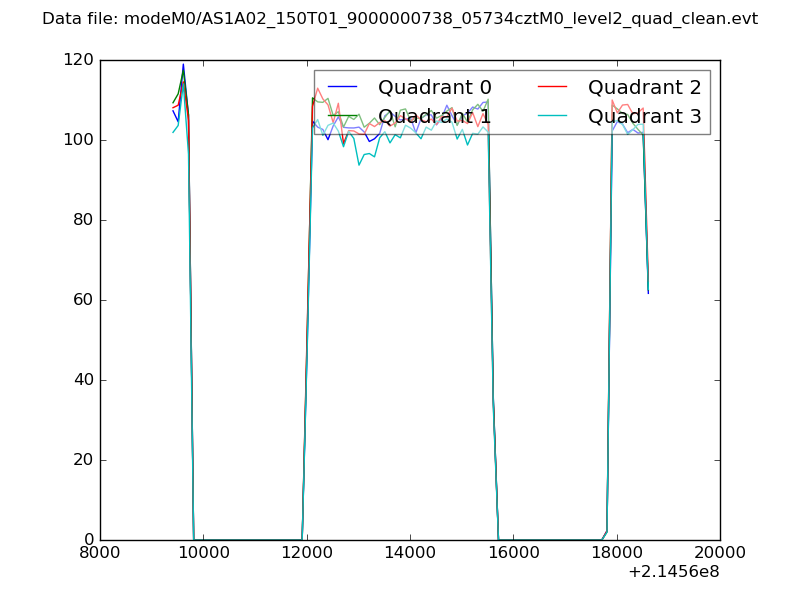 |
|
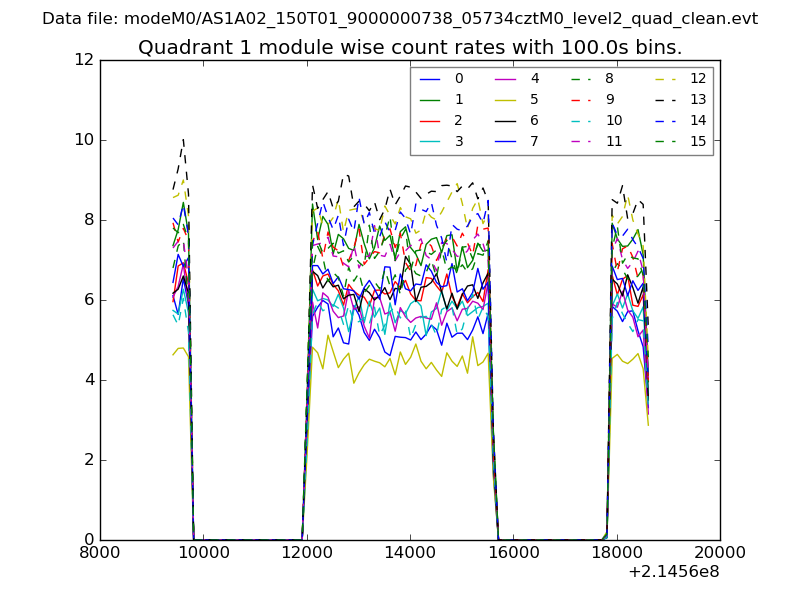
| Module-wise count rates for Quadrant A Data is divided into 100 sec bins |
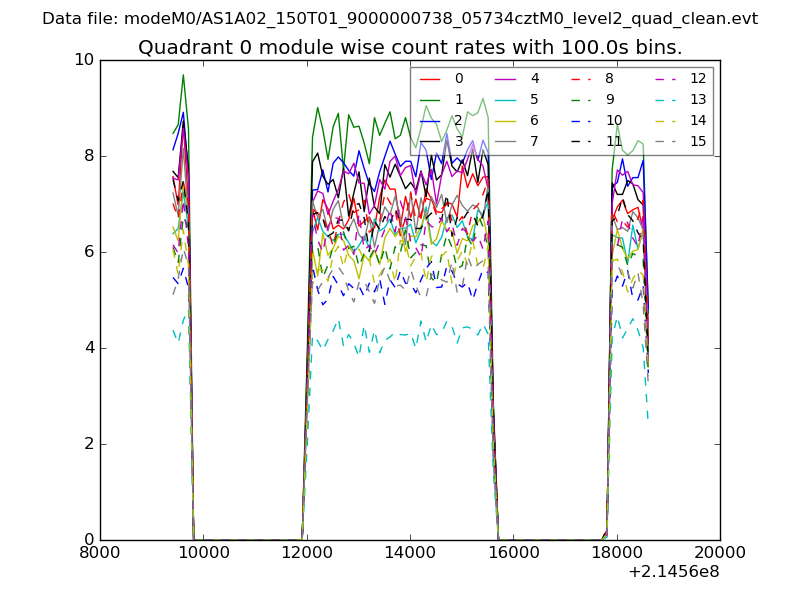 |
 |
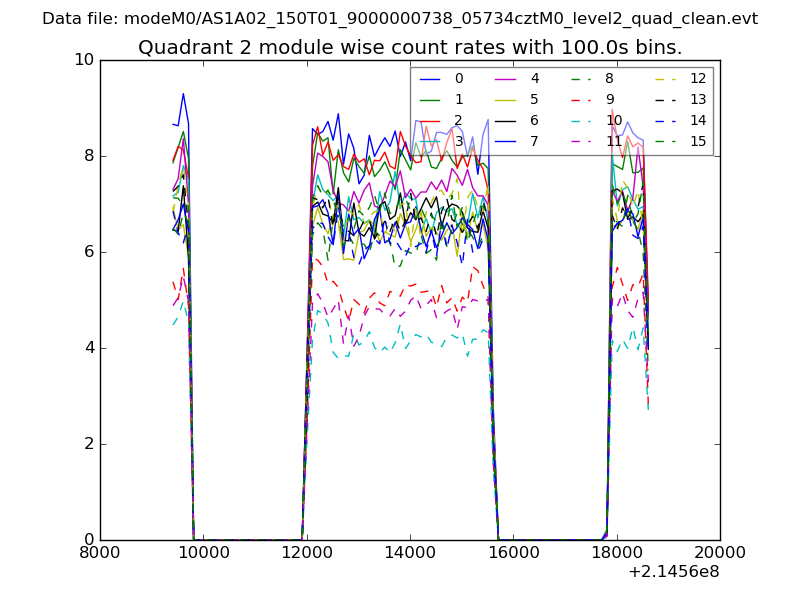
| Module-wise count rates for Quadrant B Data is divided into 100 sec bins |
 |
 |
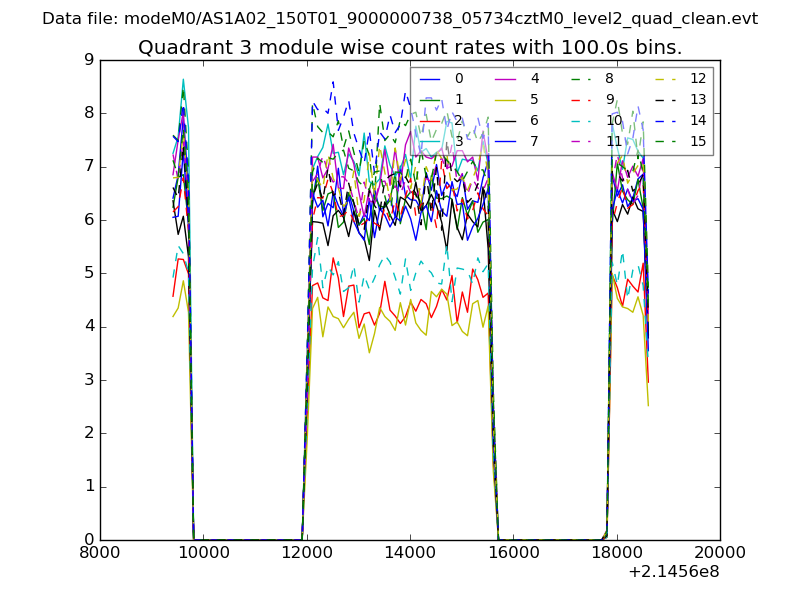
| Module-wise count rates for Quadrant C Data is divided into 100 sec bins |
 |
 |
| Module-wise count rates for Quadrant D Data is divided into 100 sec bins |
 |
 |
| Parameter | Plot |
|---|---|
| CZT HV Monitor | 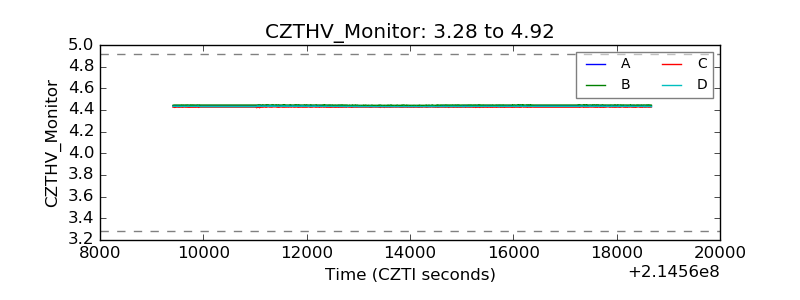 |
| D_VDD | 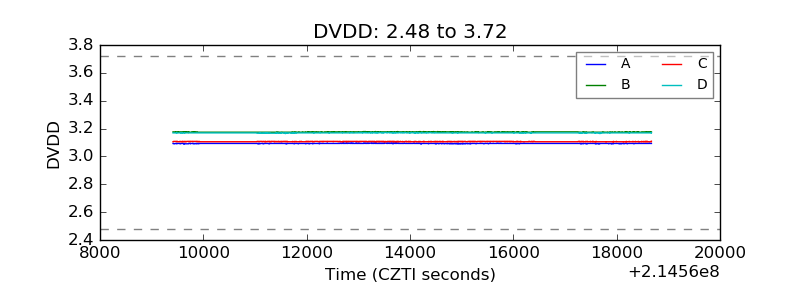 |
| Temperature 1 | 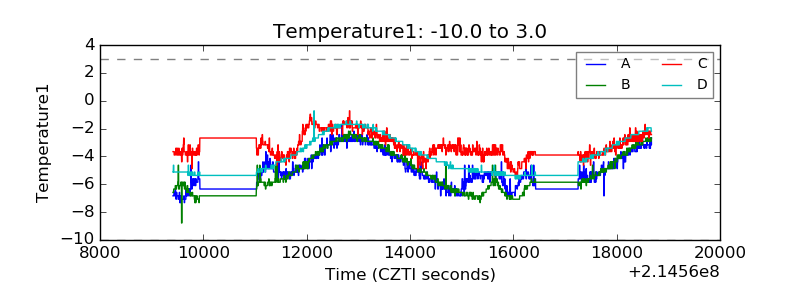 |
| Veto HV Monitor | 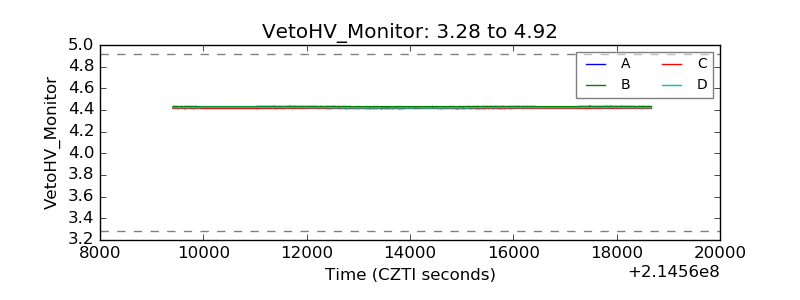 |
| Veto LLD | 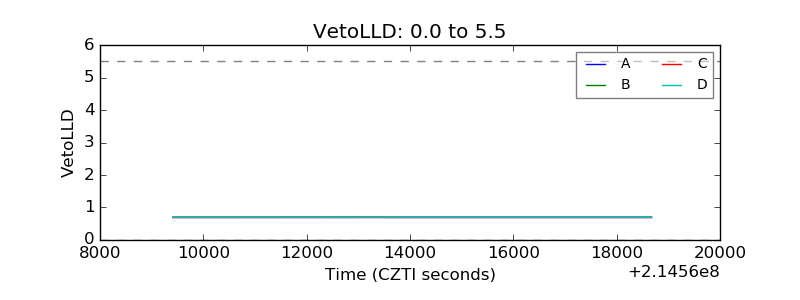 |
| Alpha Counter | 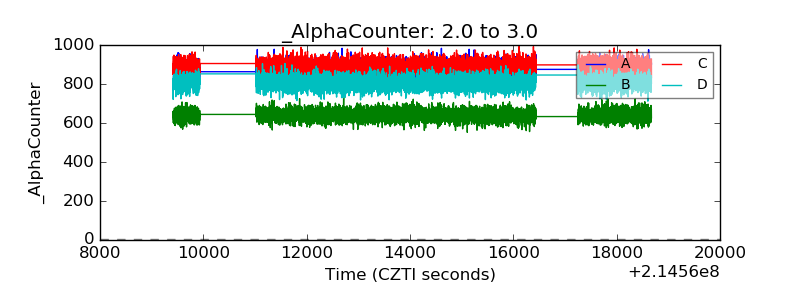 |
| _CPM_Rate | 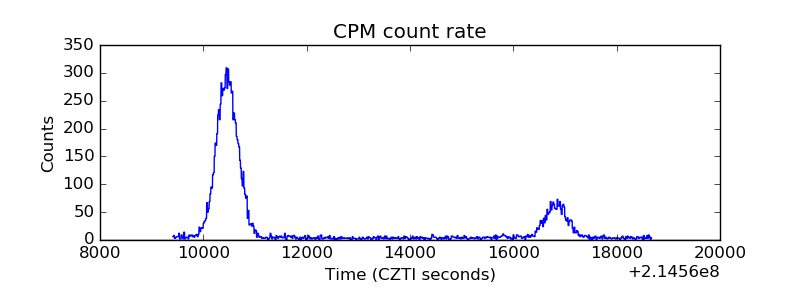 |
| CZT Counter | 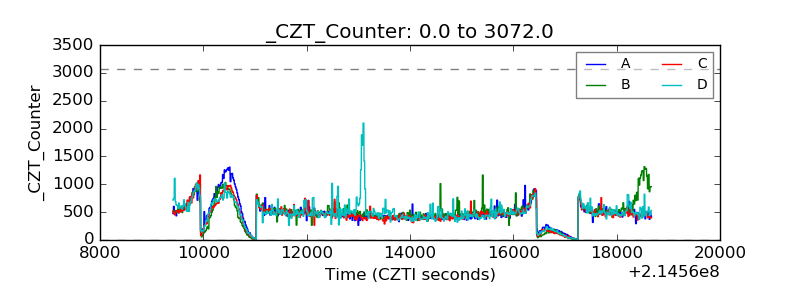 |
| +2.5 Volts monitor | 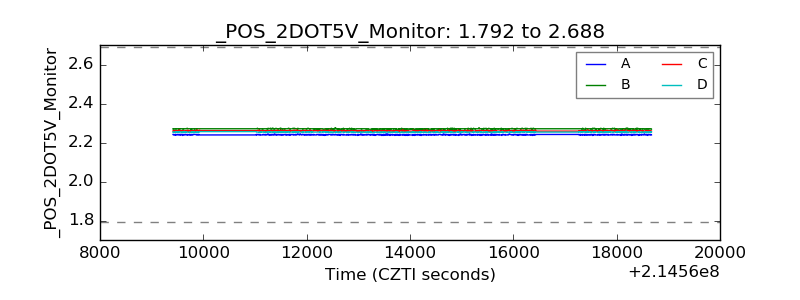 |
| +5 Volts monitor | 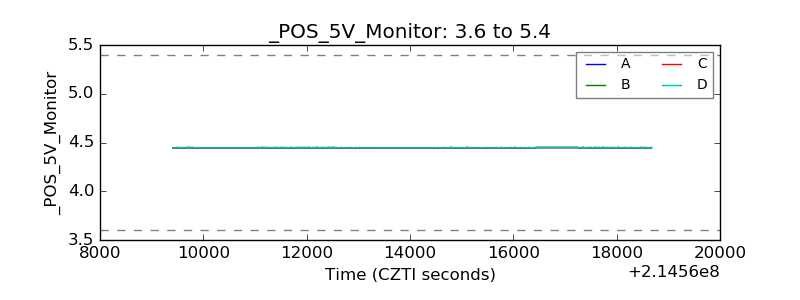 |
| _ROLL_ROT | 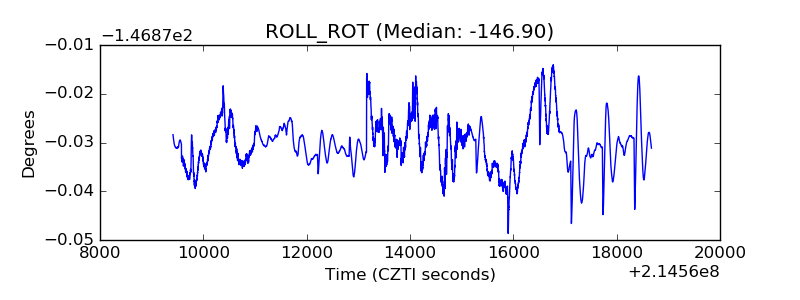 |
| _Roll_DEC | 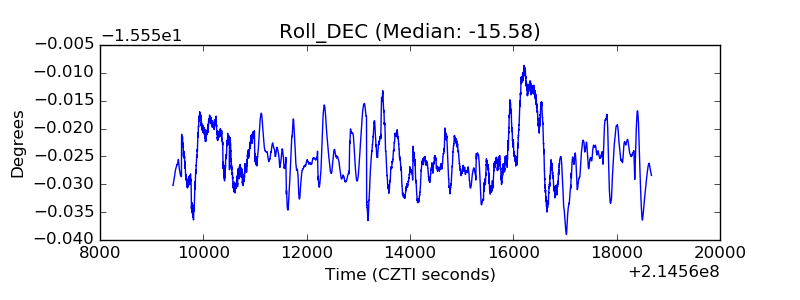 |
| _Roll_RA | 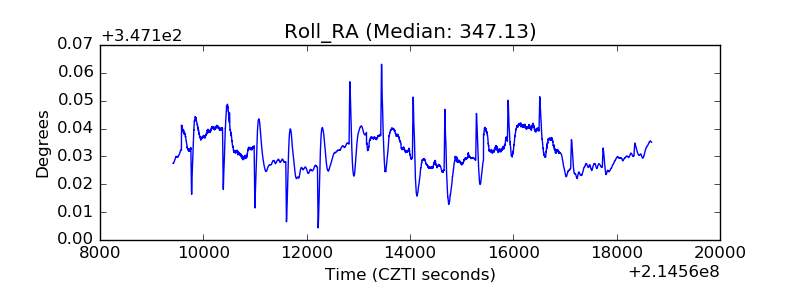 |
| Veto Counter | 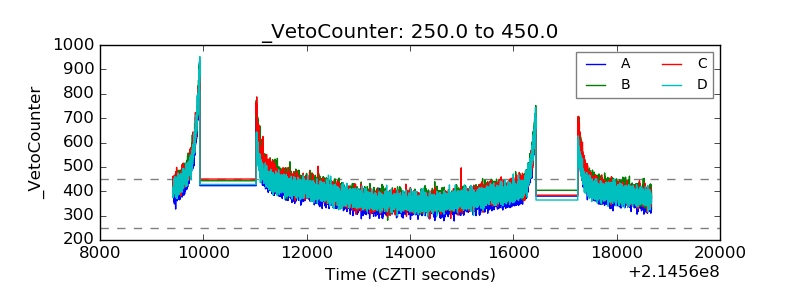 |