| Param | Original file | Final file |
|---|---|---|
| Filename | modeM0/AS1A02_150T01_9000000738_05735cztM0_level2.evt | modeM0/AS1A02_150T01_9000000738_05735cztM0_level2_quad_clean.evt |
| Size (bytes) | 278,447,040 | 45,630,720 |
| Size | 265.5 MB | 43.5 MB |
| Events in quadrant A | 1,899,698 | 272,688 |
| Events in quadrant B | 2,278,334 | 274,736 |
| Events in quadrant C | 1,867,150 | 276,377 |
| Events in quadrant D | 2,106,428 | 267,441 |
| Mode M0 | |||
|---|---|---|---|
| Quadrant | BADHDUFLAG | Total packets | Discarded packets |
| A | 0 | 8502 | 9 |
| B | 0 | 9476 | 5 |
| C | 0 | 8510 | 5 |
| D | 0 | 9068 | 11 |
| Mode M9 | |||
|---|---|---|---|
| Quadrant | BADHDUFLAG | Total packets | Discarded packets |
| A | 0 | 8 | 0 |
| B | 0 | 8 | 0 |
| C | 0 | 8 | 0 |
| D | 0 | 8 | 0 |
| Mode SS | |||
|---|---|---|---|
| Quadrant | BADHDUFLAG | Total packets | Discarded packets |
| A | 0 | 84 | 0 |
| B | 0 | 84 | 0 |
| C | 0 | 84 | 0 |
| D | 0 | 84 | 0 |
| Quadrant | Total seconds | Saturated seconds | Saturation percentage |
|---|---|---|---|
| A | 4114 | 83 | 2.017501% |
| B | 4116 | 112 | 2.721088% |
| C | 4116 | 46 | 1.117590% |
| D | 4113 | 55 | 1.337223% |
Noise dominated data is calculated using 1-second bins in cleaned event files. If a bin has >2000 counts, and if more than 50% of those come from <1% of pixels, then it is considered to be noise-dominated and hence unusable.
| Quadrant | # 1 sec bins | Bins with >0 counts | Bins with >2000 counts | High rate bins dominated by noise | Noise dominated (total time) | Noise dominated (detector-on time) | Marked lightcurve |
|---|---|---|---|---|---|---|---|
| A | 4928 | 4119 | 0 | 0 | 0.00% | 0.00% | 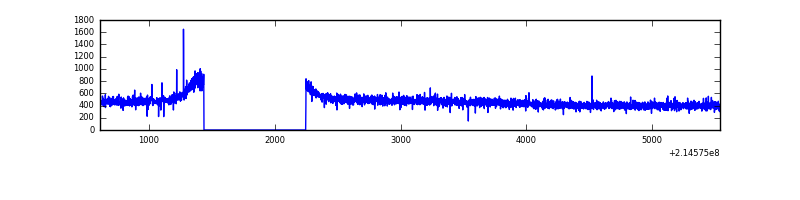 |
| B | 4928 | 4119 | 0 | 0 | 0.00% | 0.00% | 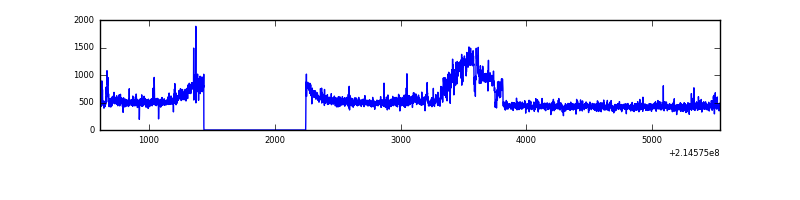 |
| C | 4928 | 4119 | 0 | 0 | 0.00% | 0.00% | 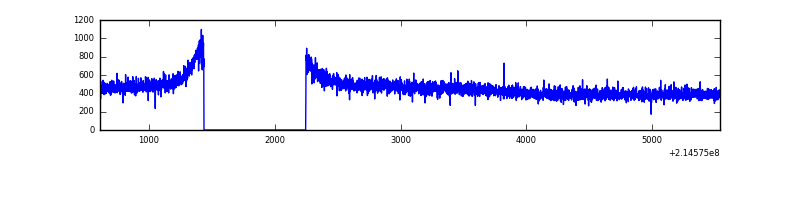 |
| D | 4928 | 4119 | 3 | 3 | 0.06% | 0.07% |  |
Top three noisy pixels from each quadrant. If the there are fewer than three noisy pixels in the level2.evt file, extra rows are filled as -1
| Pixel properties | Quadrant properties | ||||||
|---|---|---|---|---|---|---|---|
| Quadrant | DetID | PixID | Counts | Sigma | Mean | Median | Sigma |
| A | 12 | 194 | 4807 | 42.64 | 492 | 481 | 101.4 |
| A | 0 | 226 | 4750 | 42.08 | 492 | 481 | 101.4 |
| A | 14 | 31 | 3155 | 26.36 | 492 | 481 | 101.4 |
| B | 5 | 172 | 279052 | 2831.9 | 497 | 486 | 98.4 |
| B | 11 | 51 | 28591 | 285.72 | 497 | 486 | 98.4 |
| B | 15 | 204 | 23772 | 236.73 | 497 | 486 | 98.4 |
| C | 14 | 67 | 4649 | 37.14 | 477 | 479 | 112.3 |
| C | 13 | 61 | 3734 | 28.99 | 477 | 479 | 112.3 |
| C | 12 | 4 | 2258 | 15.84 | 477 | 479 | 112.3 |
| D | 1 | 20 | 139961 | 1157.88 | 482 | 466 | 120.5 |
| D | 4 | 95 | 58017 | 477.7 | 482 | 466 | 120.5 |
| D | 12 | 233 | 25861 | 210.79 | 482 | 466 | 120.5 |
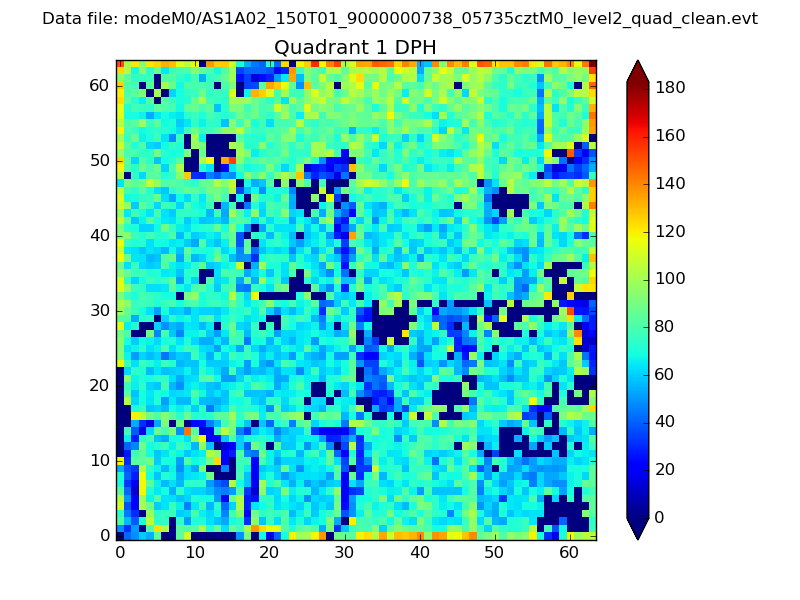
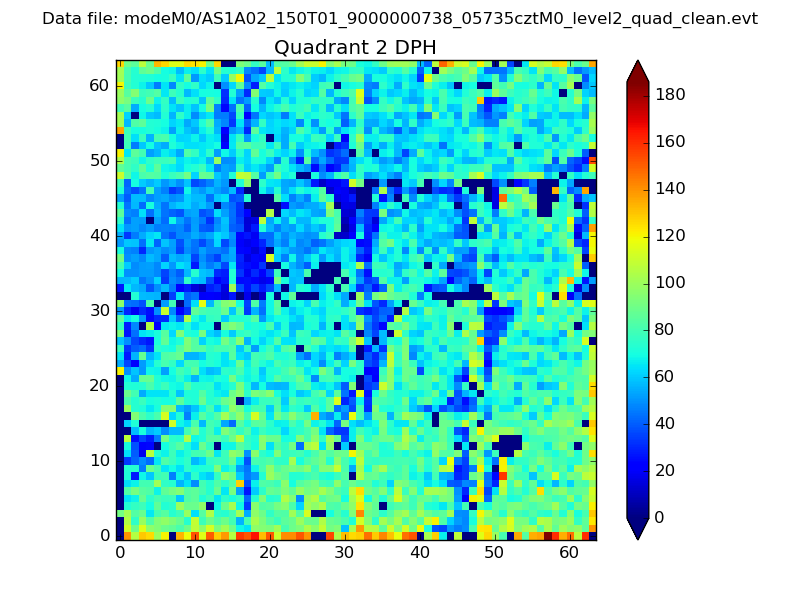
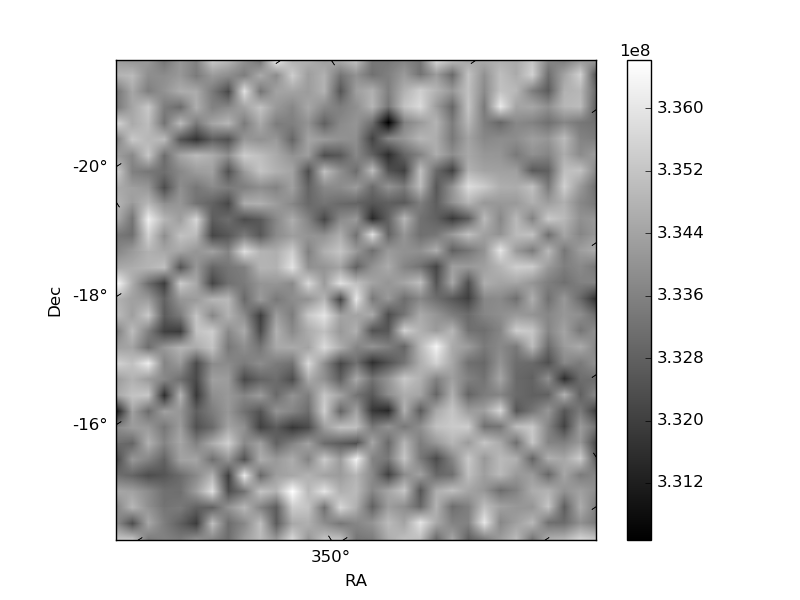
Histogram calculated using DETX and DETY for each event in the final _common_clean file
| Quadrant A | 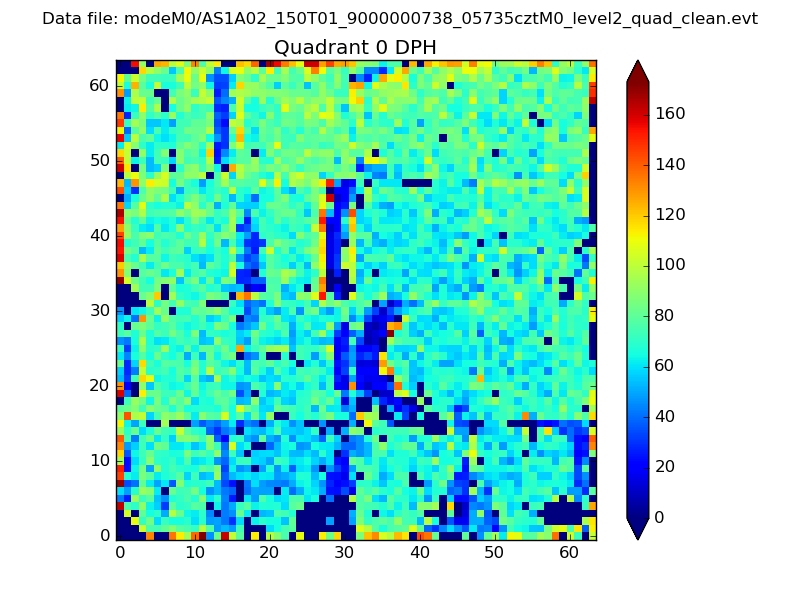 |
 |
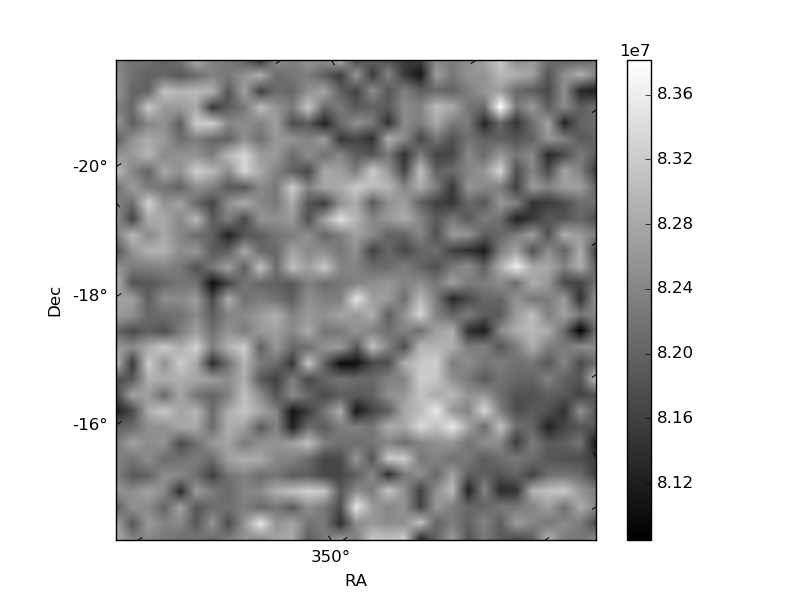
Quadrant B |
|---|---|---|---|
| Quadrant D | 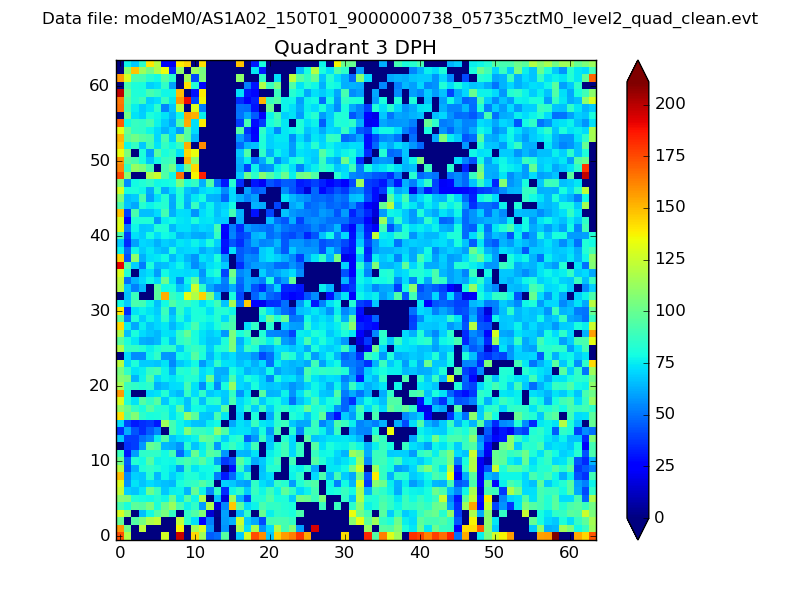 |
 |
Quadrant C |
| Plot type | Count rate plots | Images |
|---|---|---|
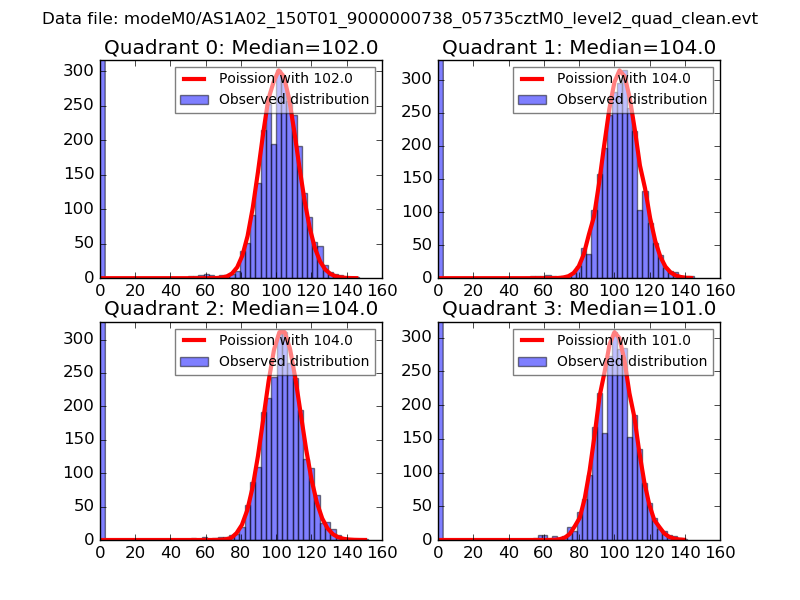
| Comparison with Poisson distribution Blue bars denote a histogram of data divided into 1 sec bins. Red curve is a Poisson curve with rate = median count rate of data. |
 |
 |
| Quadrant-wise count rates Data is divided into 100 sec bins |
 |
|
| Module-wise count rates for Quadrant A Data is divided into 100 sec bins |
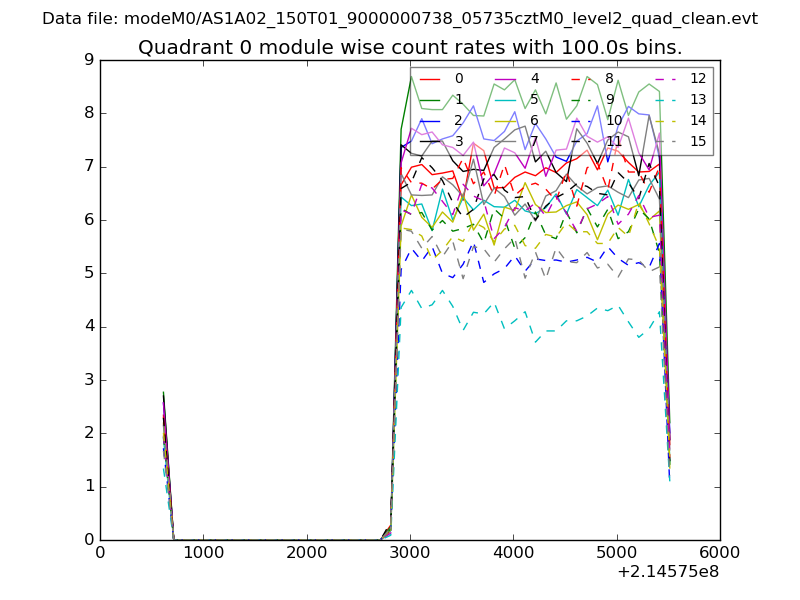 |
 |
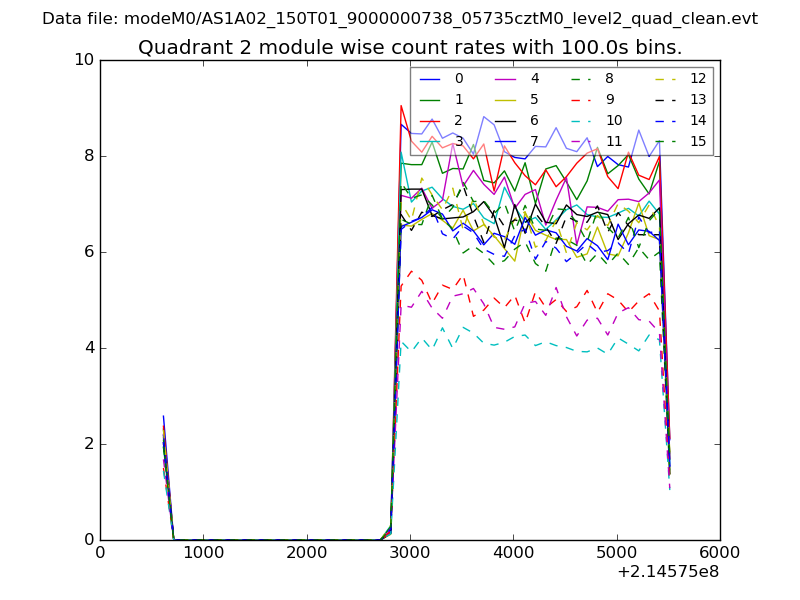
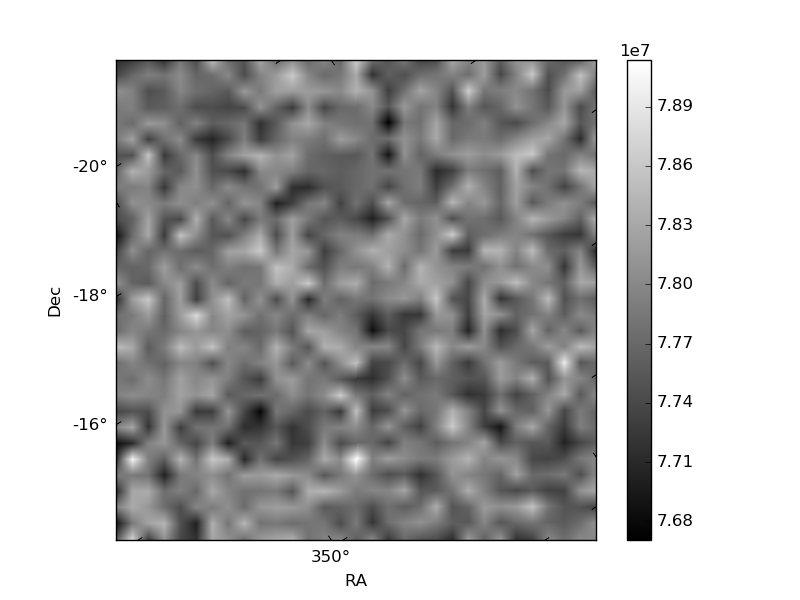
| Module-wise count rates for Quadrant B Data is divided into 100 sec bins |
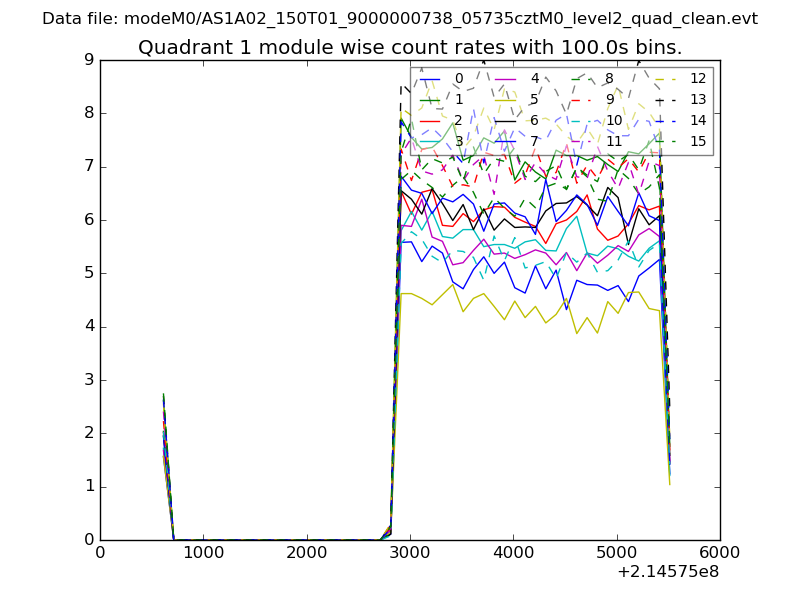 |
 |
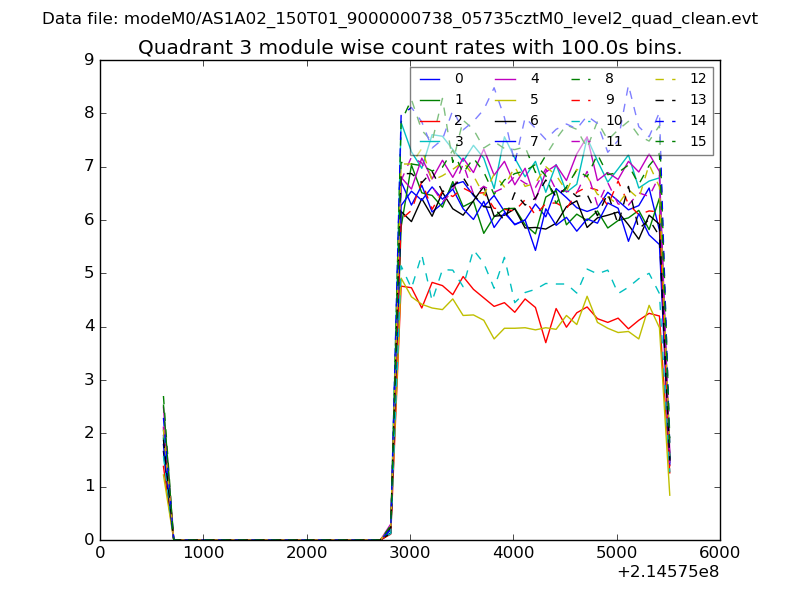
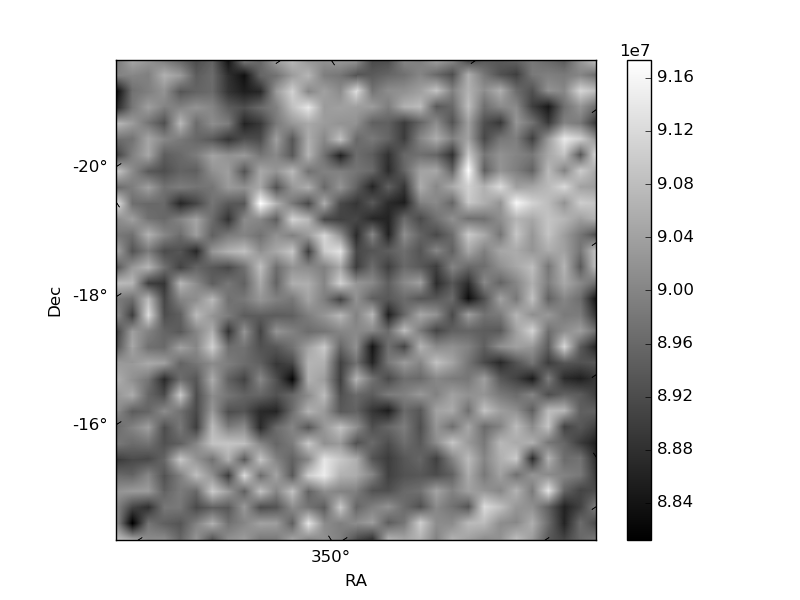
| Module-wise count rates for Quadrant C Data is divided into 100 sec bins |
 |
 |
| Module-wise count rates for Quadrant D Data is divided into 100 sec bins |
 |
 |
| Parameter | Plot |
|---|---|
| CZT HV Monitor | 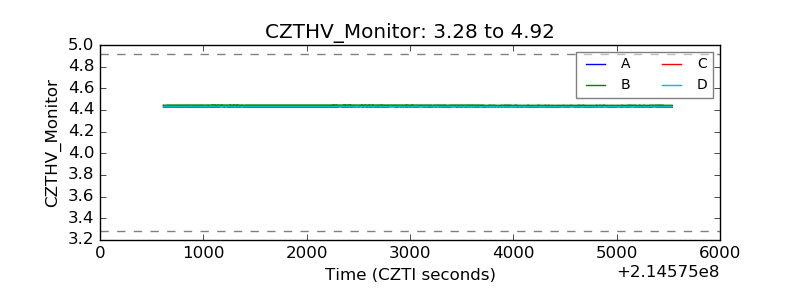 |
| D_VDD | 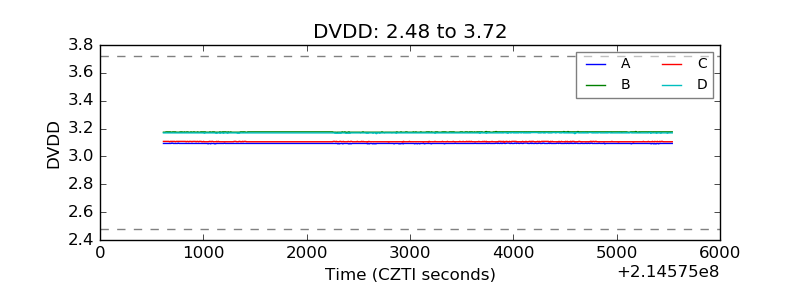 |
| Temperature 1 | 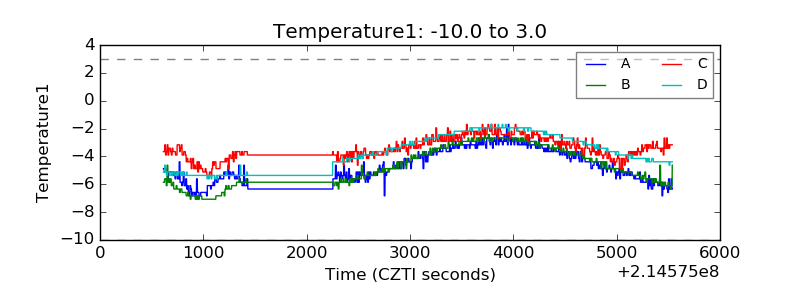 |
| Veto HV Monitor | 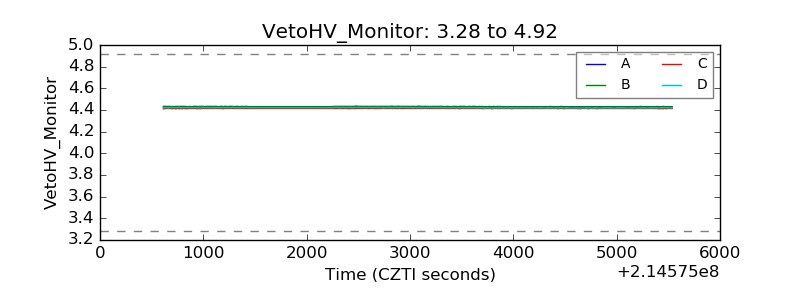 |
| Veto LLD | 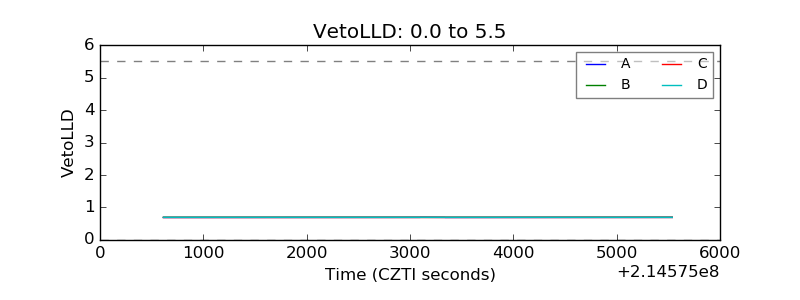 |
| Alpha Counter | 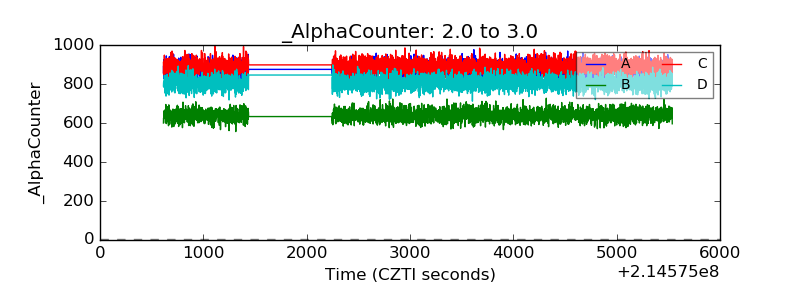 |
| _CPM_Rate | 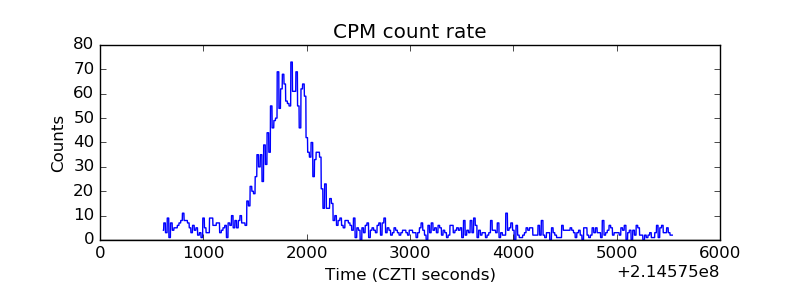 |
| CZT Counter | 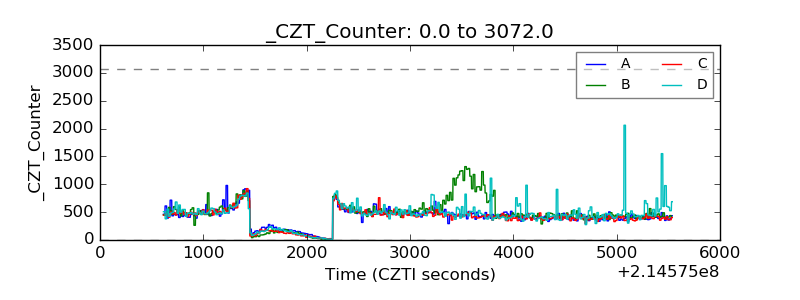 |
| +2.5 Volts monitor |  |
| +5 Volts monitor |  |
| _ROLL_ROT | 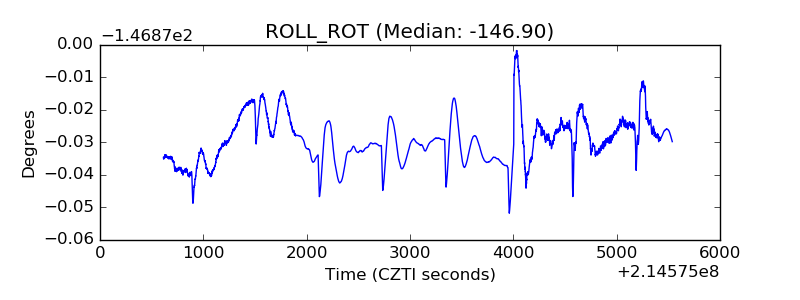 |
| _Roll_DEC | 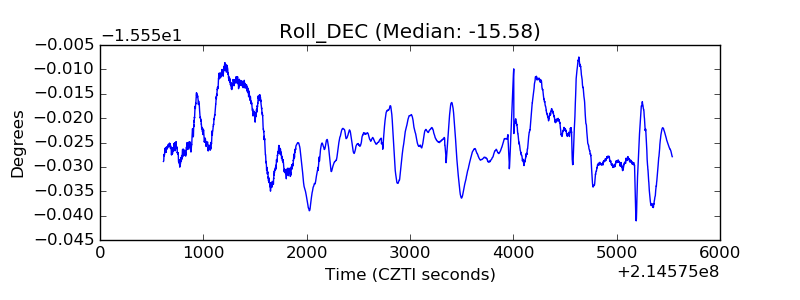 |
| _Roll_RA | 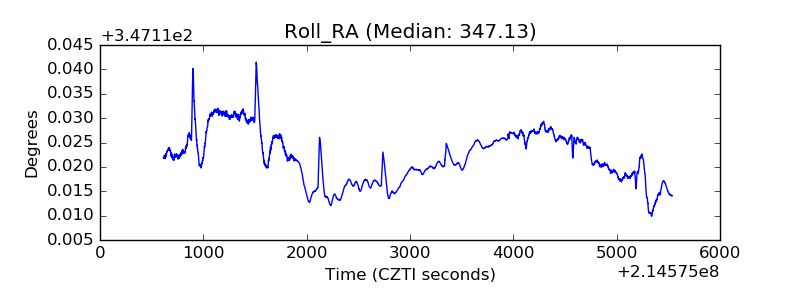 |
| Veto Counter | 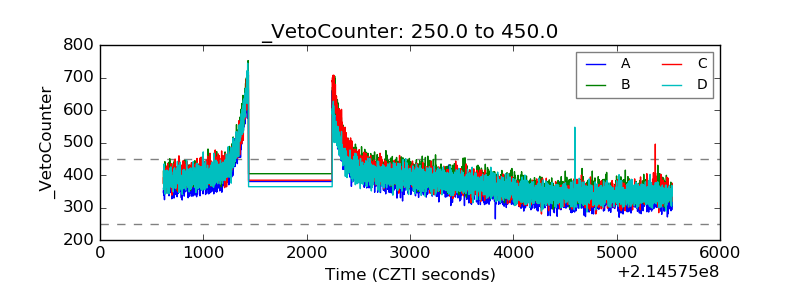 |