| Param | Original file | Final file |
|---|---|---|
| Filename | modeM0/AS1A02_149T01_9000000740cztM0_level2.fits | modeM0/AS1A02_149T01_9000000740cztM0_level2_quad_clean.evt |
| Size (bytes) | 1,364,227,200 | 1,333,123,200 |
| Size | 1.3 GB | 1.2 GB |
| Events in quadrant A | 8,240,782 | 7,841,733 |
| Events in quadrant B | 8,011,940 | 7,882,231 |
| Events in quadrant C | 8,137,680 | 7,699,413 |
| Events in quadrant D | 6,930,610 | 6,959,126 |
| Mode M9 | |||
|---|---|---|---|
| Quadrant | BADHDUFLAG | Total packets | Discarded packets |
| A | 0 | 214 | 0 |
| B | 0 | 214 | 0 |
| C | 0 | 214 | 0 |
| D | 0 | 214 | 0 |
| Mode SS | |||
|---|---|---|---|
| Quadrant | BADHDUFLAG | Total packets | Discarded packets |
| A | 0 | 2966 | 0 |
| B | 0 | 2968 | 0 |
| C | 0 | 2960 | 0 |
| D | 0 | 2962 | 0 |
| Mode M0 | |||
|---|---|---|---|
| Quadrant | BADHDUFLAG | Total packets | Discarded packets |
| A | 0 | 304891 | 0 |
| B | 0 | 314378 | 0 |
| C | 0 | 300767 | 0 |
| D | 0 | 324863 | 0 |
| Quadrant | Total seconds | Saturated seconds | Saturation percentage |
|---|---|---|---|
| A | 145874 | 2736 | 1.875591% |
| B | 145832 | 2608 | 1.788359% |
| C | 145883 | 1267 | 0.868504% |
| D | 145852 | 2763 | 1.894386% |
Noise dominated data is calculated using 1-second bins in cleaned event files. If a bin has >2000 counts, and if more than 50% of those come from <1% of pixels, then it is considered to be noise-dominated and hence unusable.
| Quadrant | # 1 sec bins | Bins with >0 counts | Bins with >2000 counts | High rate bins dominated by noise | Noise dominated (total time) | Noise dominated (detector-on time) | Marked lightcurve |
|---|---|---|---|---|---|---|---|
| A | 167591 | 146222 | 0 | 0 | 0.00% | 0.00% |  |
| B | 167591 | 146211 | 0 | 0 | 0.00% | 0.00% |  |
| C | 167591 | 146216 | 0 | 0 | 0.00% | 0.00% |  |
| D | 167591 | 146180 | 0 | 0 | 0.00% | 0.00% |  |
Top three noisy pixels from each quadrant. If the there are fewer than three noisy pixels in the level2.evt file, extra rows are filled as -1
| Pixel properties | Quadrant properties | ||||||
|---|---|---|---|---|---|---|---|
| Quadrant | DetID | PixID | Counts | Sigma | Mean | Median | Sigma |
| A | 0 | 29 | 7972 | 11.0 | 2145 | 1998 | 543.2 |
| A | 7 | 110 | 6979 | 9.17 | 2145 | 1998 | 543.2 |
| A | 0 | 30 | 6171 | 7.68 | 2145 | 1998 | 543.2 |
| B | 2 | 9 | 6767 | 11.13 | 2113 | 2002 | 428.3 |
| B | 12 | 226 | 5680 | 8.59 | 2113 | 2002 | 428.3 |
| B | 5 | 128 | 5393 | 7.92 | 2113 | 2002 | 428.3 |
| C | 1 | 80 | 5793 | 6.73 | 2148 | 1982 | 566.7 |
| C | 1 | 81 | 5595 | 6.38 | 2148 | 1982 | 566.7 |
| C | 12 | 241 | 5594 | 6.37 | 2148 | 1982 | 566.7 |
| D | 3 | 14 | 5196 | 6.41 | 1984 | 1797 | 529.8 |
| D | 6 | 231 | 5130 | 6.29 | 1984 | 1797 | 529.8 |
| D | 7 | 5 | 5078 | 6.19 | 1984 | 1797 | 529.8 |
Histogram calculated using DETX and DETY for each event in the final _common_clean file
| Quadrant A | 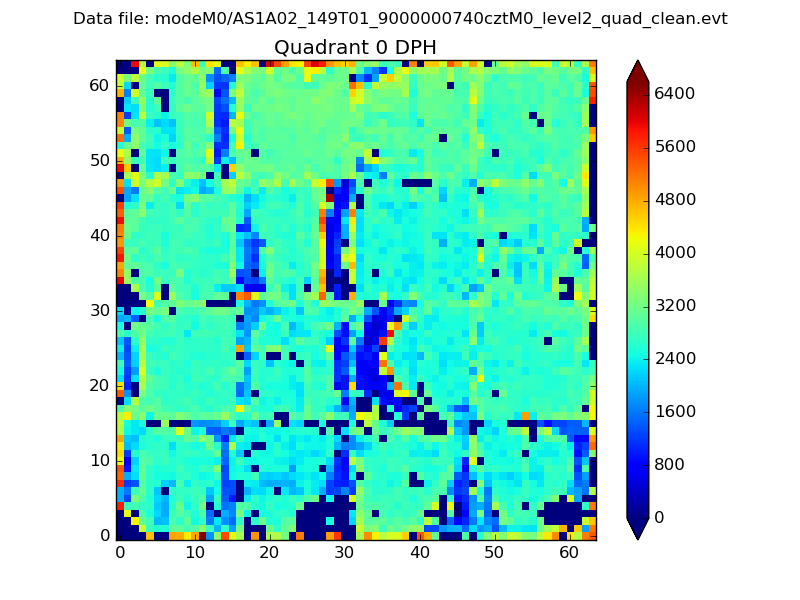 |
 |
Quadrant B |
|---|---|---|---|
| Quadrant D |  |
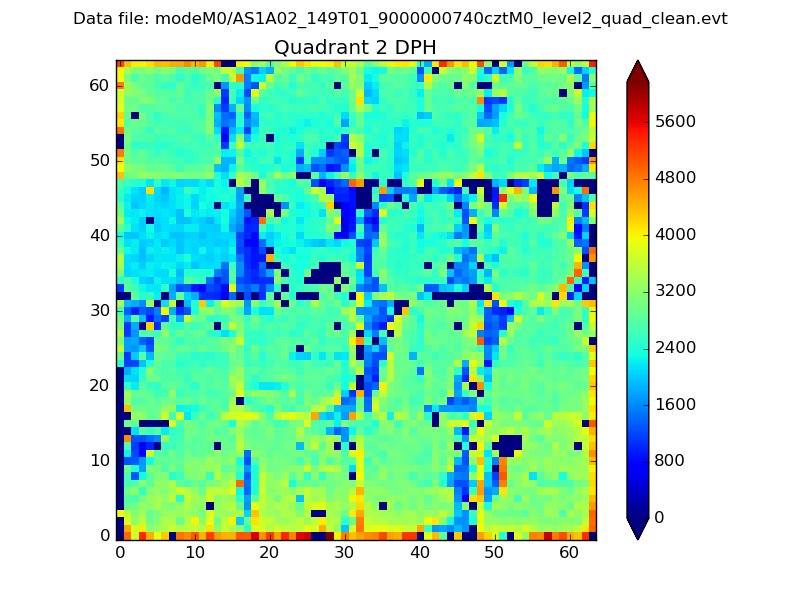 |
Quadrant C |
| Plot type | Count rate plots | Images |
|---|---|---|
| Comparison with Poisson distribution Blue bars denote a histogram of data divided into 1 sec bins. Red curve is a Poisson curve with rate = median count rate of data. |
 |
 |
| Quadrant-wise count rates Data is divided into 100 sec bins |
 |
|
| Module-wise count rates for Quadrant A Data is divided into 100 sec bins |
 |
 |
| Module-wise count rates for Quadrant B Data is divided into 100 sec bins |
 |
 |
| Module-wise count rates for Quadrant C Data is divided into 100 sec bins |
 |
 |
| Module-wise count rates for Quadrant D Data is divided into 100 sec bins |
 |
 |
| Parameter | Plot |
|---|---|
| CZT HV Monitor |  |
| D_VDD |  |
| Temperature 1 |  |
| Veto HV Monitor |  |
| Veto LLD |  |
| Alpha Counter |  |
| _CPM_Rate |  |
| CZT Counter |  |
| +2.5 Volts monitor |  |
| +5 Volts monitor |  |
| _ROLL_ROT |  |
| _Roll_DEC |  |
| _Roll_RA |  |
| Veto Counter |  |