| Param | Original file | Final file |
|---|---|---|
| Filename | modeM0/AS1A02_149T01_9000000740_05740cztM0_level2.evt | modeM0/AS1A02_149T01_9000000740_05740cztM0_level2_quad_clean.evt |
| Size (bytes) | 1,217,393,280 | 199,926,720 |
| Size | 1.1 GB | 190.7 MB |
| Events in quadrant A | 8,330,392 | 1,196,381 |
| Events in quadrant B | 9,438,655 | 1,199,100 |
| Events in quadrant C | 8,217,141 | 1,221,173 |
| Events in quadrant D | 9,625,537 | 1,157,642 |
| Mode M9 | |||
|---|---|---|---|
| Quadrant | BADHDUFLAG | Total packets | Discarded packets |
| A | 0 | 20 | 0 |
| B | 0 | 20 | 0 |
| C | 0 | 20 | 0 |
| D | 0 | 20 | 0 |
| Mode SS | |||
|---|---|---|---|
| Quadrant | BADHDUFLAG | Total packets | Discarded packets |
| A | 0 | 378 | 2 |
| B | 0 | 378 | 0 |
| C | 0 | 378 | 2 |
| D | 0 | 378 | 0 |
| Mode M0 | |||
|---|---|---|---|
| Quadrant | BADHDUFLAG | Total packets | Discarded packets |
| A | 0 | 38194 | 57 |
| B | 0 | 40390 | 53 |
| C | 0 | 37818 | 39 |
| D | 0 | 41562 | 73 |
| Quadrant | Total seconds | Saturated seconds | Saturation percentage |
|---|---|---|---|
| A | 18584 | 96 | 0.516573% |
| B | 18586 | 146 | 0.785538% |
| C | 18591 | 48 | 0.258189% |
| D | 18581 | 128 | 0.688876% |
Noise dominated data is calculated using 1-second bins in cleaned event files. If a bin has >2000 counts, and if more than 50% of those come from <1% of pixels, then it is considered to be noise-dominated and hence unusable.
| Quadrant | # 1 sec bins | Bins with >0 counts | Bins with >2000 counts | High rate bins dominated by noise | Noise dominated (total time) | Noise dominated (detector-on time) | Marked lightcurve |
|---|---|---|---|---|---|---|---|
| A | 20524 | 18612 | 18 | 18 | 0.09% | 0.10% | 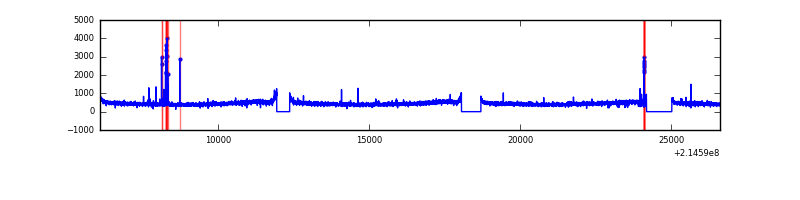 |
| B | 20524 | 18611 | 21 | 21 | 0.10% | 0.11% | 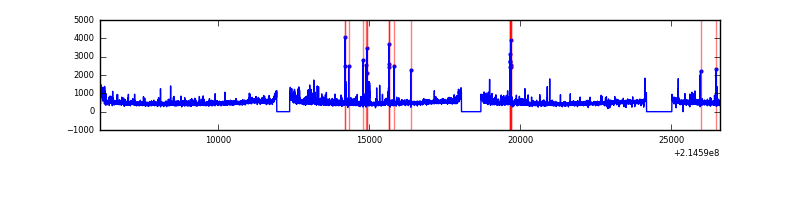 |
| C | 20524 | 18612 | 0 | 0 | 0.00% | 0.00% | 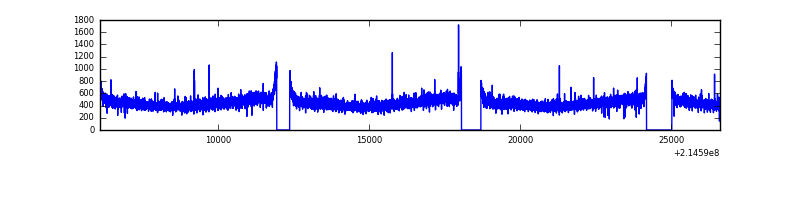 |
| D | 20524 | 18612 | 80 | 80 | 0.39% | 0.43% | 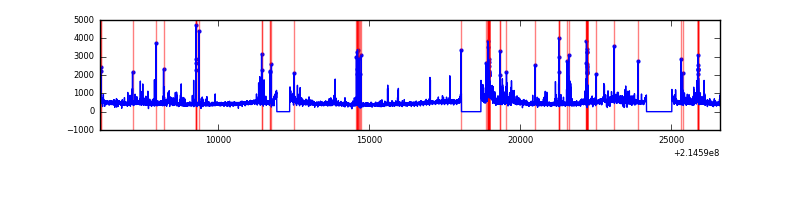 |
Top three noisy pixels from each quadrant. If the there are fewer than three noisy pixels in the level2.evt file, extra rows are filled as -1
| Pixel properties | Quadrant properties | ||||||
|---|---|---|---|---|---|---|---|
| Quadrant | DetID | PixID | Counts | Sigma | Mean | Median | Sigma |
| A | 7 | 16 | 69463 | 154.01 | 2133 | 2082 | 437.5 |
| A | 15 | 236 | 23951 | 49.98 | 2133 | 2082 | 437.5 |
| A | 12 | 194 | 21051 | 43.36 | 2133 | 2082 | 437.5 |
| B | 15 | 204 | 538290 | 1296.78 | 2155 | 2102 | 413.5 |
| B | 11 | 51 | 183545 | 438.82 | 2155 | 2102 | 413.5 |
| B | 4 | 81 | 119540 | 284.03 | 2155 | 2102 | 413.5 |
| C | 14 | 67 | 20410 | 37.54 | 2092 | 2105 | 487.6 |
| C | 8 | 222 | 18118 | 32.84 | 2092 | 2105 | 487.6 |
| C | 13 | 61 | 16720 | 29.97 | 2092 | 2105 | 487.6 |
| D | 0 | 11 | 327423 | 637.85 | 2079 | 2012 | 510.2 |
| D | 1 | 20 | 290376 | 565.23 | 2079 | 2012 | 510.2 |
| D | 2 | 63 | 245564 | 477.39 | 2079 | 2012 | 510.2 |
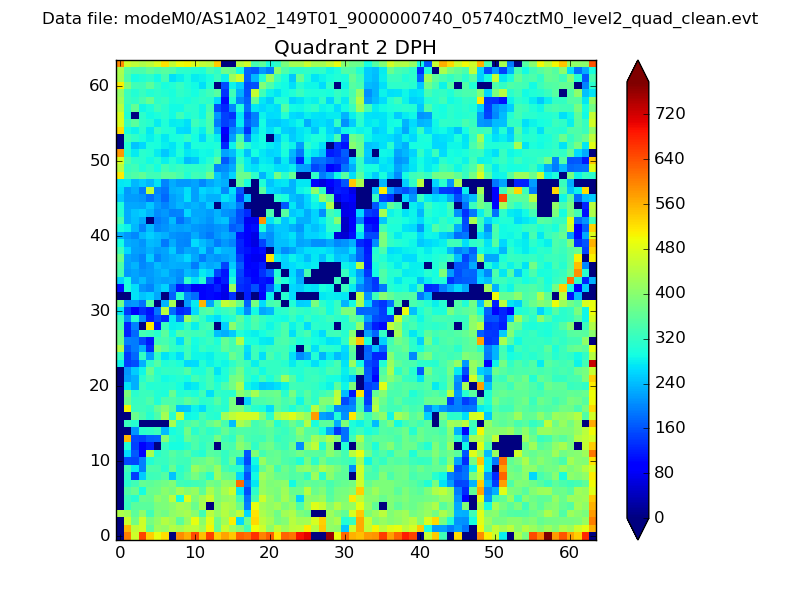
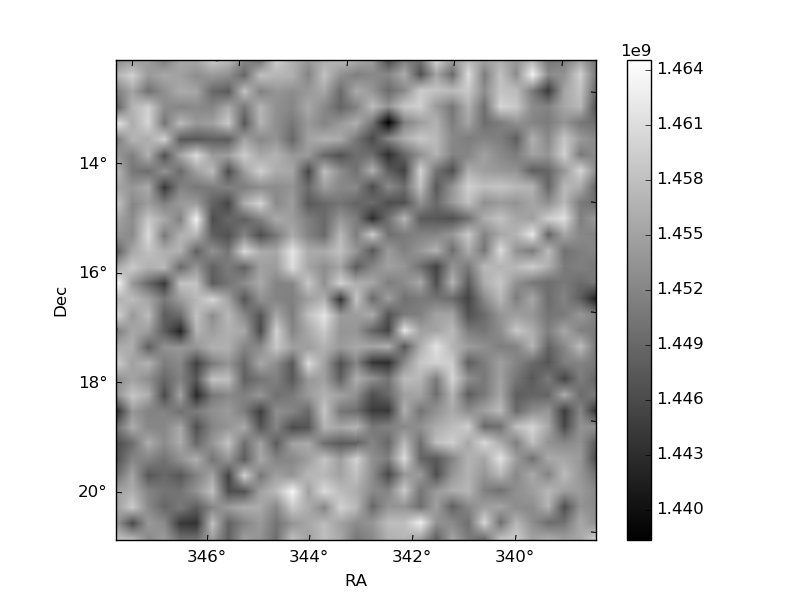
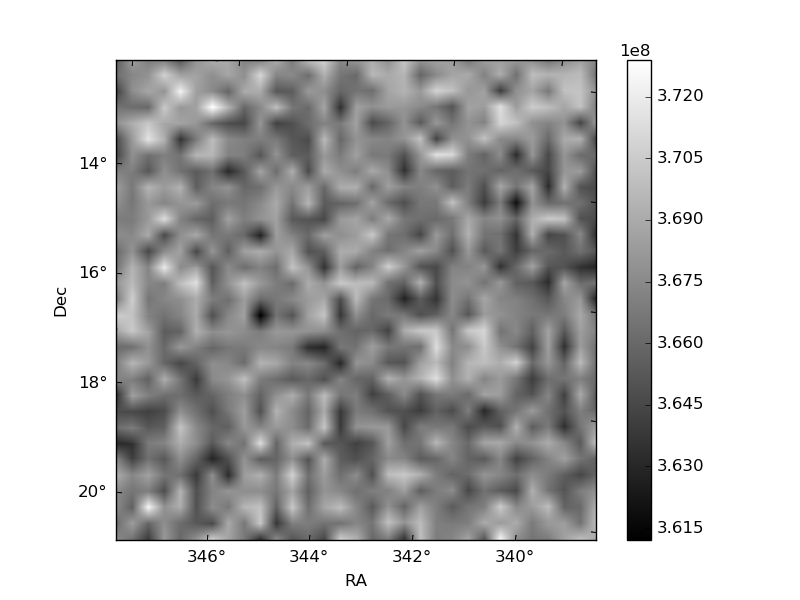
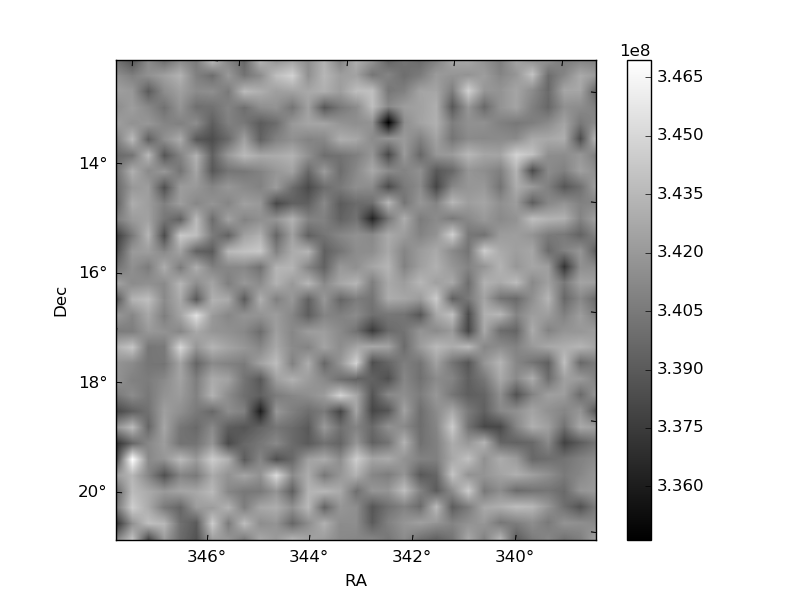
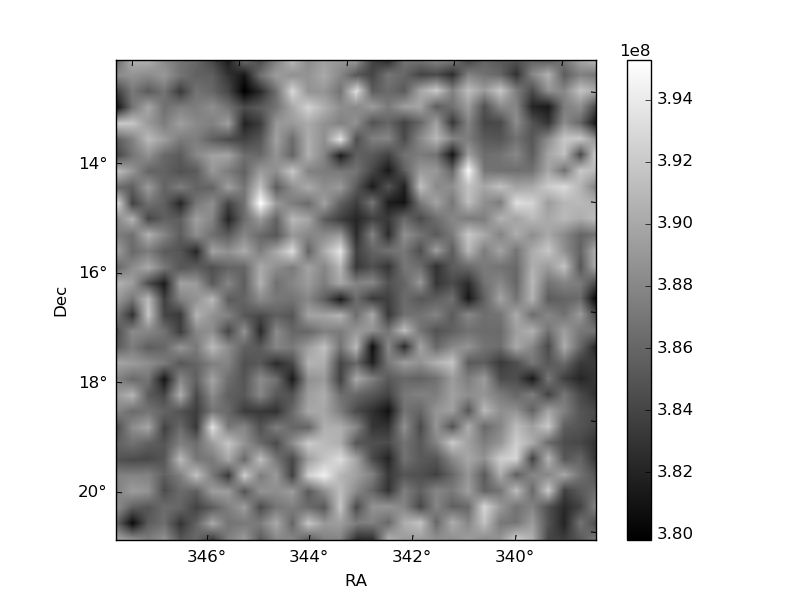
Histogram calculated using DETX and DETY for each event in the final _common_clean file
| Quadrant A | 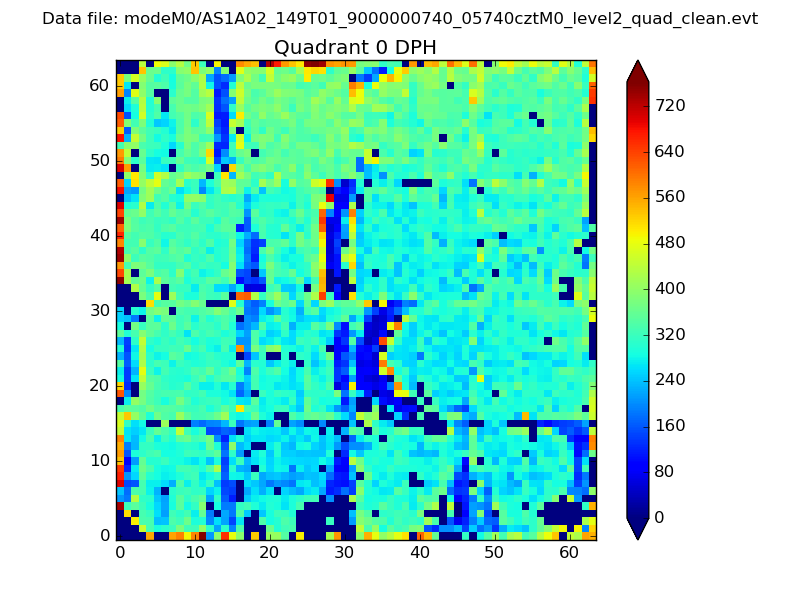 |
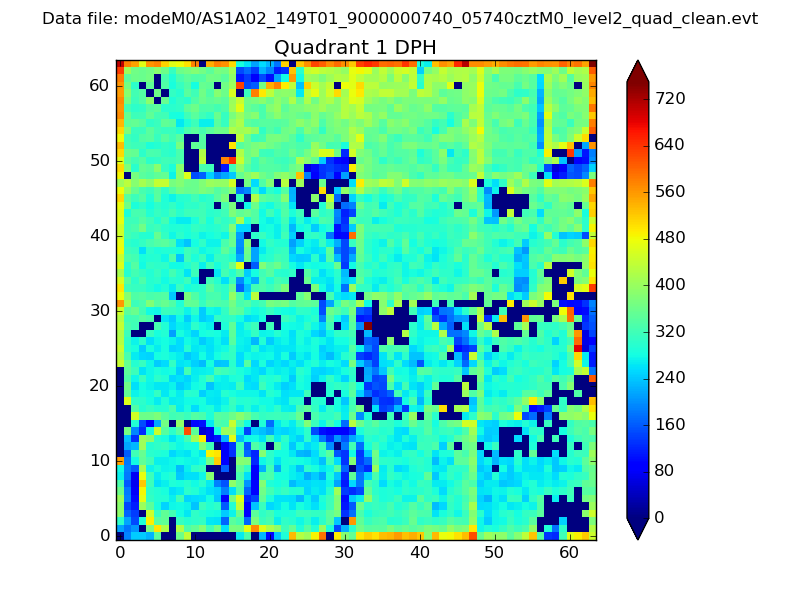 |
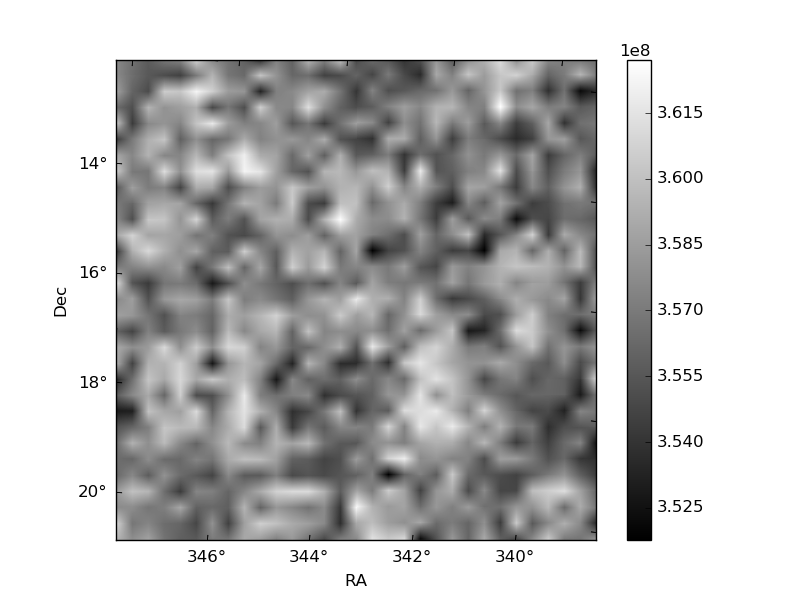
Quadrant B |
|---|---|---|---|
| Quadrant D | 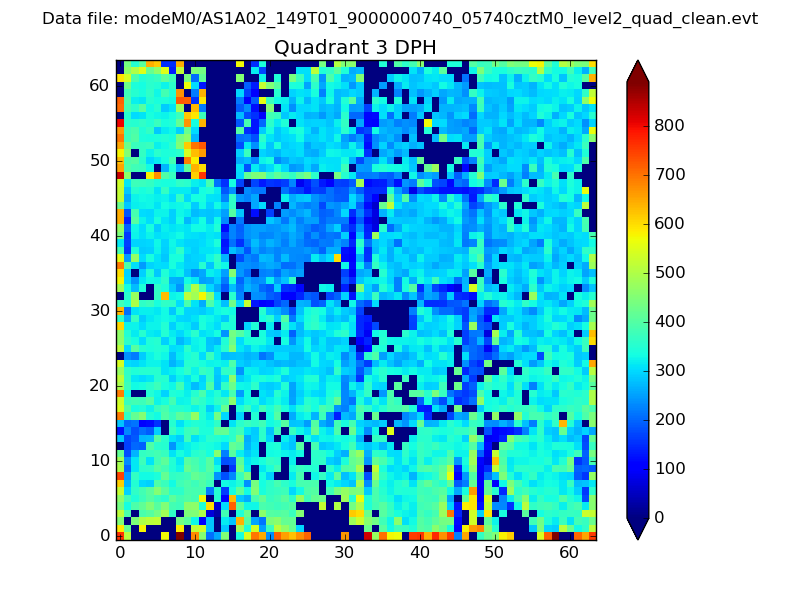 |
 |
Quadrant C |
| Plot type | Count rate plots | Images |
|---|---|---|
| Comparison with Poisson distribution Blue bars denote a histogram of data divided into 1 sec bins. Red curve is a Poisson curve with rate = median count rate of data. |
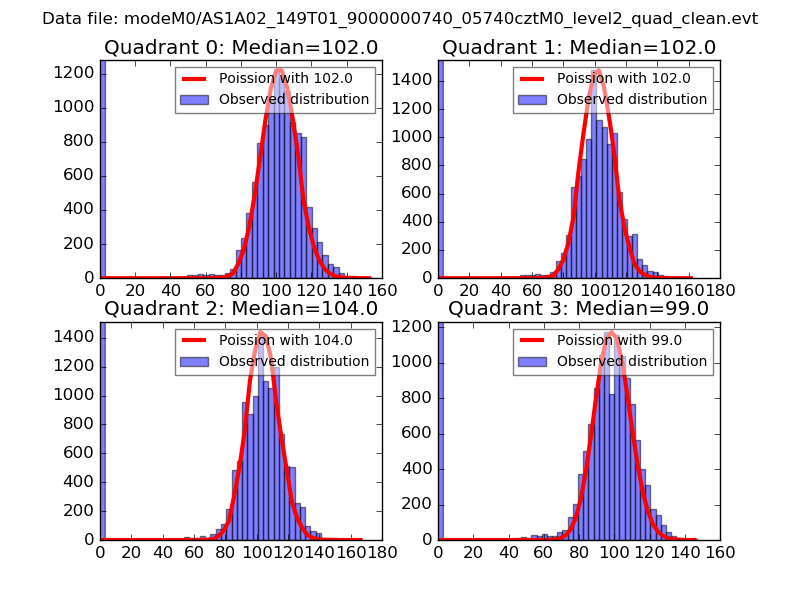 |
 |
| Quadrant-wise count rates Data is divided into 100 sec bins |
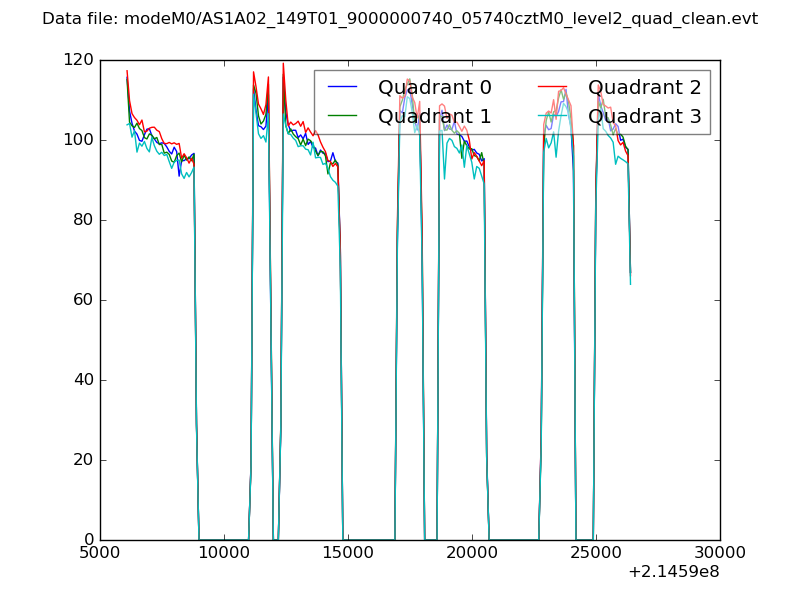 |
|
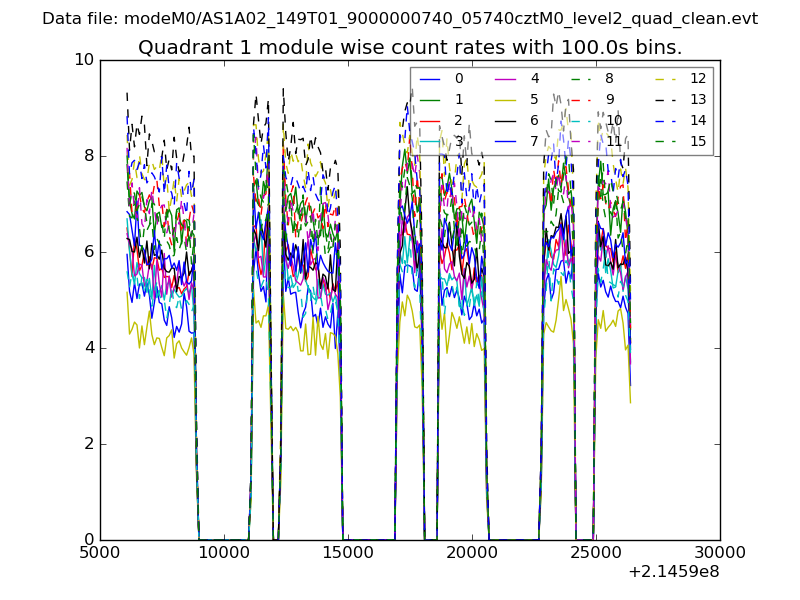
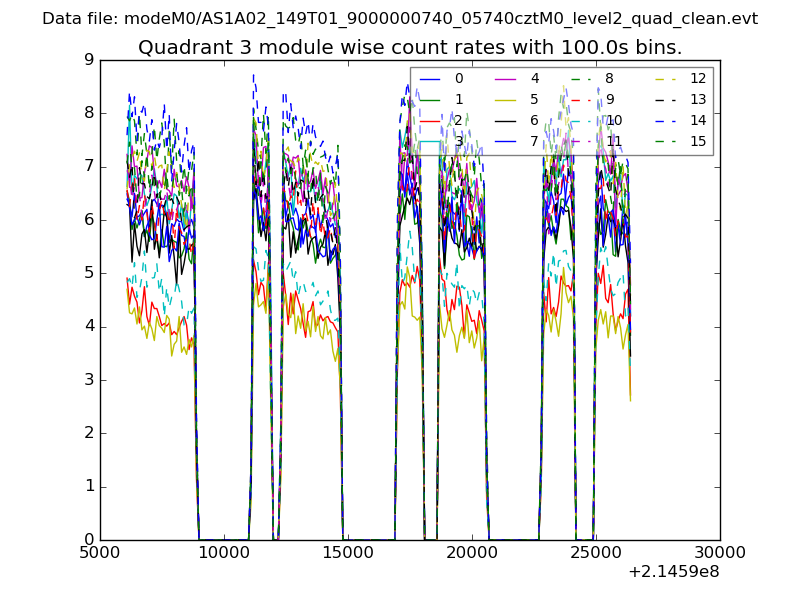
| Module-wise count rates for Quadrant A Data is divided into 100 sec bins |
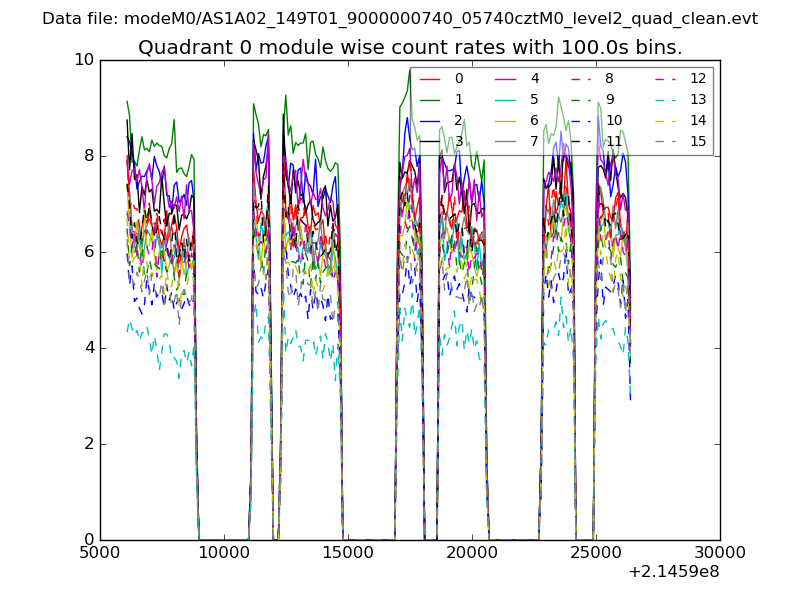 |
 |
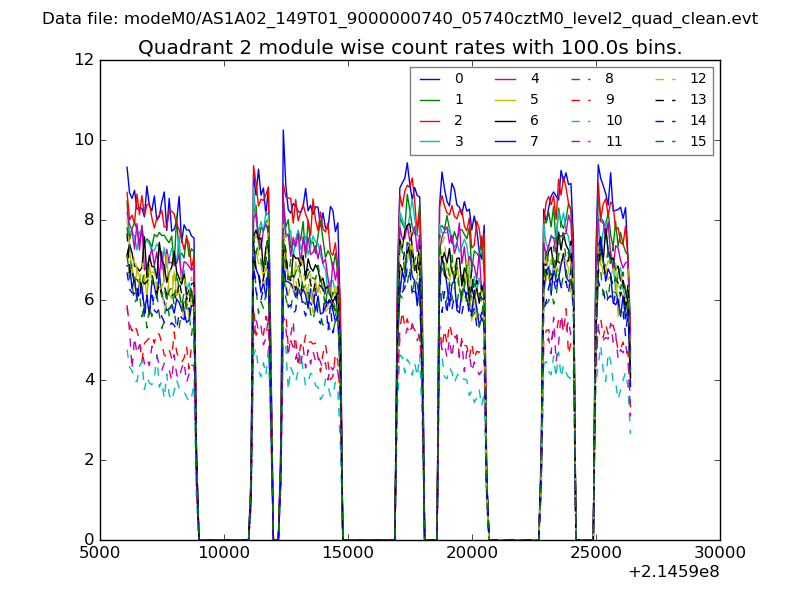
| Module-wise count rates for Quadrant B Data is divided into 100 sec bins |
 |
 |
| Module-wise count rates for Quadrant C Data is divided into 100 sec bins |
 |
 |
| Module-wise count rates for Quadrant D Data is divided into 100 sec bins |
 |
 |
| Parameter | Plot |
|---|---|
| CZT HV Monitor | 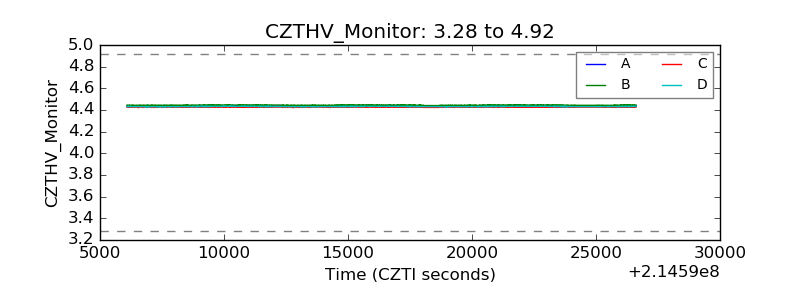 |
| D_VDD | 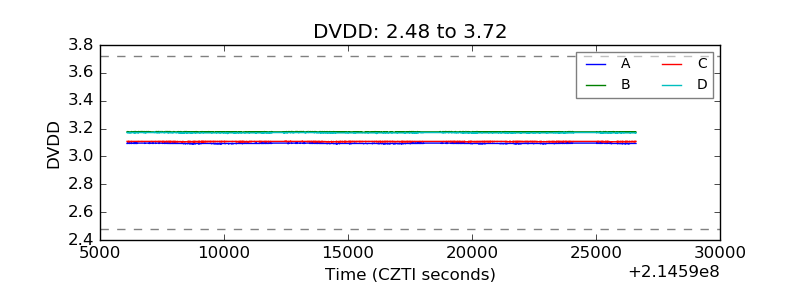 |
| Temperature 1 | 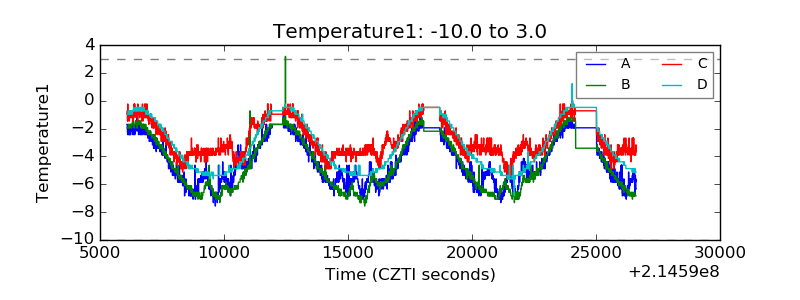 |
| Veto HV Monitor | 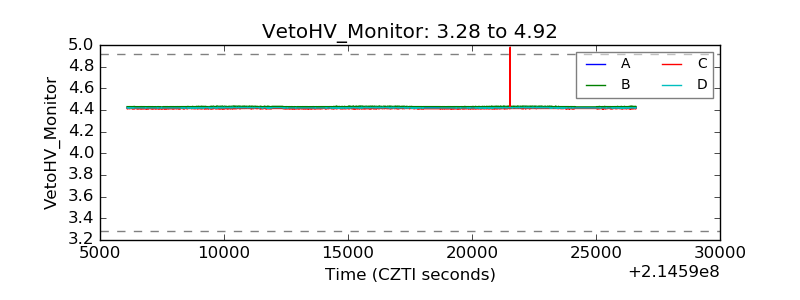 |
| Veto LLD | 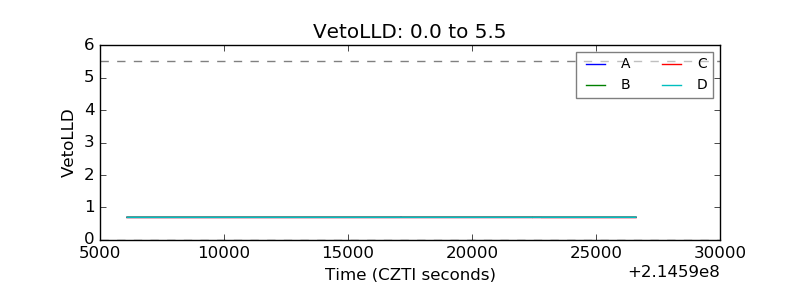 |
| Alpha Counter | 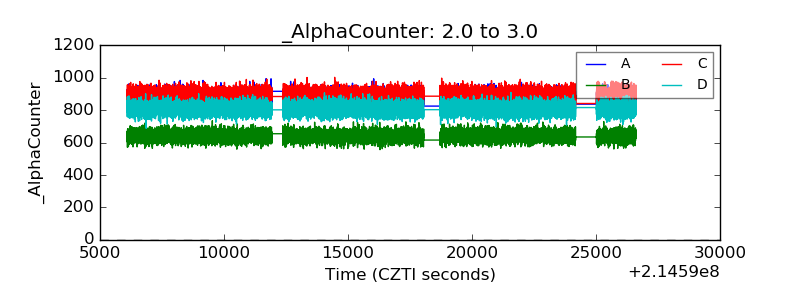 |
| _CPM_Rate | 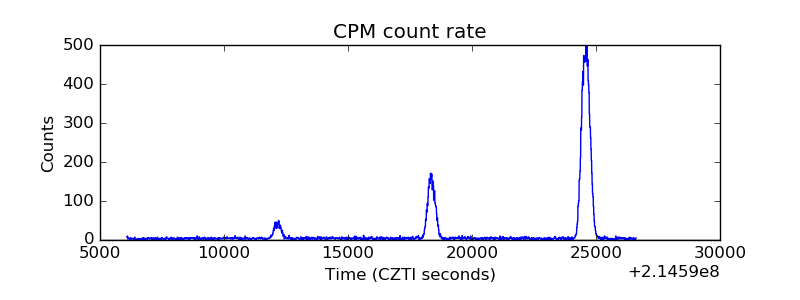 |
| CZT Counter | 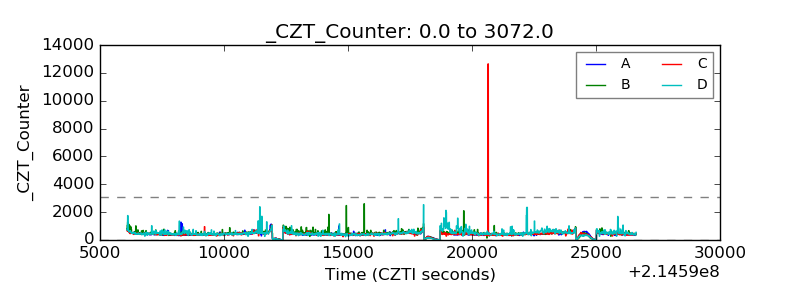 |
| +2.5 Volts monitor | 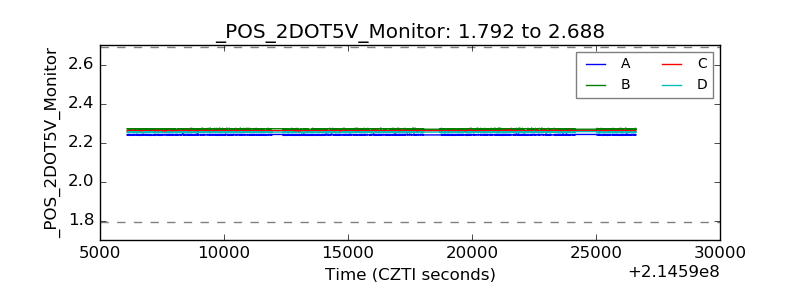 |
| +5 Volts monitor |  |
| _ROLL_ROT | 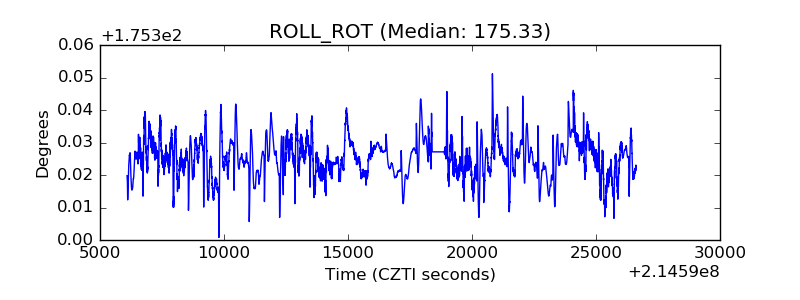 |
| _Roll_DEC | 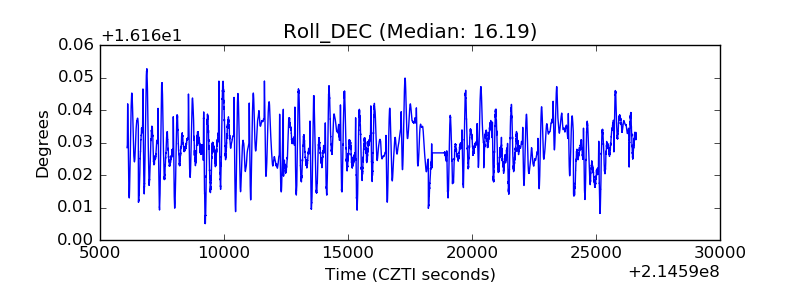 |
| _Roll_RA | 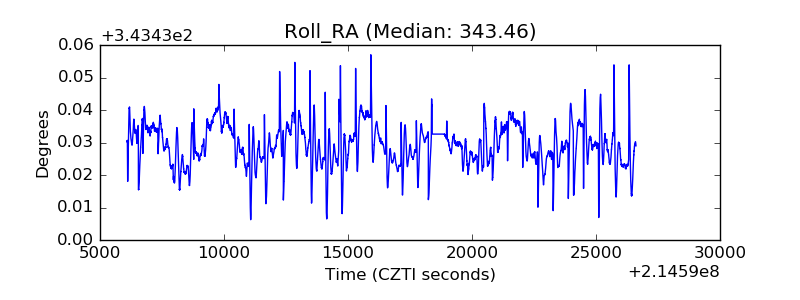 |
| Veto Counter | 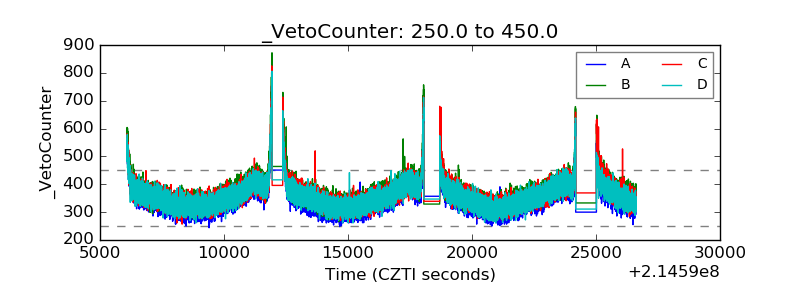 |