| Param | Original file | Final file |
|---|---|---|
| Filename | modeM0/AS1A02_149T01_9000000740_05741cztM0_level2.evt | modeM0/AS1A02_149T01_9000000740_05741cztM0_level2_quad_clean.evt |
| Size (bytes) | 518,186,880 | 77,696,640 |
| Size | 494.2 MB | 74.1 MB |
| Events in quadrant A | 3,325,095 | 469,864 |
| Events in quadrant B | 3,666,123 | 475,466 |
| Events in quadrant C | 3,192,305 | 477,904 |
| Events in quadrant D | 5,026,862 | 433,869 |
| Mode M9 | |||
|---|---|---|---|
| Quadrant | BADHDUFLAG | Total packets | Discarded packets |
| A | 0 | 19 | 0 |
| B | 0 | 19 | 0 |
| C | 0 | 19 | 0 |
| D | 0 | 19 | 0 |
| Mode SS | |||
|---|---|---|---|
| Quadrant | BADHDUFLAG | Total packets | Discarded packets |
| A | 0 | 144 | 0 |
| B | 0 | 144 | 0 |
| C | 0 | 144 | 0 |
| D | 0 | 144 | 2 |
| Mode M0 | |||
|---|---|---|---|
| Quadrant | BADHDUFLAG | Total packets | Discarded packets |
| A | 0 | 14873 | 7 |
| B | 0 | 15498 | 8 |
| C | 0 | 14461 | 8 |
| D | 0 | 19818 | 2 |
| Quadrant | Total seconds | Saturated seconds | Saturation percentage |
|---|---|---|---|
| A | 7125 | 62 | 0.870175% |
| B | 7124 | 48 | 0.673779% |
| C | 7124 | 16 | 0.224593% |
| D | 7127 | 462 | 6.482391% |
Noise dominated data is calculated using 1-second bins in cleaned event files. If a bin has >2000 counts, and if more than 50% of those come from <1% of pixels, then it is considered to be noise-dominated and hence unusable.
| Quadrant | # 1 sec bins | Bins with >0 counts | Bins with >2000 counts | High rate bins dominated by noise | Noise dominated (total time) | Noise dominated (detector-on time) | Marked lightcurve |
|---|---|---|---|---|---|---|---|
| A | 8972 | 7129 | 34 | 34 | 0.38% | 0.48% | 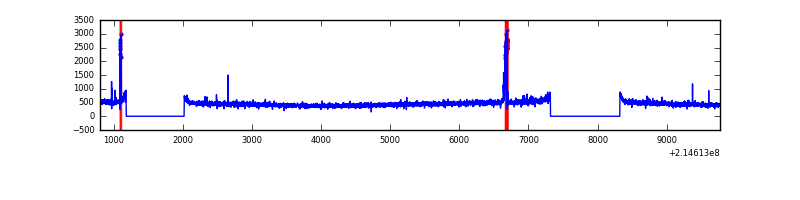 |
| B | 8972 | 7129 | 6 | 6 | 0.07% | 0.08% | 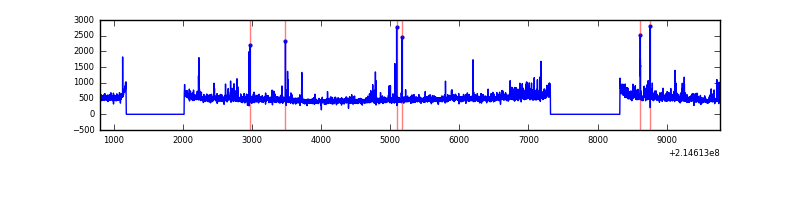 |
| C | 8972 | 7129 | 0 | 0 | 0.00% | 0.00% | 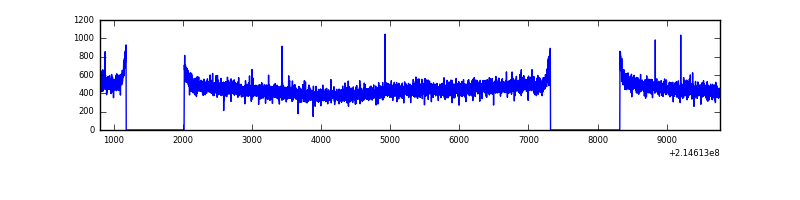 |
| D | 8972 | 7129 | 341 | 341 | 3.80% | 4.78% | 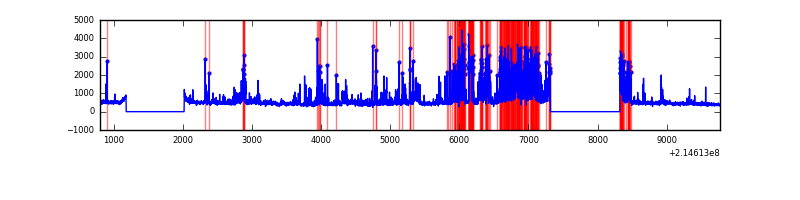 |
Top three noisy pixels from each quadrant. If the there are fewer than three noisy pixels in the level2.evt file, extra rows are filled as -1
| Pixel properties | Quadrant properties | ||||||
|---|---|---|---|---|---|---|---|
| Quadrant | DetID | PixID | Counts | Sigma | Mean | Median | Sigma |
| A | 0 | 50 | 93304 | 543.2 | 828 | 809 | 170.3 |
| A | 15 | 236 | 36373 | 208.86 | 828 | 809 | 170.3 |
| A | 0 | 31 | 11139 | 60.66 | 828 | 809 | 170.3 |
| B | 15 | 204 | 184624 | 1127.41 | 841 | 822 | 163.0 |
| B | 11 | 51 | 62301 | 377.1 | 841 | 822 | 163.0 |
| B | 4 | 81 | 50602 | 305.34 | 841 | 822 | 163.0 |
| C | 14 | 67 | 15497 | 77.3 | 812 | 814 | 189.9 |
| C | 13 | 61 | 6550 | 30.2 | 812 | 814 | 189.9 |
| C | 8 | 222 | 4455 | 19.17 | 812 | 814 | 189.9 |
| D | 4 | 95 | 1445279 | 7407.07 | 786 | 762 | 195.0 |
| D | 0 | 11 | 369851 | 1892.58 | 786 | 762 | 195.0 |
| D | 11 | 241 | 78474 | 398.48 | 786 | 762 | 195.0 |
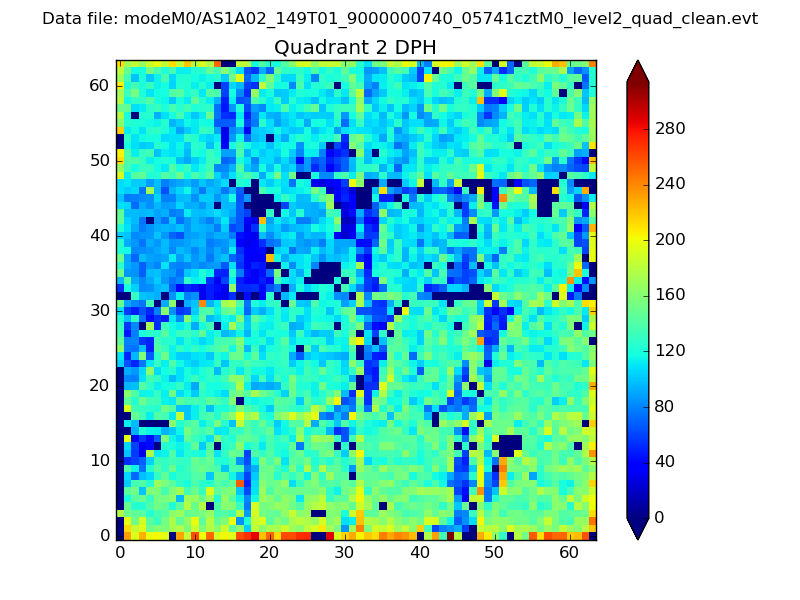
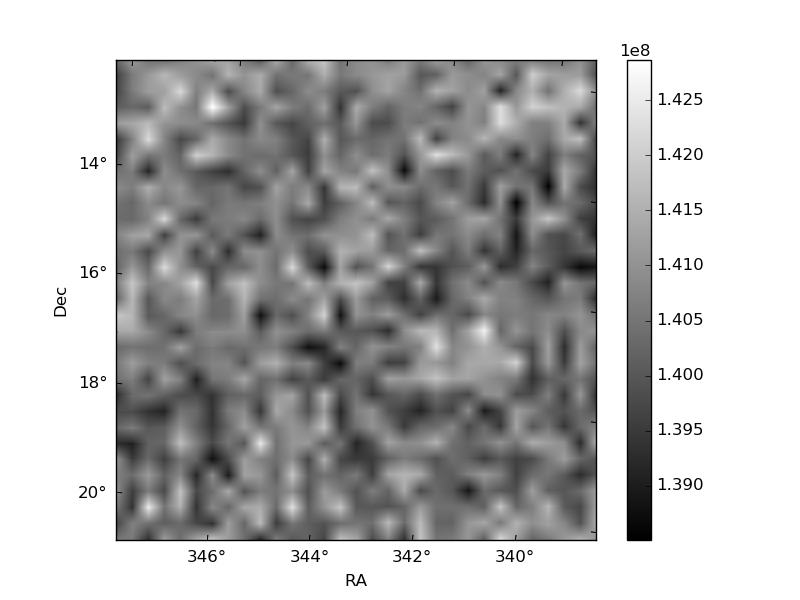
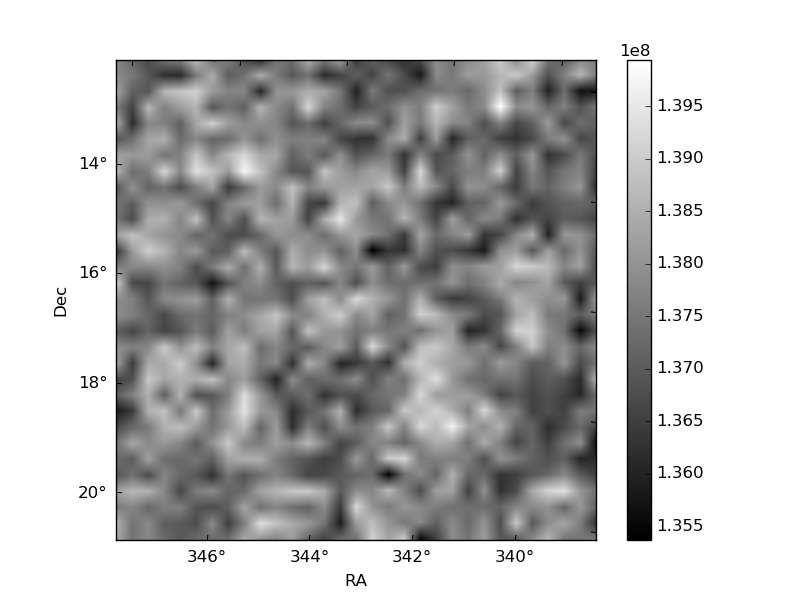
Histogram calculated using DETX and DETY for each event in the final _common_clean file
| Quadrant A | 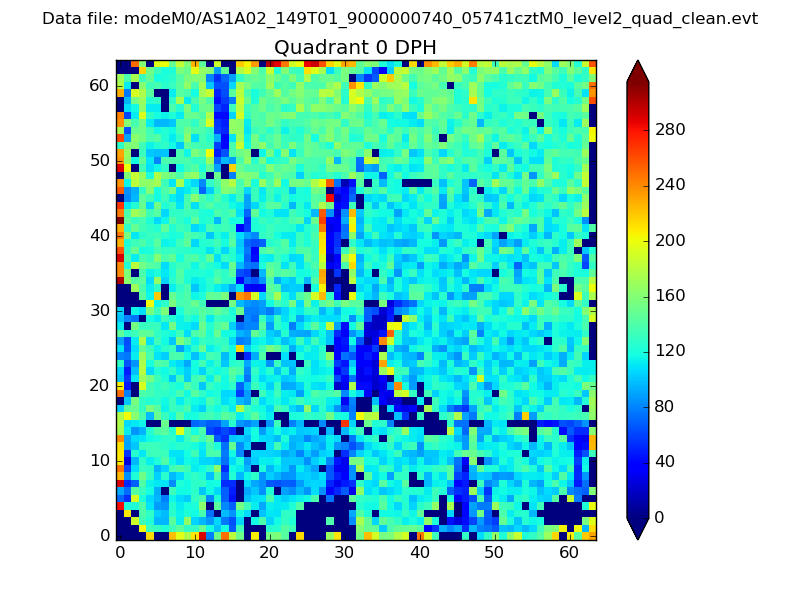 |
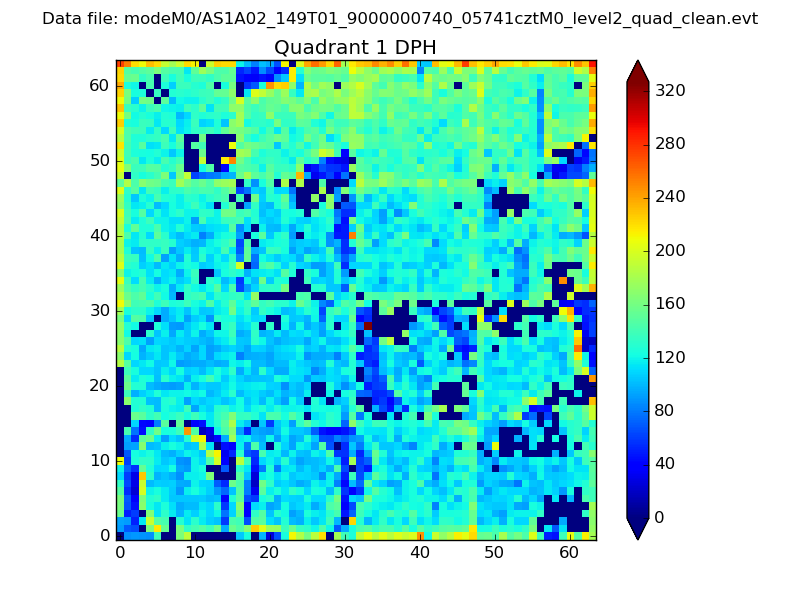 |
Quadrant B |
|---|---|---|---|
| Quadrant D | 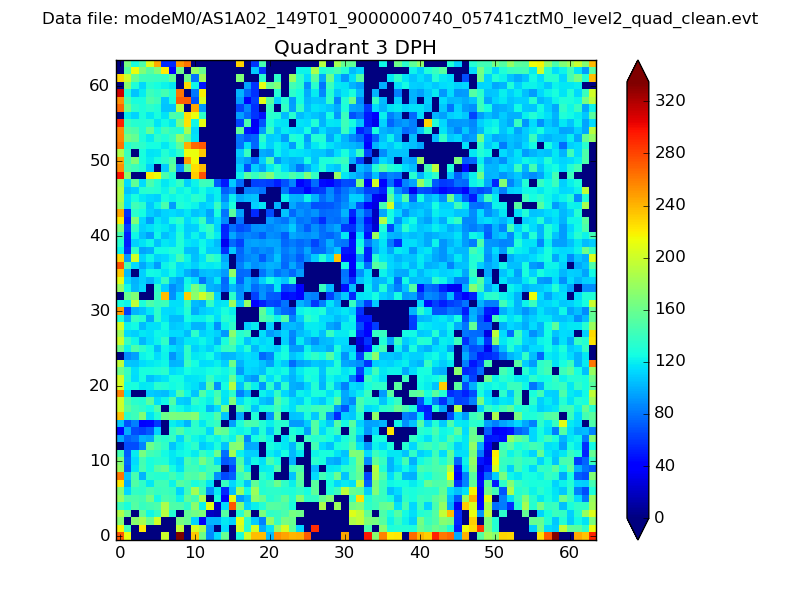 |
 |
Quadrant C |
| Plot type | Count rate plots | Images |
|---|---|---|
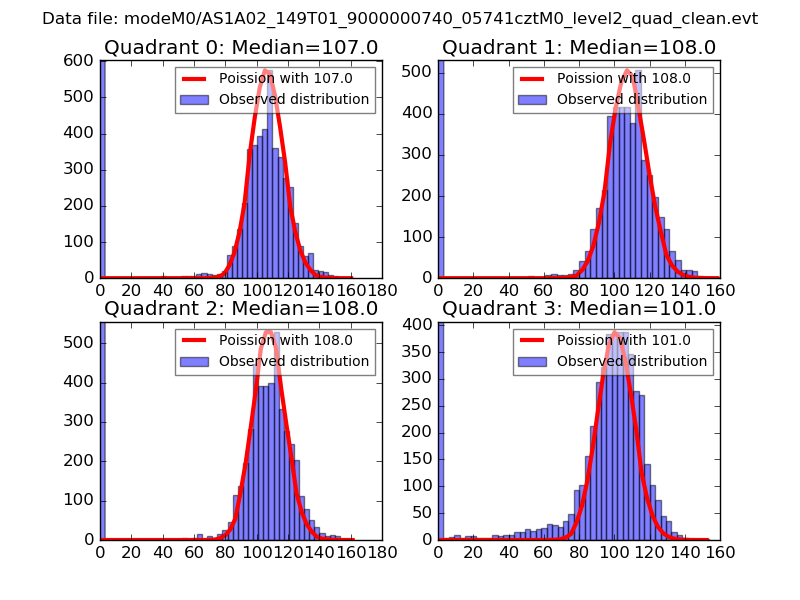
| Comparison with Poisson distribution Blue bars denote a histogram of data divided into 1 sec bins. Red curve is a Poisson curve with rate = median count rate of data. |
 |
 |
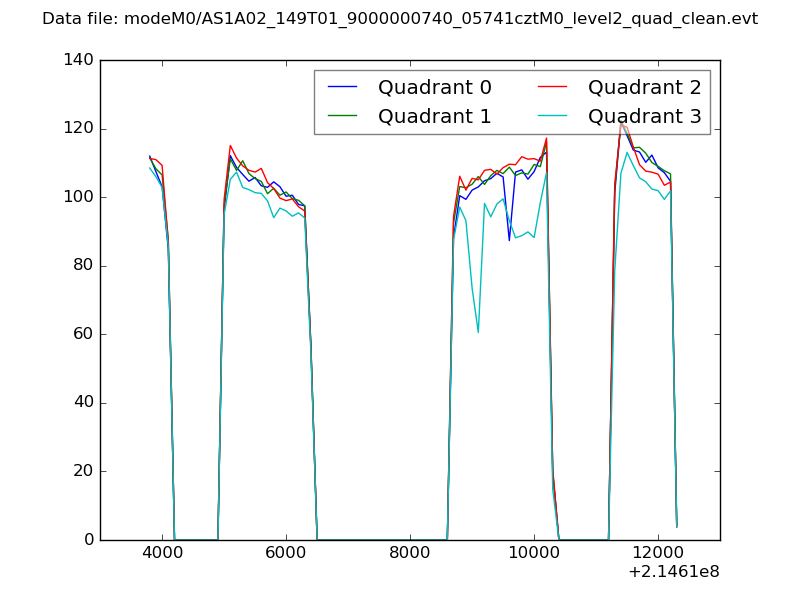
| Quadrant-wise count rates Data is divided into 100 sec bins |
 |
|
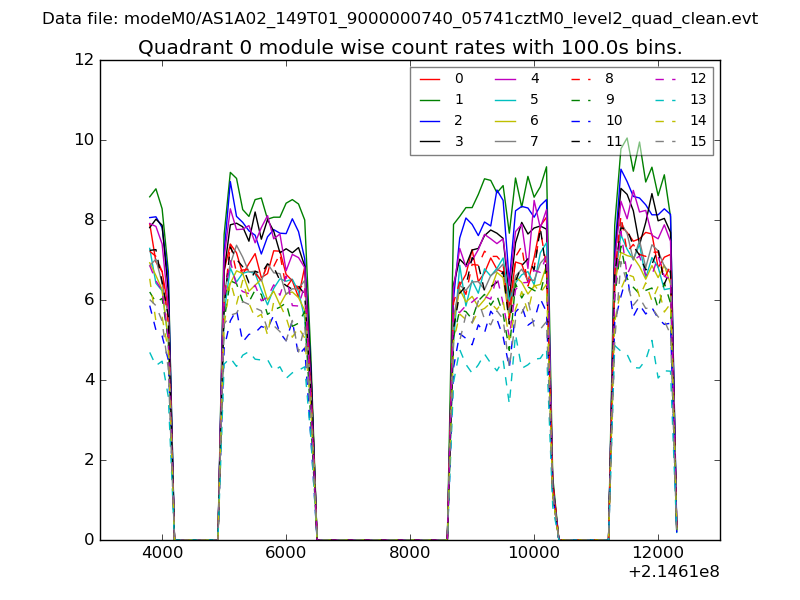
| Module-wise count rates for Quadrant A Data is divided into 100 sec bins |
 |
 |
| Module-wise count rates for Quadrant B Data is divided into 100 sec bins |
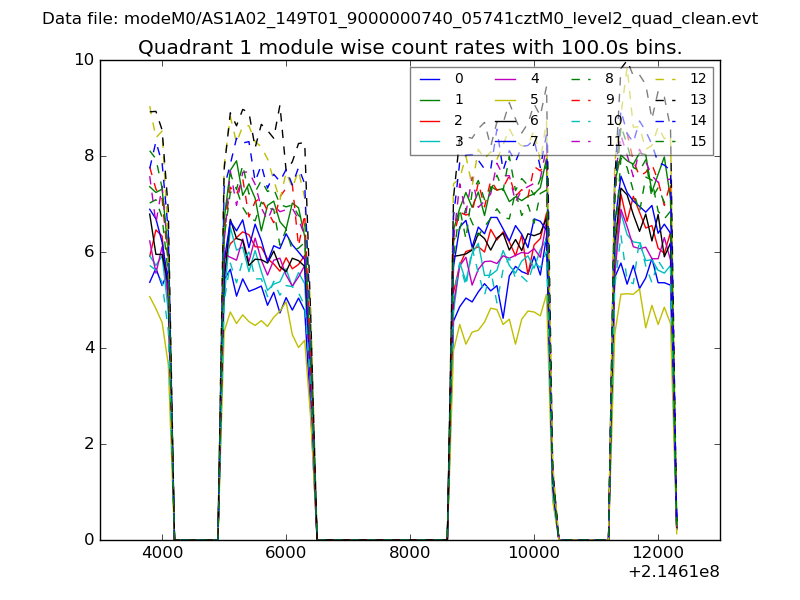 |
 |
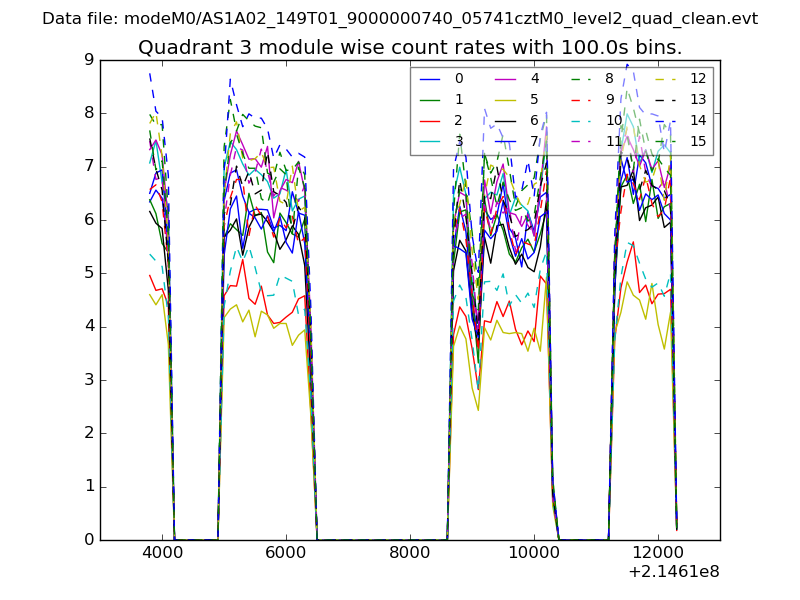
| Module-wise count rates for Quadrant C Data is divided into 100 sec bins |
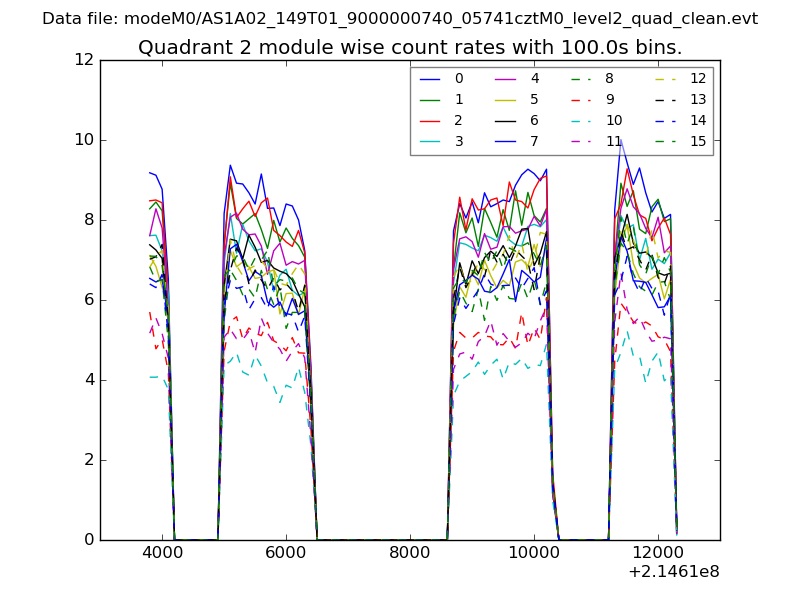 |
 |
| Module-wise count rates for Quadrant D Data is divided into 100 sec bins |
 |
 |
| Parameter | Plot |
|---|---|
| CZT HV Monitor | 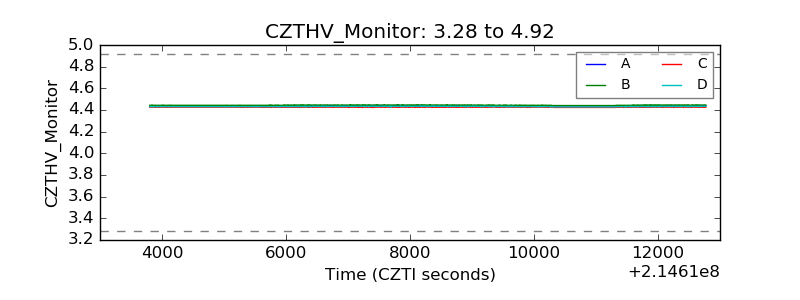 |
| D_VDD | 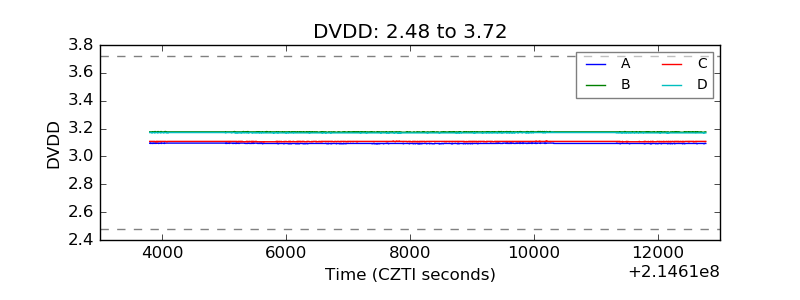 |
| Temperature 1 |  |
| Veto HV Monitor | 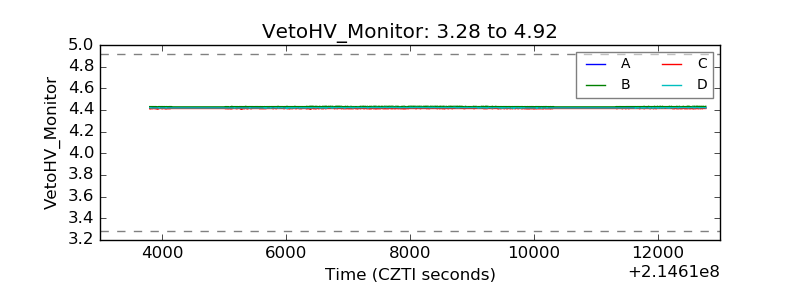 |
| Veto LLD | 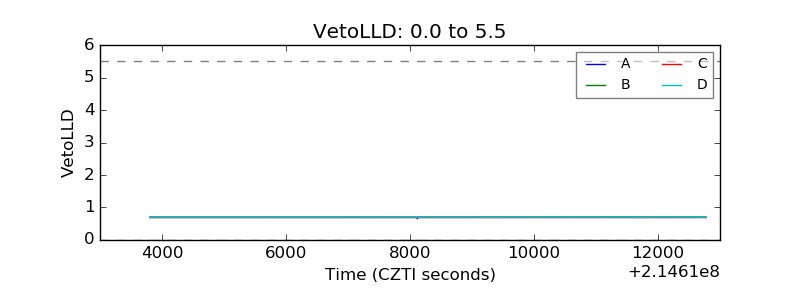 |
| Alpha Counter | 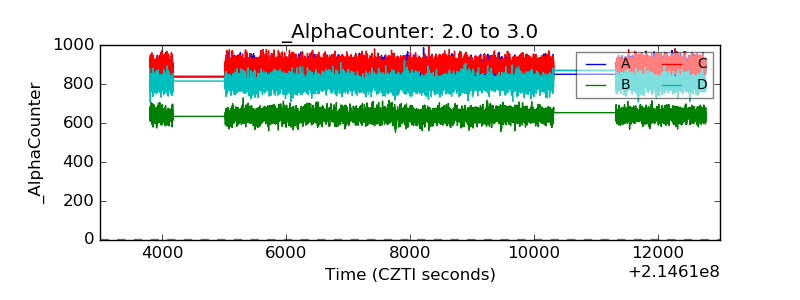 |
| _CPM_Rate | 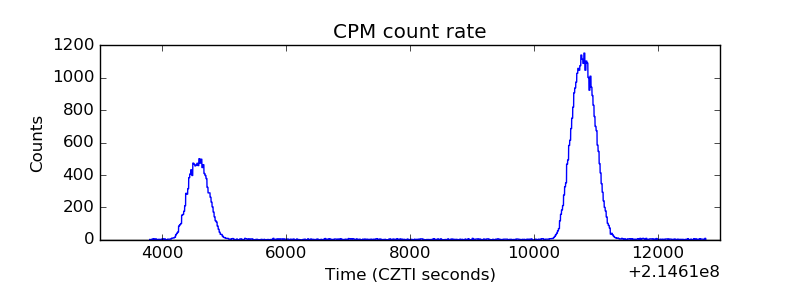 |
| CZT Counter | 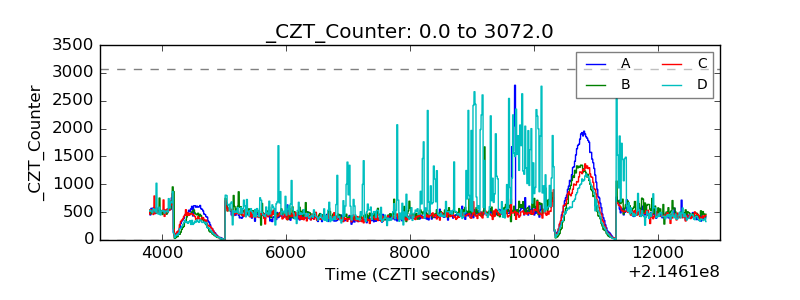 |
| +2.5 Volts monitor |  |
| +5 Volts monitor | 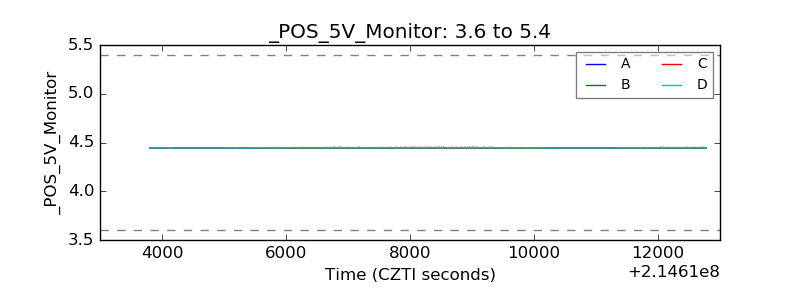 |
| _ROLL_ROT | 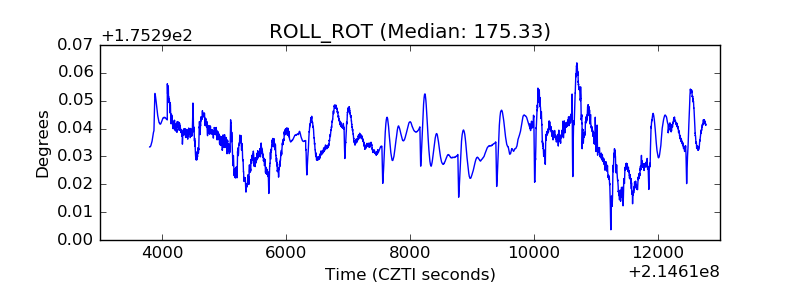 |
| _Roll_DEC | 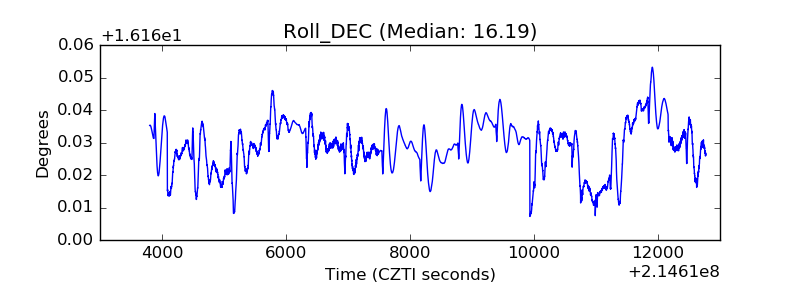 |
| _Roll_RA | 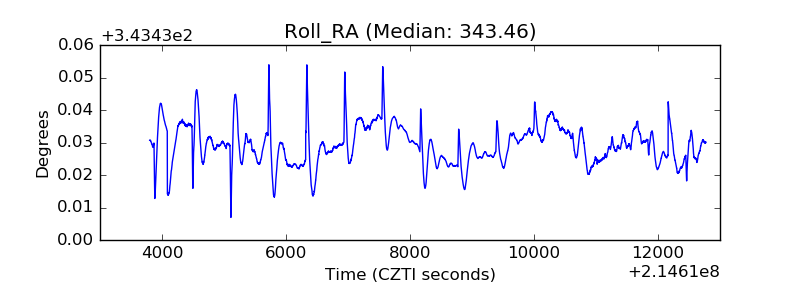 |
| Veto Counter | 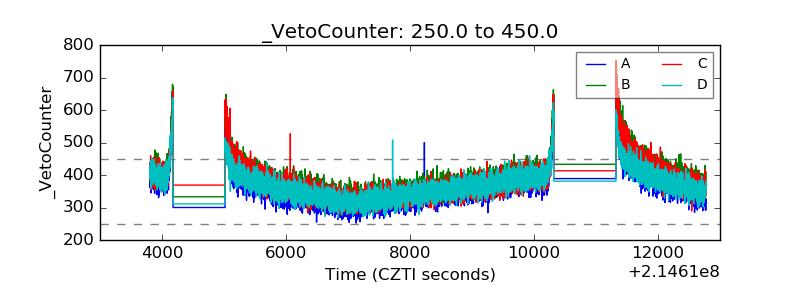 |