| Param | Original file | Final file |
|---|---|---|
| Filename | modeM0/AS1A02_149T01_9000000740_05745cztM0_level2.evt | modeM0/AS1A02_149T01_9000000740_05745cztM0_level2_quad_clean.evt |
| Size (bytes) | 450,907,200 | 55,241,280 |
| Size | 430.0 MB | 52.7 MB |
| Events in quadrant A | 3,351,373 | 308,105 |
| Events in quadrant B | 3,424,361 | 312,666 |
| Events in quadrant C | 3,249,117 | 310,111 |
| Events in quadrant D | 3,195,952 | 294,726 |
| Mode M9 | |||
|---|---|---|---|
| Quadrant | BADHDUFLAG | Total packets | Discarded packets |
| A | 0 | 18 | 0 |
| B | 0 | 18 | 0 |
| C | 0 | 18 | 0 |
| D | 0 | 19 | 0 |
| Mode SS | |||
|---|---|---|---|
| Quadrant | BADHDUFLAG | Total packets | Discarded packets |
| A | 0 | 130 | 0 |
| B | 0 | 130 | 0 |
| C | 0 | 130 | 0 |
| D | 0 | 130 | 0 |
| Mode M0 | |||
|---|---|---|---|
| Quadrant | BADHDUFLAG | Total packets | Discarded packets |
| A | 0 | 13856 | 3 |
| B | 0 | 14046 | 2 |
| C | 0 | 13605 | 2 |
| D | 0 | 13650 | 2 |
| Quadrant | Total seconds | Saturated seconds | Saturation percentage |
|---|---|---|---|
| A | 6400 | 110 | 1.718750% |
| B | 6400 | 57 | 0.890625% |
| C | 6400 | 21 | 0.328125% |
| D | 6400 | 43 | 0.671875% |
Noise dominated data is calculated using 1-second bins in cleaned event files. If a bin has >2000 counts, and if more than 50% of those come from <1% of pixels, then it is considered to be noise-dominated and hence unusable.
| Quadrant | # 1 sec bins | Bins with >0 counts | Bins with >2000 counts | High rate bins dominated by noise | Noise dominated (total time) | Noise dominated (detector-on time) | Marked lightcurve |
|---|---|---|---|---|---|---|---|
| A | 7710 | 6401 | 54 | 54 | 0.70% | 0.84% | 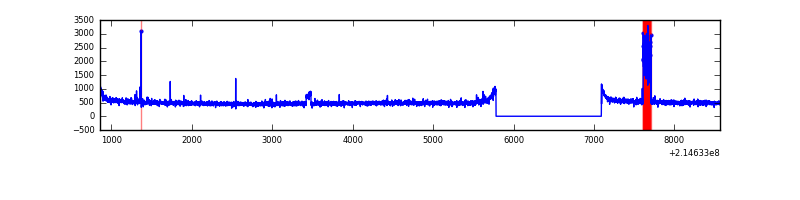 |
| B | 7710 | 6401 | 3 | 3 | 0.04% | 0.05% | 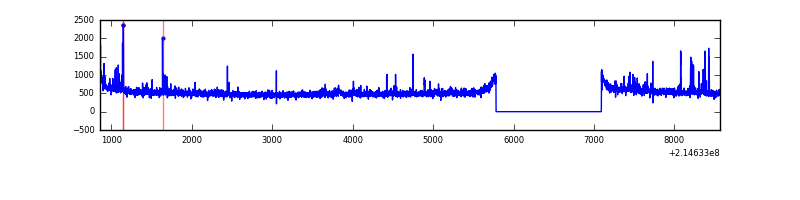 |
| C | 7710 | 6401 | 0 | 0 | 0.00% | 0.00% | 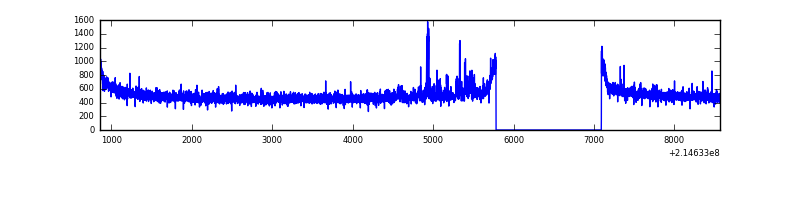 |
| D | 7710 | 6401 | 18 | 18 | 0.23% | 0.28% | 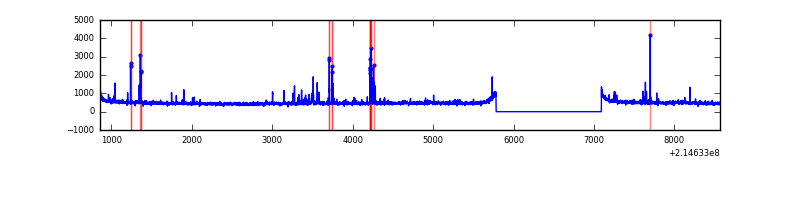 |
Top three noisy pixels from each quadrant. If the there are fewer than three noisy pixels in the level2.evt file, extra rows are filled as -1
| Pixel properties | Quadrant properties | ||||||
|---|---|---|---|---|---|---|---|
| Quadrant | DetID | PixID | Counts | Sigma | Mean | Median | Sigma |
| A | 15 | 236 | 185937 | 1115.14 | 821 | 804 | 166.0 |
| A | 0 | 226 | 8071 | 43.77 | 821 | 804 | 166.0 |
| A | 12 | 194 | 7873 | 42.58 | 821 | 804 | 166.0 |
| B | 4 | 81 | 81225 | 508.07 | 835 | 819 | 158.3 |
| B | 11 | 51 | 37999 | 234.93 | 835 | 819 | 158.3 |
| B | 15 | 204 | 34502 | 212.83 | 835 | 819 | 158.3 |
| C | 9 | 16 | 109655 | 593.64 | 793 | 799 | 183.4 |
| C | 8 | 128 | 16043 | 83.13 | 793 | 799 | 183.4 |
| C | 14 | 67 | 15559 | 80.49 | 793 | 799 | 183.4 |
| D | 2 | 206 | 76708 | 396.14 | 786 | 764 | 191.7 |
| D | 12 | 110 | 49486 | 254.14 | 786 | 764 | 191.7 |
| D | 11 | 241 | 33292 | 169.67 | 786 | 764 | 191.7 |
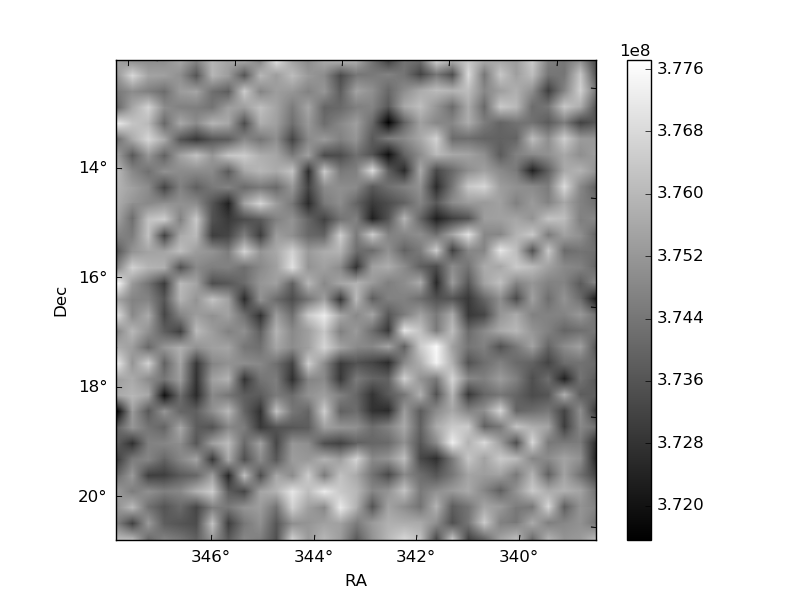
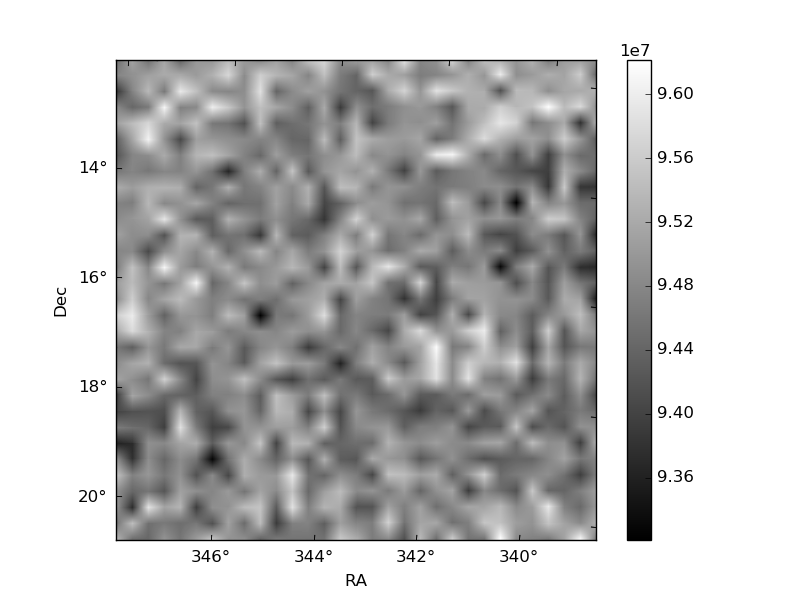
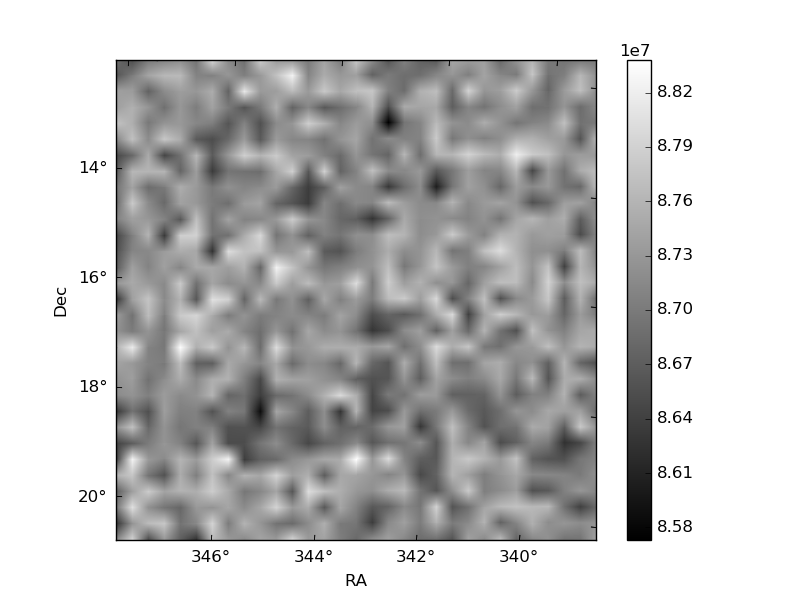
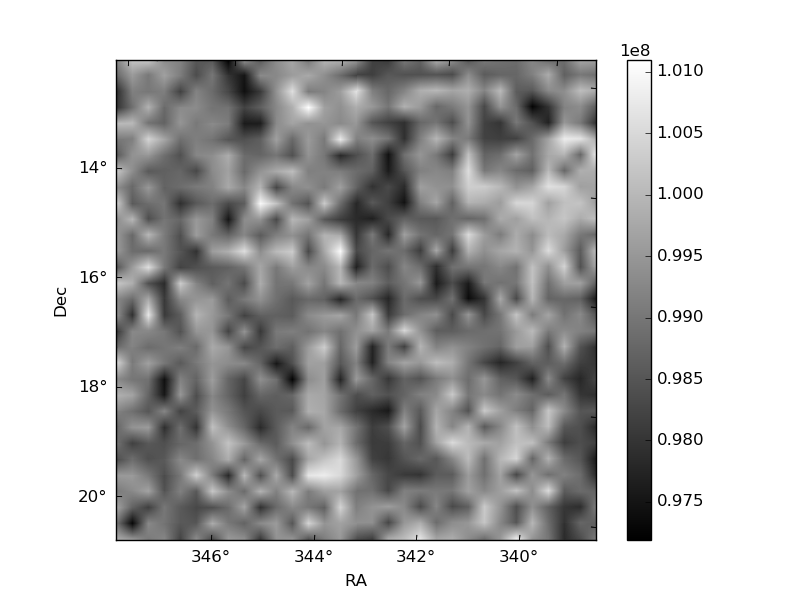
Histogram calculated using DETX and DETY for each event in the final _common_clean file
| Quadrant A | 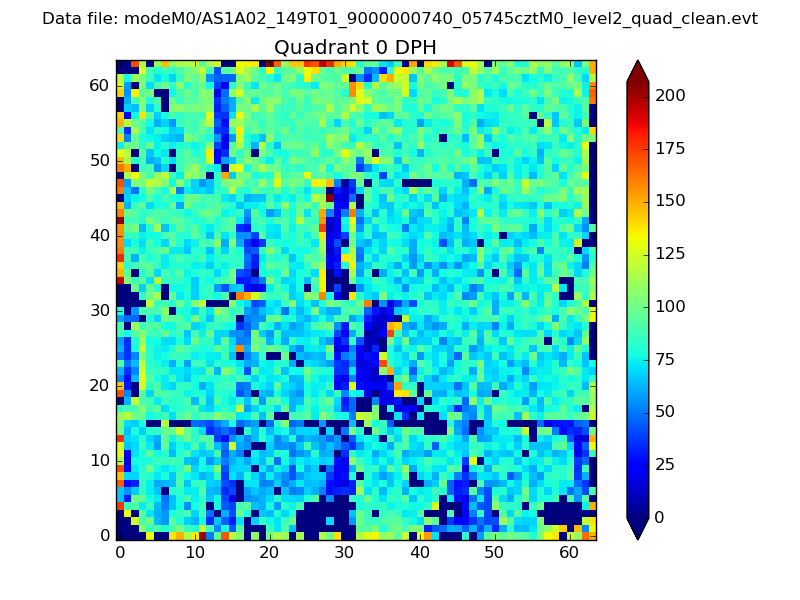 |
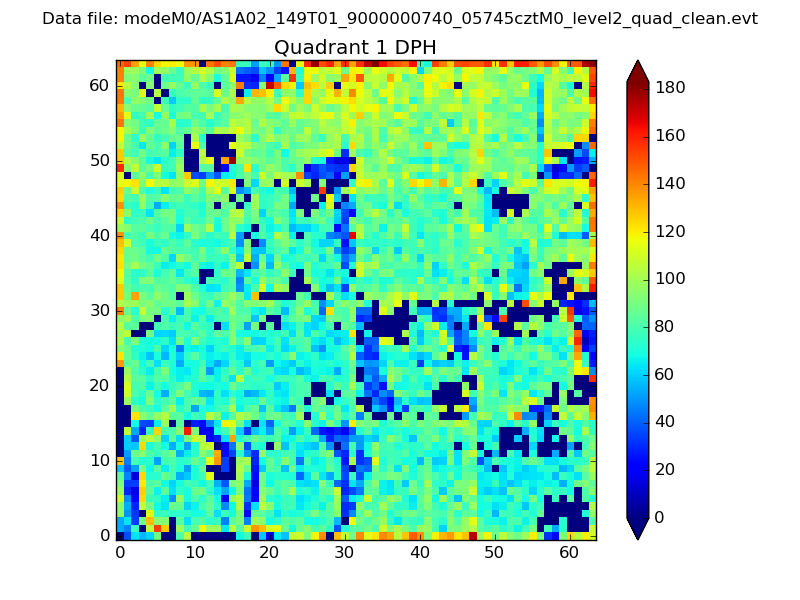 |
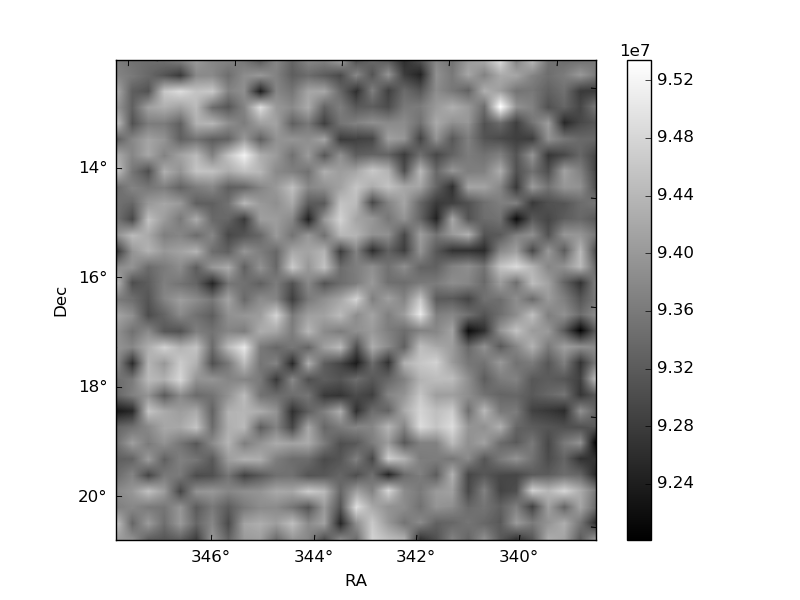
Quadrant B |
|---|---|---|---|
| Quadrant D | 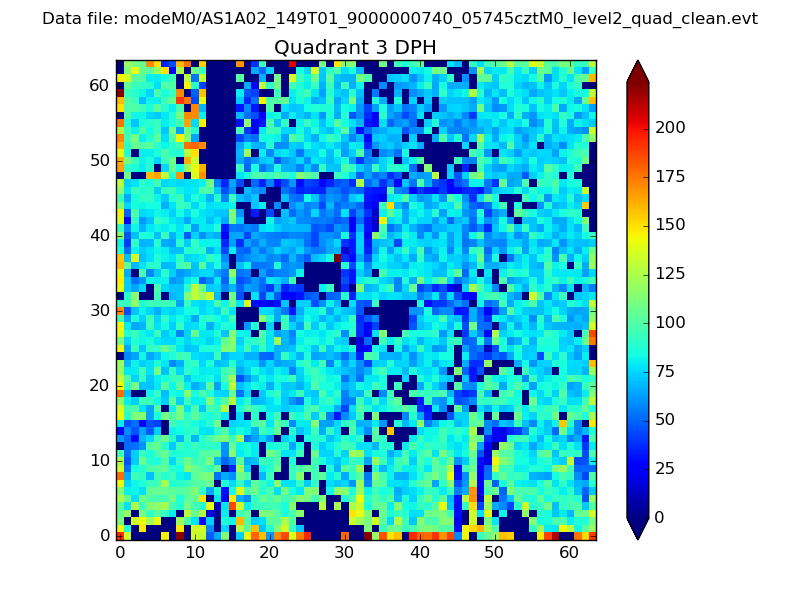 |
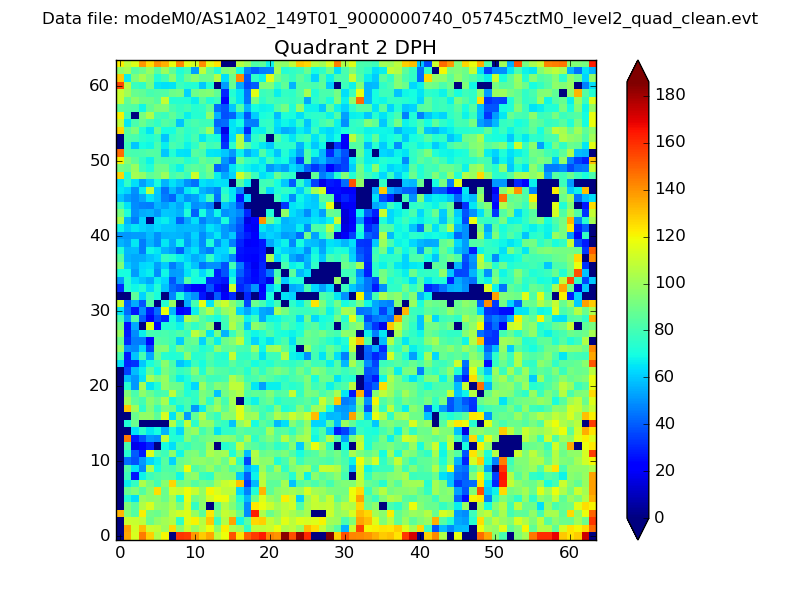 |
Quadrant C |
| Plot type | Count rate plots | Images |
|---|---|---|
| Comparison with Poisson distribution Blue bars denote a histogram of data divided into 1 sec bins. Red curve is a Poisson curve with rate = median count rate of data. |
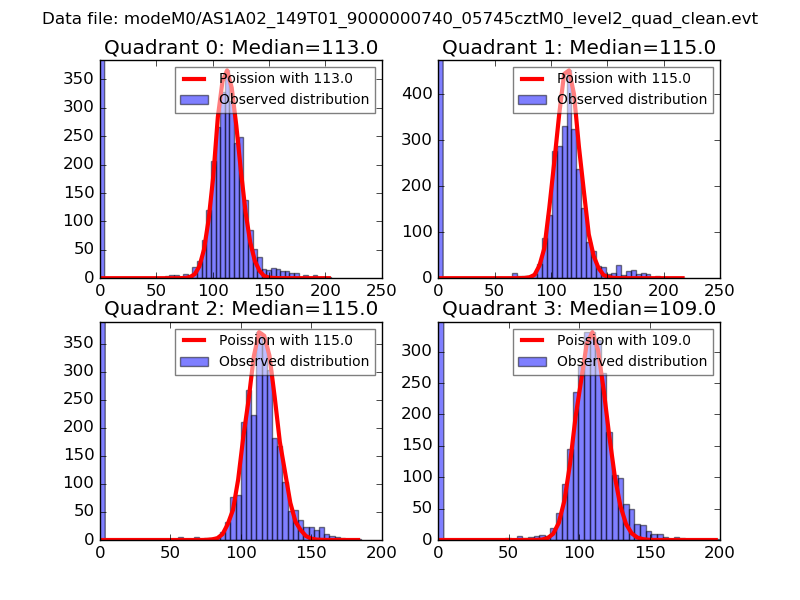 |
 |
| Quadrant-wise count rates Data is divided into 100 sec bins |
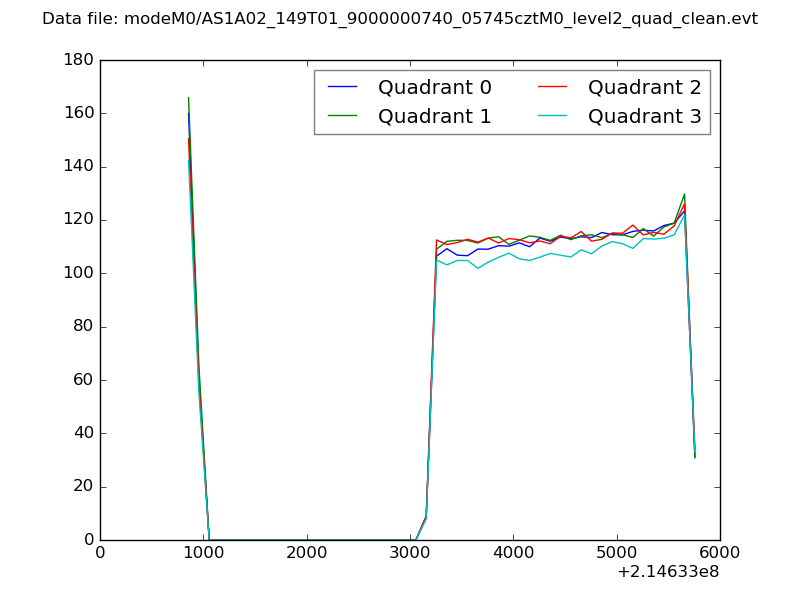 |
|
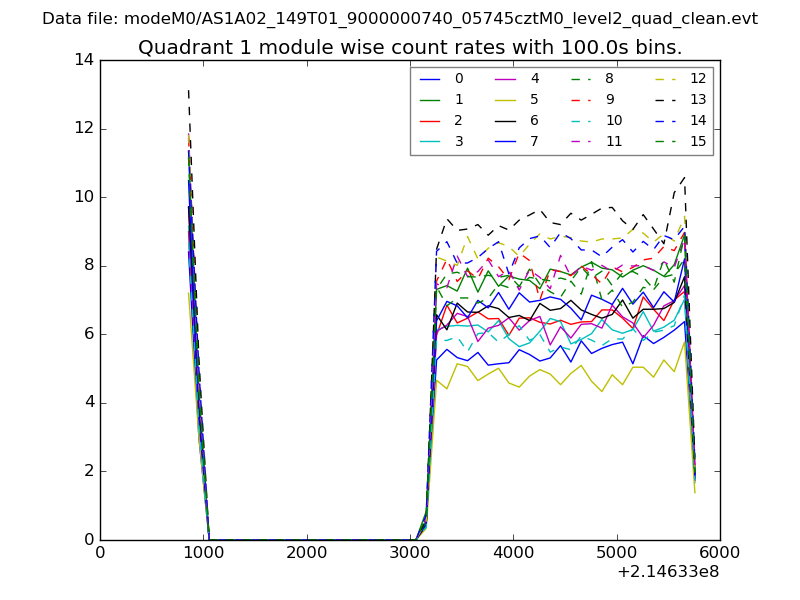
| Module-wise count rates for Quadrant A Data is divided into 100 sec bins |
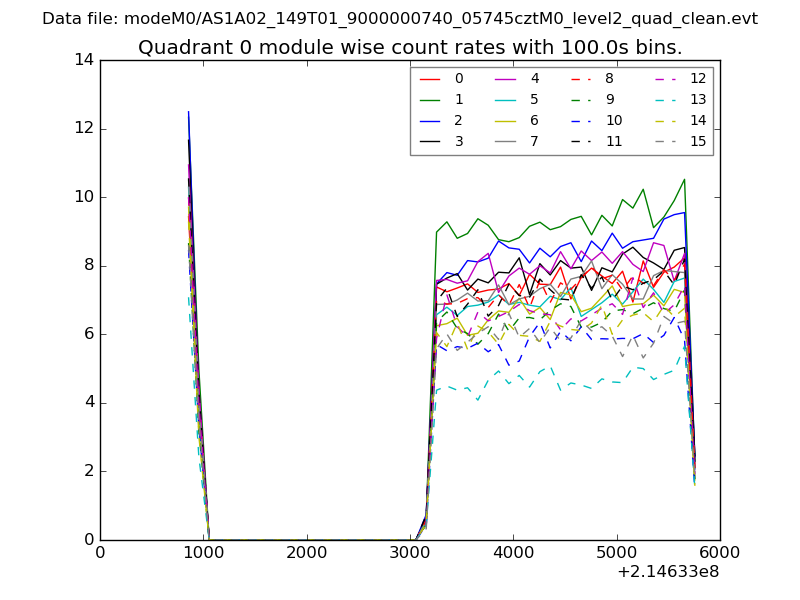 |
 |
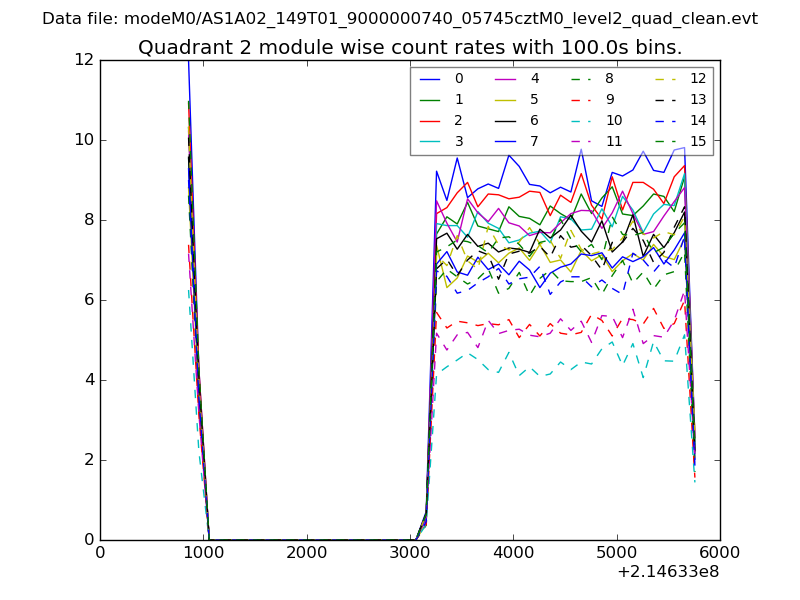
| Module-wise count rates for Quadrant B Data is divided into 100 sec bins |
 |
 |
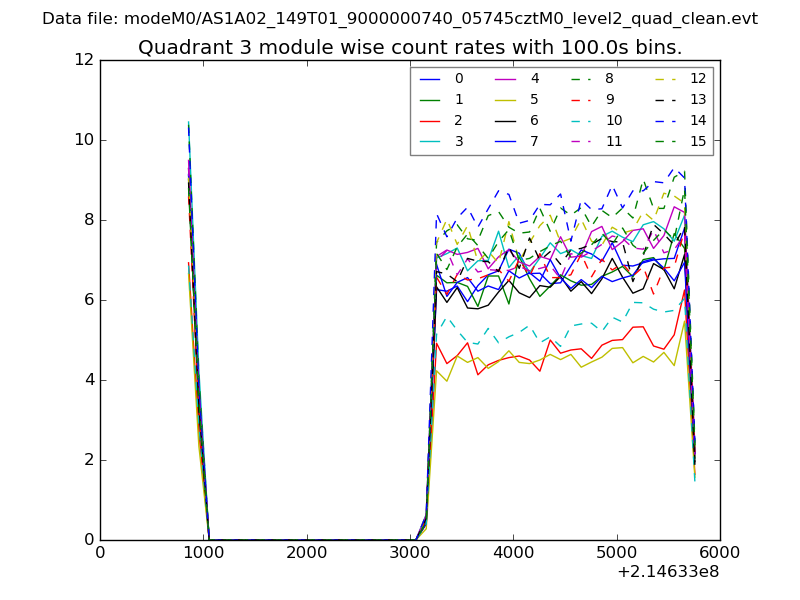
| Module-wise count rates for Quadrant C Data is divided into 100 sec bins |
 |
 |
| Module-wise count rates for Quadrant D Data is divided into 100 sec bins |
 |
 |
| Parameter | Plot |
|---|---|
| CZT HV Monitor | 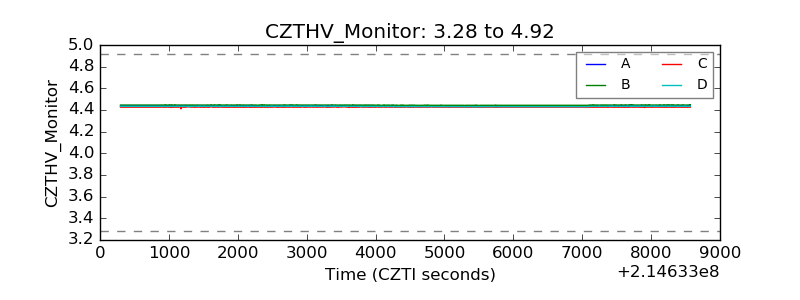 |
| D_VDD |  |
| Temperature 1 | 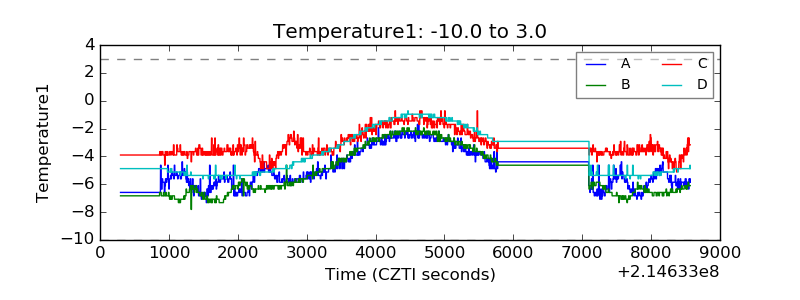 |
| Veto HV Monitor | 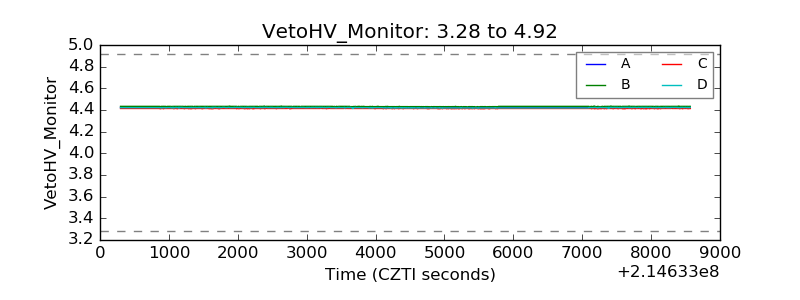 |
| Veto LLD | 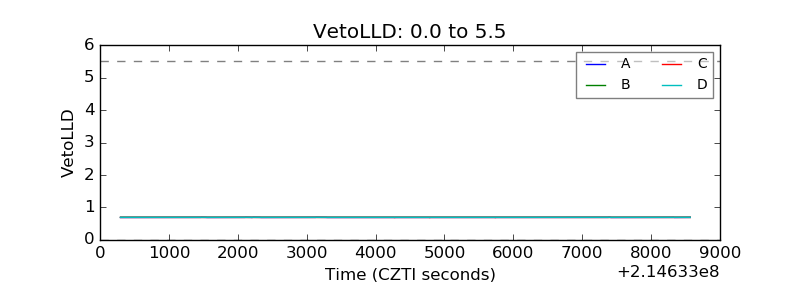 |
| Alpha Counter | 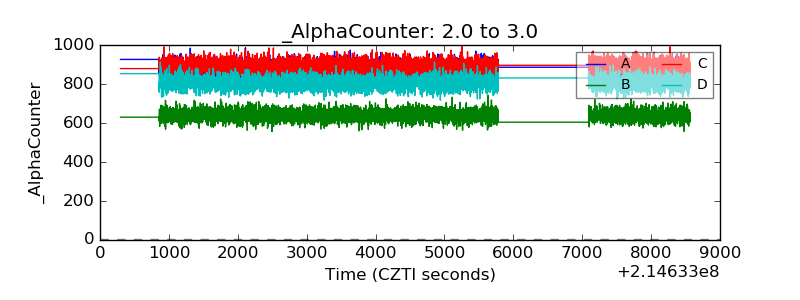 |
| _CPM_Rate | 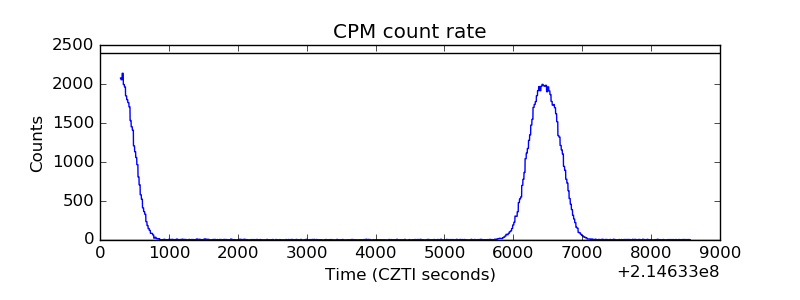 |
| CZT Counter | 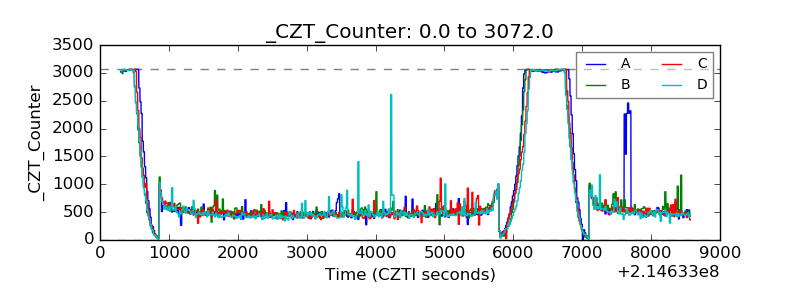 |
| +2.5 Volts monitor |  |
| +5 Volts monitor |  |
| _ROLL_ROT | 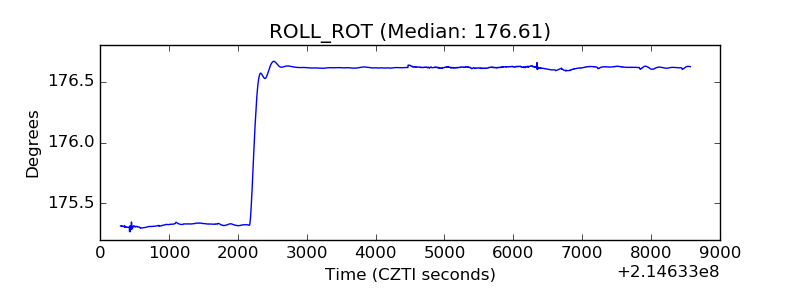 |
| _Roll_DEC | 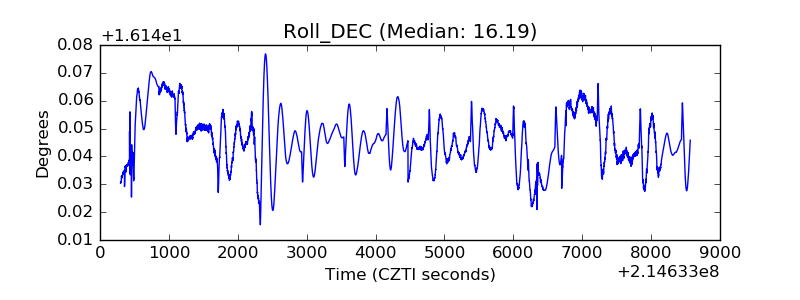 |
| _Roll_RA | 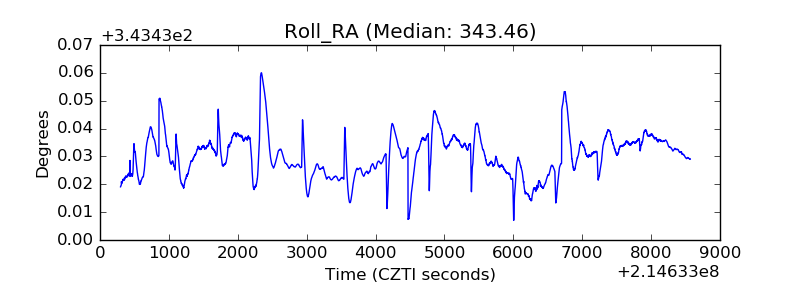 |
| Veto Counter | 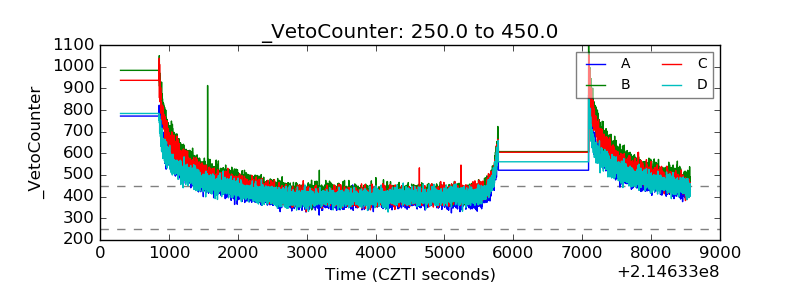 |