| Param | Original file | Final file |
|---|---|---|
| Filename | modeM0/AS1A02_149T01_9000000740_05746cztM0_level2.evt | modeM0/AS1A02_149T01_9000000740_05746cztM0_level2_quad_clean.evt |
| Size (bytes) | 441,383,040 | 58,392,000 |
| Size | 420.9 MB | 55.7 MB |
| Events in quadrant A | 3,294,129 | 334,914 |
| Events in quadrant B | 3,409,087 | 339,058 |
| Events in quadrant C | 3,122,729 | 339,059 |
| Events in quadrant D | 3,119,259 | 321,124 |
| Mode M9 | |||
|---|---|---|---|
| Quadrant | BADHDUFLAG | Total packets | Discarded packets |
| A | 0 | 15 | 0 |
| B | 0 | 15 | 0 |
| C | 0 | 15 | 0 |
| D | 0 | 16 | 0 |
| Mode SS | |||
|---|---|---|---|
| Quadrant | BADHDUFLAG | Total packets | Discarded packets |
| A | 0 | 128 | 0 |
| B | 0 | 128 | 0 |
| C | 0 | 128 | 0 |
| D | 0 | 128 | 0 |
| Mode M0 | |||
|---|---|---|---|
| Quadrant | BADHDUFLAG | Total packets | Discarded packets |
| A | 0 | 13516 | 3 |
| B | 0 | 13820 | 2 |
| C | 0 | 13091 | 2 |
| D | 0 | 13185 | 2 |
| Quadrant | Total seconds | Saturated seconds | Saturation percentage |
|---|---|---|---|
| A | 6203 | 136 | 2.192488% |
| B | 6203 | 97 | 1.563759% |
| C | 6203 | 39 | 0.628728% |
| D | 6203 | 64 | 1.031759% |
Noise dominated data is calculated using 1-second bins in cleaned event files. If a bin has >2000 counts, and if more than 50% of those come from <1% of pixels, then it is considered to be noise-dominated and hence unusable.
| Quadrant | # 1 sec bins | Bins with >0 counts | Bins with >2000 counts | High rate bins dominated by noise | Noise dominated (total time) | Noise dominated (detector-on time) | Marked lightcurve |
|---|---|---|---|---|---|---|---|
| A | 7518 | 6204 | 56 | 56 | 0.74% | 0.90% | 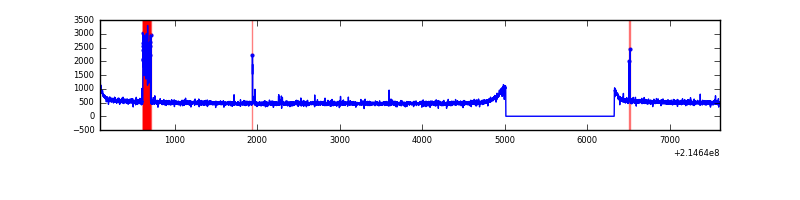 |
| B | 7518 | 6204 | 1 | 1 | 0.01% | 0.02% | 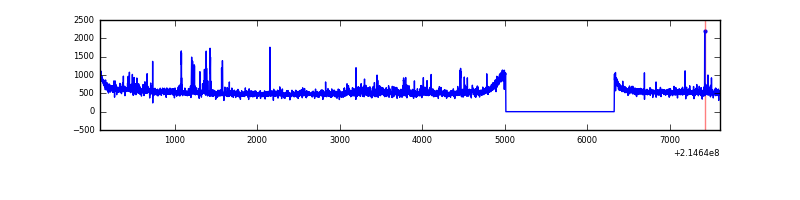 |
| C | 7518 | 6204 | 2 | 2 | 0.03% | 0.03% | 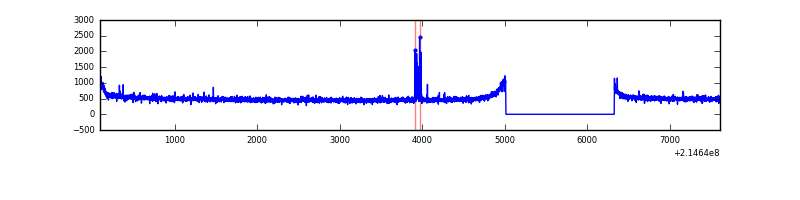 |
| D | 7518 | 6204 | 18 | 18 | 0.24% | 0.29% | 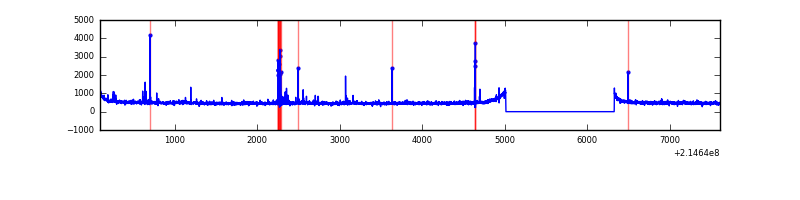 |
Top three noisy pixels from each quadrant. If the there are fewer than three noisy pixels in the level2.evt file, extra rows are filled as -1
| Pixel properties | Quadrant properties | ||||||
|---|---|---|---|---|---|---|---|
| Quadrant | DetID | PixID | Counts | Sigma | Mean | Median | Sigma |
| A | 15 | 236 | 166768 | 1022.88 | 810 | 796 | 162.3 |
| A | 14 | 111 | 9383 | 52.92 | 810 | 796 | 162.3 |
| A | 0 | 226 | 7789 | 43.1 | 810 | 796 | 162.3 |
| B | 15 | 204 | 100404 | 635.38 | 821 | 803 | 156.8 |
| B | 4 | 81 | 61409 | 386.62 | 821 | 803 | 156.8 |
| B | 11 | 51 | 55401 | 348.29 | 821 | 803 | 156.8 |
| C | 9 | 16 | 68023 | 375.05 | 781 | 787 | 179.3 |
| C | 13 | 61 | 6323 | 30.88 | 781 | 787 | 179.3 |
| C | 8 | 222 | 3456 | 14.89 | 781 | 787 | 179.3 |
| D | 2 | 206 | 65453 | 340.46 | 777 | 755 | 190.0 |
| D | 11 | 241 | 42797 | 221.23 | 777 | 755 | 190.0 |
| D | 2 | 14 | 24934 | 127.24 | 777 | 755 | 190.0 |
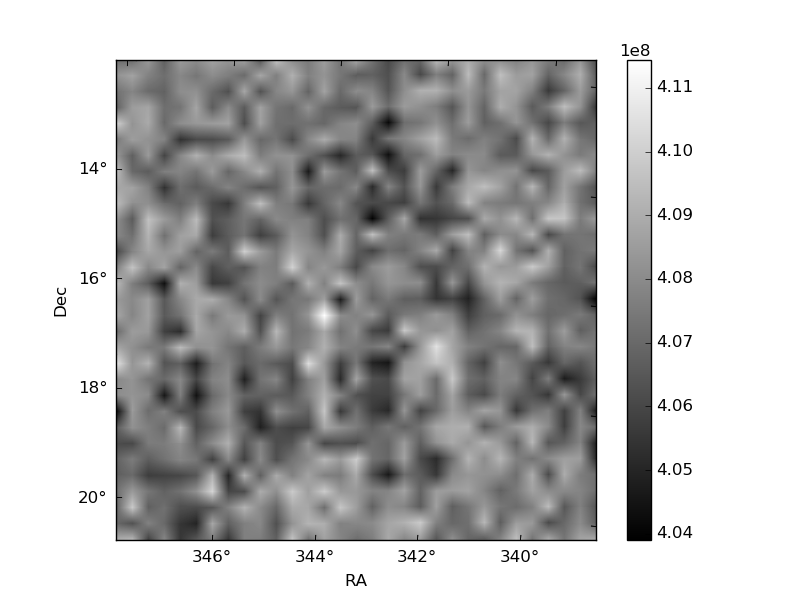
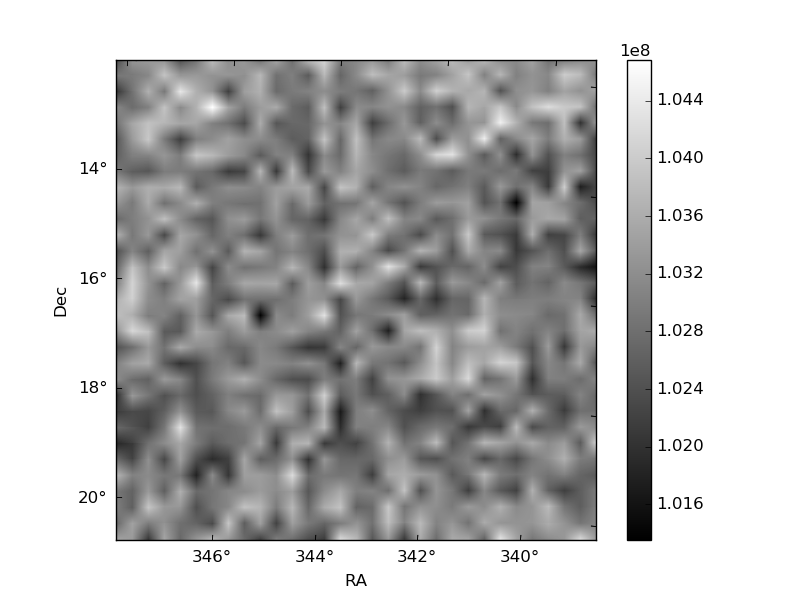
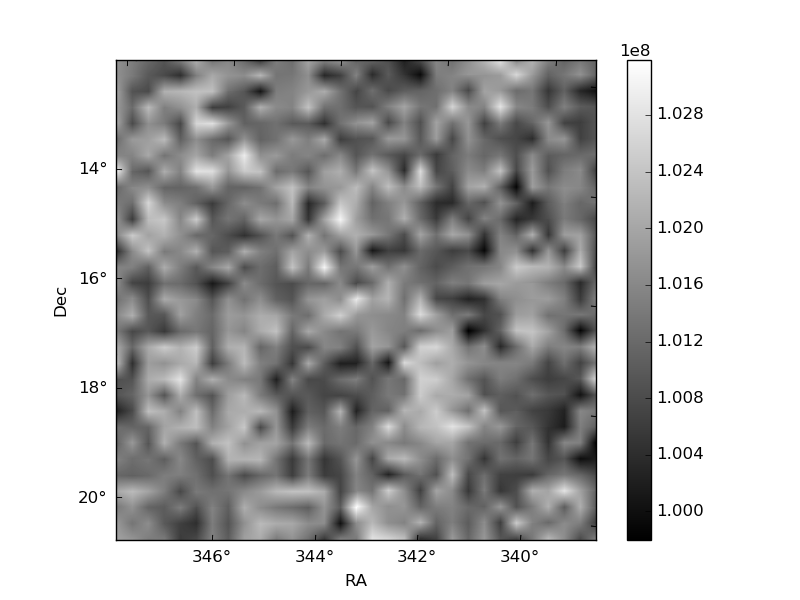
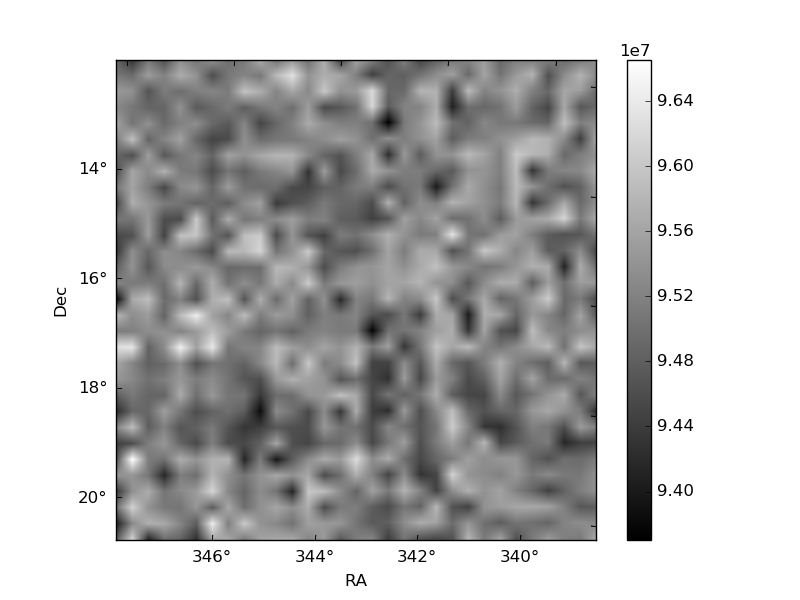
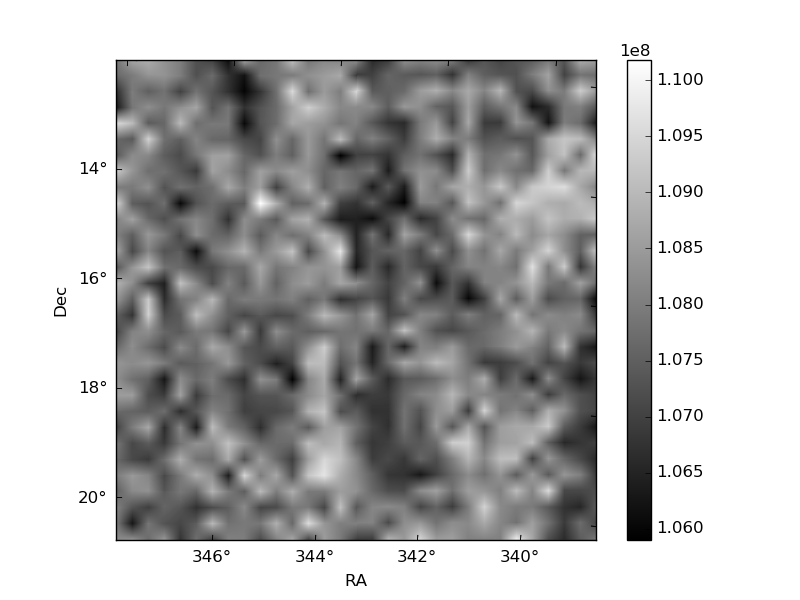
Histogram calculated using DETX and DETY for each event in the final _common_clean file
| Quadrant A | 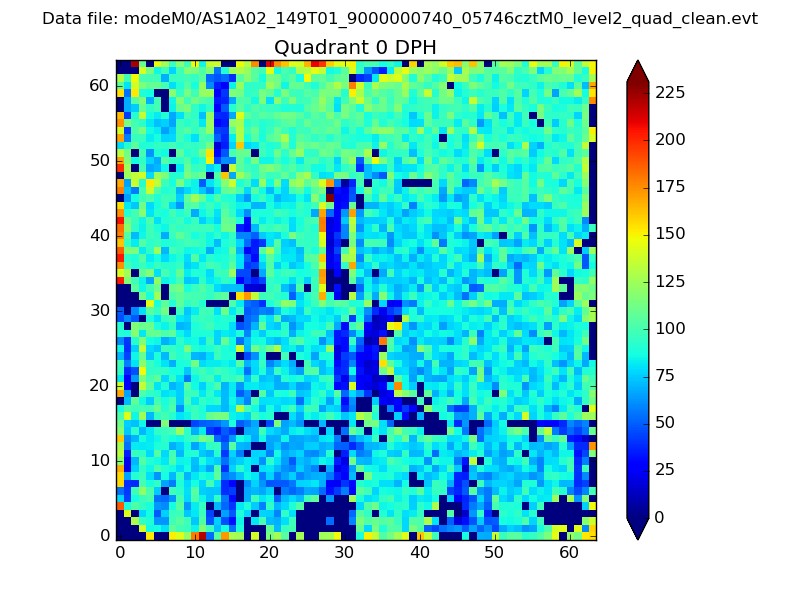 |
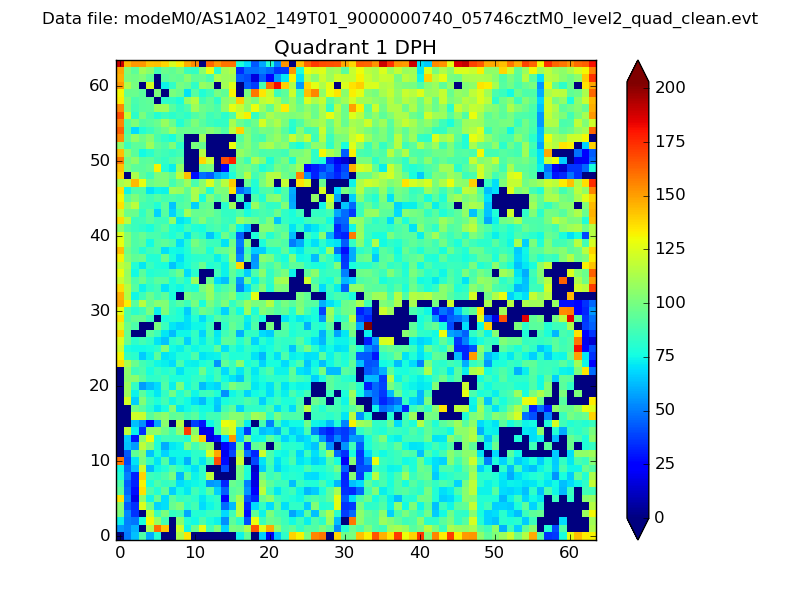 |
Quadrant B |
|---|---|---|---|
| Quadrant D | 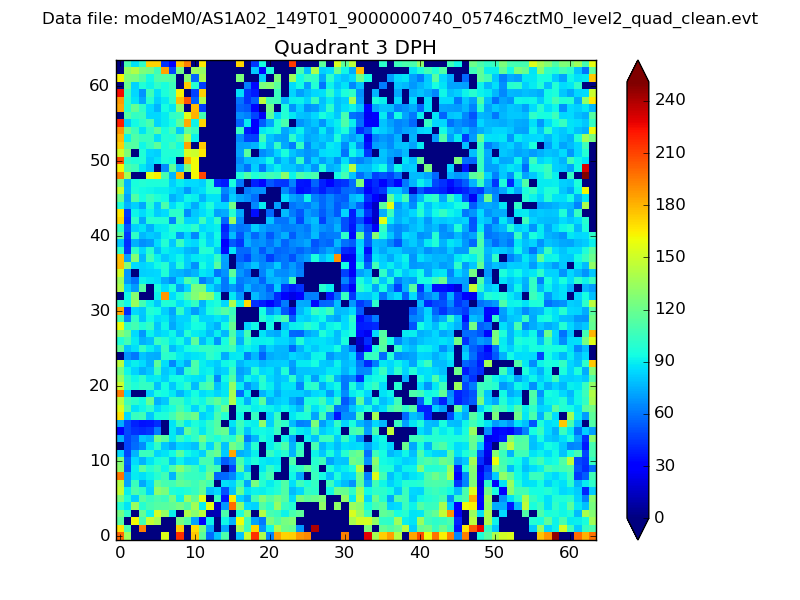 |
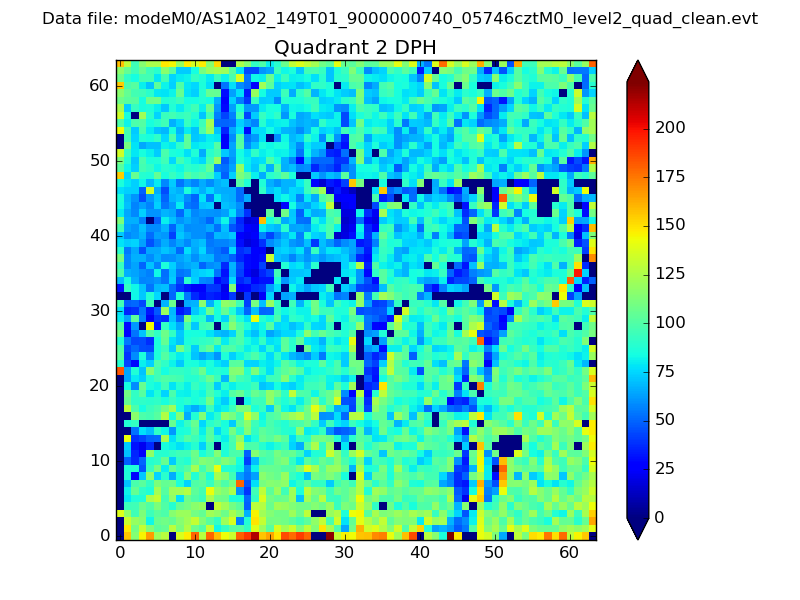 |
Quadrant C |
| Plot type | Count rate plots | Images |
|---|---|---|
| Comparison with Poisson distribution Blue bars denote a histogram of data divided into 1 sec bins. Red curve is a Poisson curve with rate = median count rate of data. |
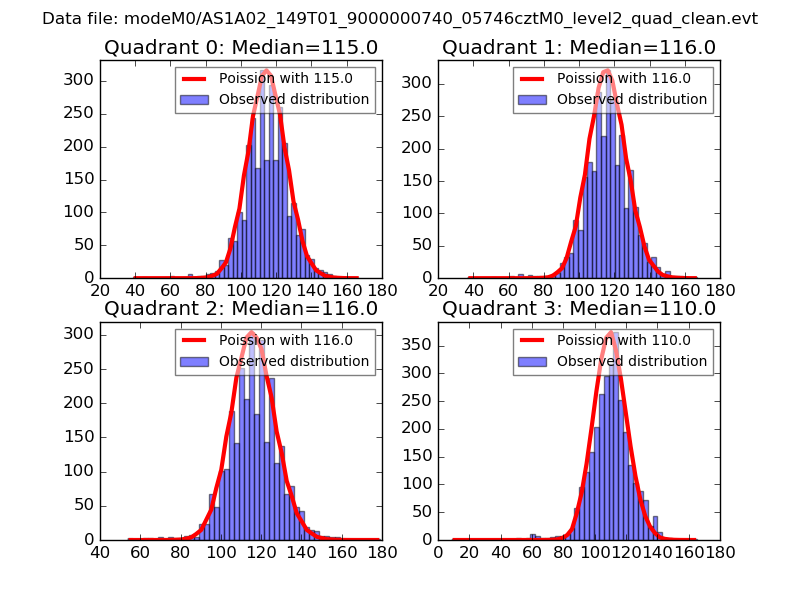 |
 |
| Quadrant-wise count rates Data is divided into 100 sec bins |
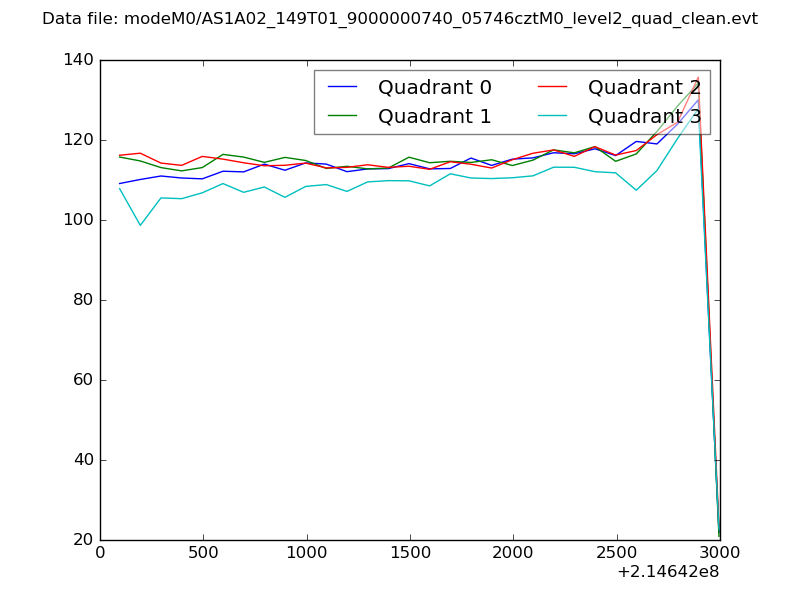 |
|
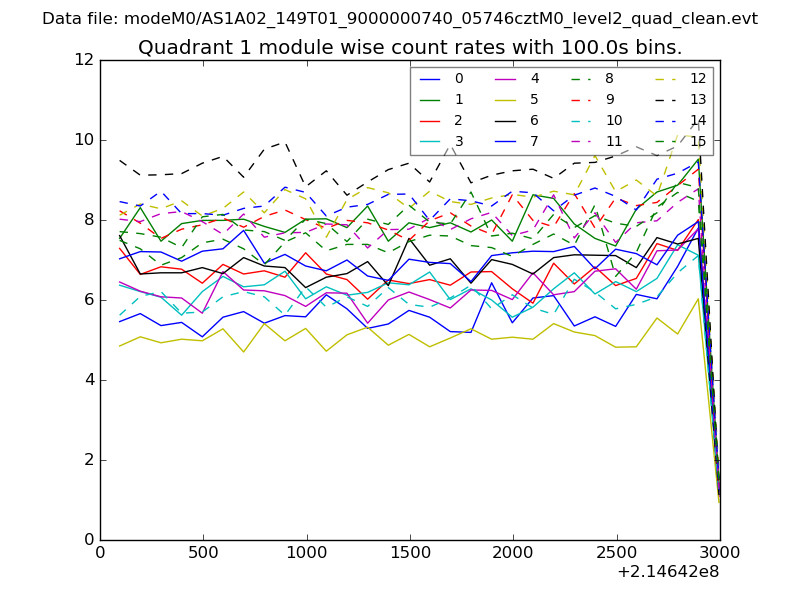
| Module-wise count rates for Quadrant A Data is divided into 100 sec bins |
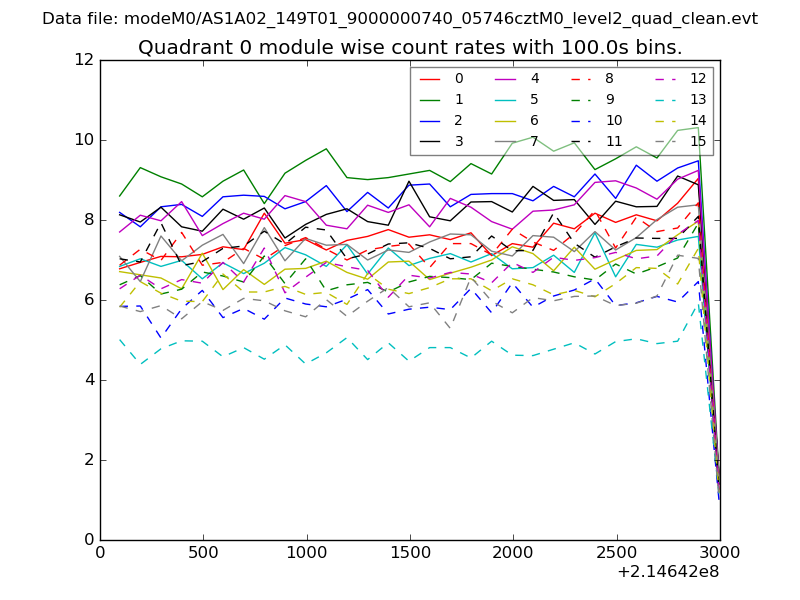 |
 |
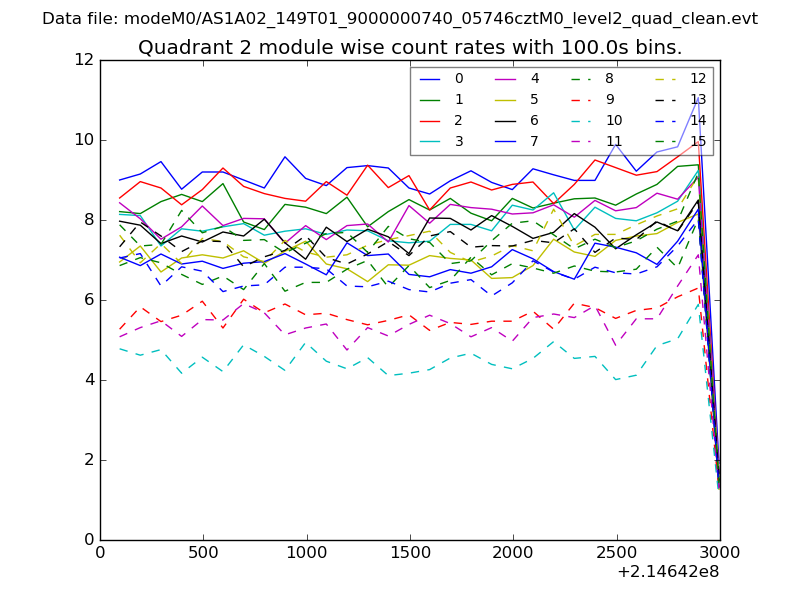
| Module-wise count rates for Quadrant B Data is divided into 100 sec bins |
 |
 |
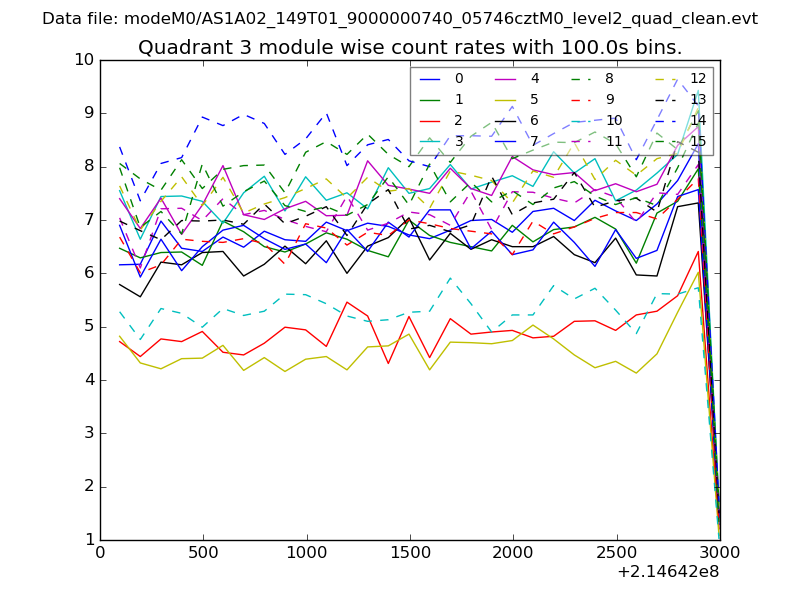
| Module-wise count rates for Quadrant C Data is divided into 100 sec bins |
 |
 |
| Module-wise count rates for Quadrant D Data is divided into 100 sec bins |
 |
 |
| Parameter | Plot |
|---|---|
| CZT HV Monitor | 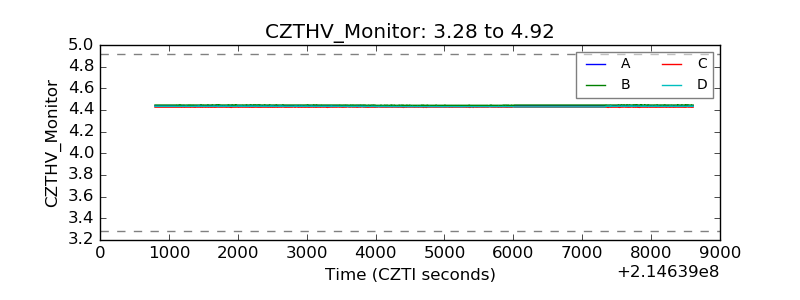 |
| D_VDD | 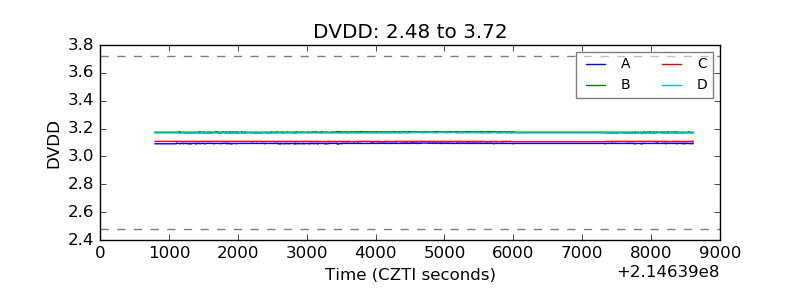 |
| Temperature 1 | 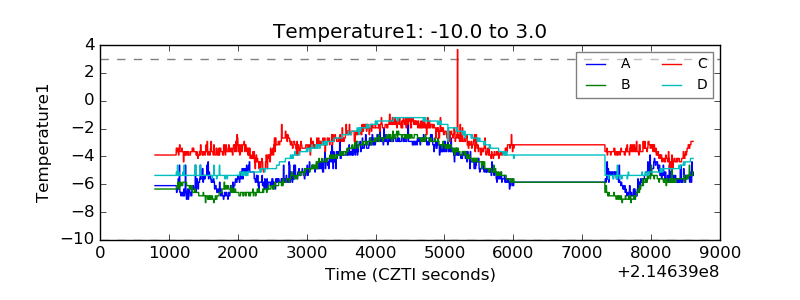 |
| Veto HV Monitor | 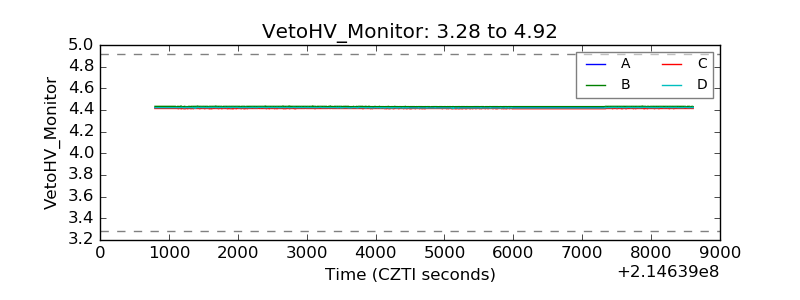 |
| Veto LLD | 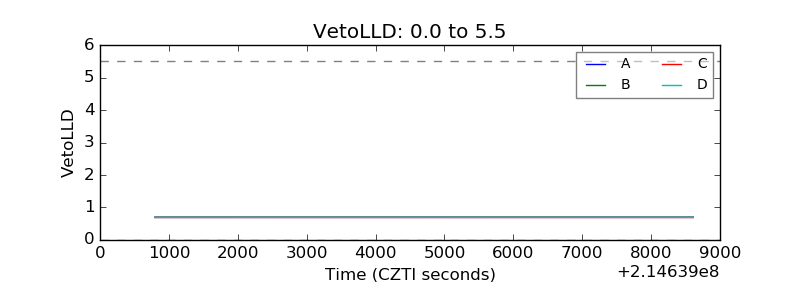 |
| Alpha Counter | 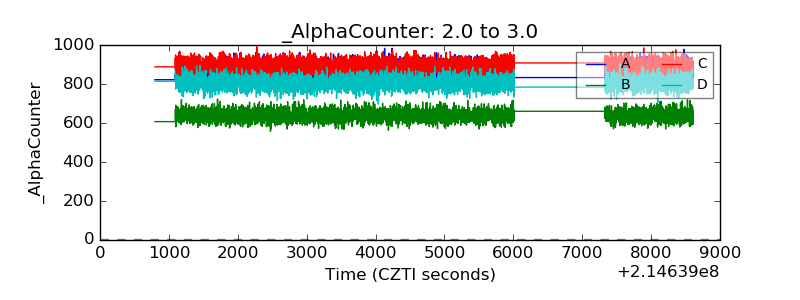 |
| _CPM_Rate | 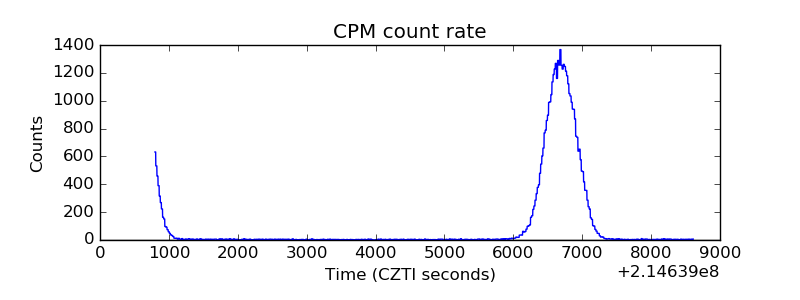 |
| CZT Counter | 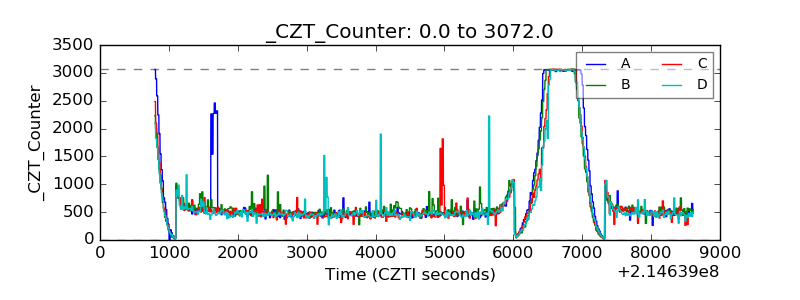 |
| +2.5 Volts monitor | 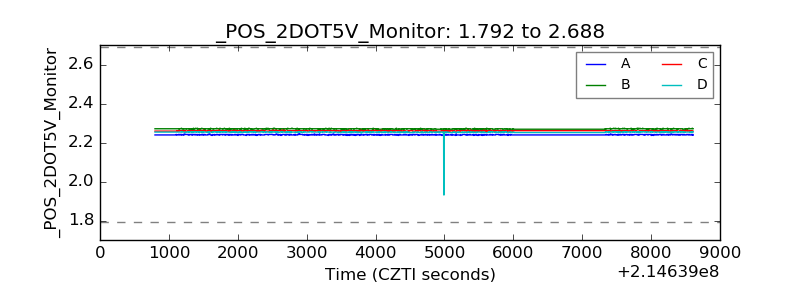 |
| +5 Volts monitor |  |
| _ROLL_ROT | 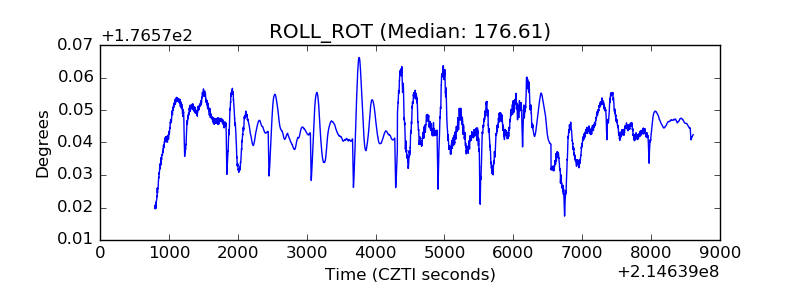 |
| _Roll_DEC | 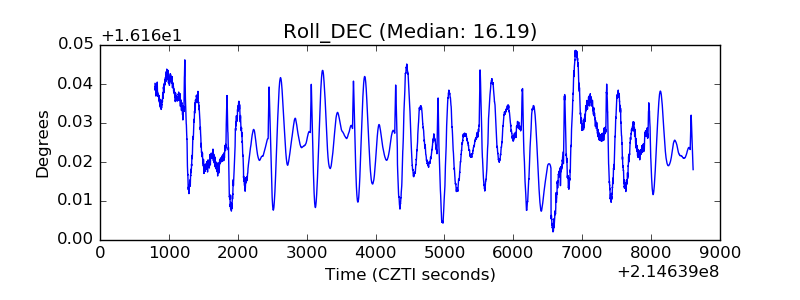 |
| _Roll_RA | 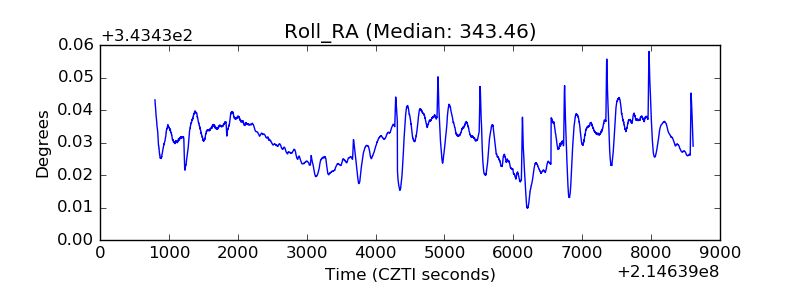 |
| Veto Counter | 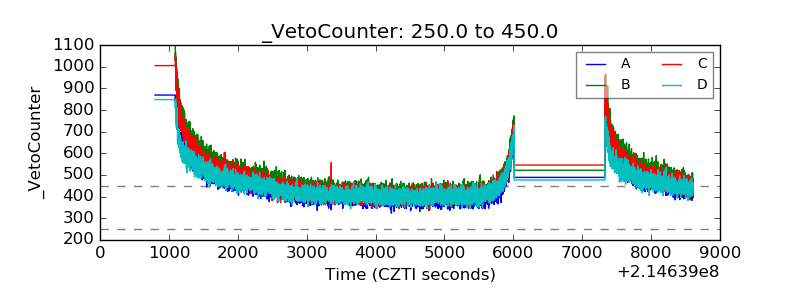 |