| Param | Original file | Final file |
|---|---|---|
| Filename | modeM0/AS1A02_149T01_9000000740_05747cztM0_level2.evt | modeM0/AS1A02_149T01_9000000740_05747cztM0_level2_quad_clean.evt |
| Size (bytes) | 455,109,120 | 67,193,280 |
| Size | 434.0 MB | 64.1 MB |
| Events in quadrant A | 3,194,522 | 401,423 |
| Events in quadrant B | 3,512,084 | 405,404 |
| Events in quadrant C | 3,120,666 | 404,595 |
| Events in quadrant D | 3,521,240 | 376,903 |
| Mode M9 | |||
|---|---|---|---|
| Quadrant | BADHDUFLAG | Total packets | Discarded packets |
| A | 0 | 25 | 0 |
| B | 0 | 25 | 0 |
| C | 0 | 25 | 0 |
| D | 0 | 25 | 0 |
| Mode SS | |||
|---|---|---|---|
| Quadrant | BADHDUFLAG | Total packets | Discarded packets |
| A | 0 | 130 | 0 |
| B | 0 | 130 | 0 |
| C | 0 | 130 | 0 |
| D | 0 | 130 | 0 |
| Mode M0 | |||
|---|---|---|---|
| Quadrant | BADHDUFLAG | Total packets | Discarded packets |
| A | 0 | 13391 | 5 |
| B | 0 | 14218 | 4 |
| C | 0 | 13347 | 6 |
| D | 0 | 14681 | 8 |
| Quadrant | Total seconds | Saturated seconds | Saturation percentage |
|---|---|---|---|
| A | 6401 | 111 | 1.734104% |
| B | 6401 | 133 | 2.077800% |
| C | 6400 | 75 | 1.171875% |
| D | 6400 | 163 | 2.546875% |
Noise dominated data is calculated using 1-second bins in cleaned event files. If a bin has >2000 counts, and if more than 50% of those come from <1% of pixels, then it is considered to be noise-dominated and hence unusable.
| Quadrant | # 1 sec bins | Bins with >0 counts | Bins with >2000 counts | High rate bins dominated by noise | Noise dominated (total time) | Noise dominated (detector-on time) | Marked lightcurve |
|---|---|---|---|---|---|---|---|
| A | 7627 | 6403 | 2 | 2 | 0.03% | 0.03% | 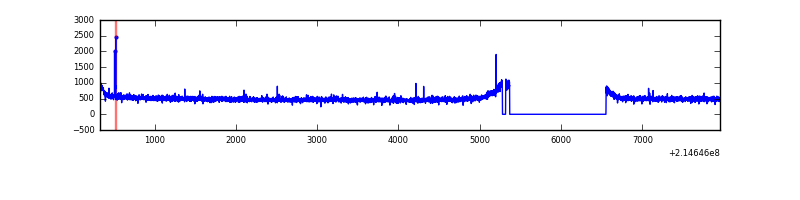 |
| B | 7627 | 6403 | 2 | 2 | 0.03% | 0.03% | 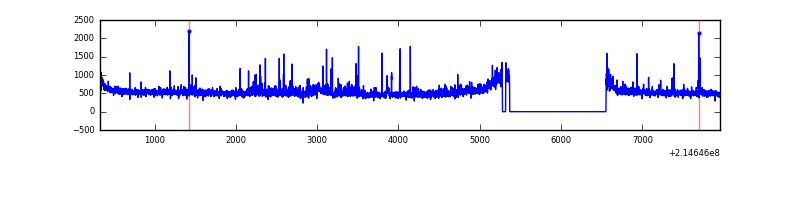 |
| C | 7627 | 6403 | 0 | 0 | 0.00% | 0.00% | 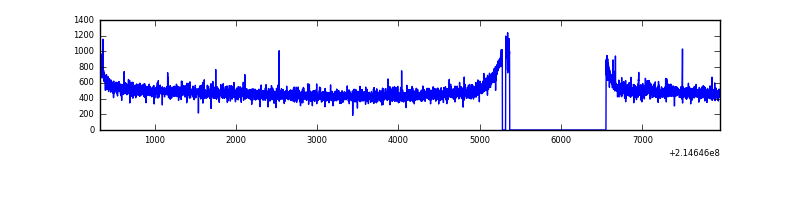 |
| D | 7627 | 6404 | 75 | 75 | 0.98% | 1.17% | 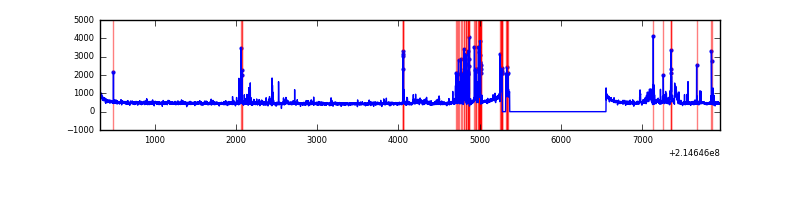 |
Top three noisy pixels from each quadrant. If the there are fewer than three noisy pixels in the level2.evt file, extra rows are filled as -1
| Pixel properties | Quadrant properties | ||||||
|---|---|---|---|---|---|---|---|
| Quadrant | DetID | PixID | Counts | Sigma | Mean | Median | Sigma |
| A | 15 | 236 | 11450 | 63.5 | 823 | 807 | 167.6 |
| A | 14 | 111 | 9597 | 52.44 | 823 | 807 | 167.6 |
| A | 0 | 226 | 8074 | 43.36 | 823 | 807 | 167.6 |
| B | 15 | 204 | 101961 | 639.64 | 830 | 814 | 158.1 |
| B | 11 | 51 | 57019 | 355.44 | 830 | 814 | 158.1 |
| B | 0 | 219 | 46624 | 289.7 | 830 | 814 | 158.1 |
| C | 9 | 16 | 19796 | 103.48 | 793 | 798 | 183.6 |
| C | 13 | 61 | 6336 | 30.17 | 793 | 798 | 183.6 |
| C | 14 | 67 | 3335 | 13.82 | 793 | 798 | 183.6 |
| D | 4 | 95 | 357059 | 1869.61 | 785 | 762 | 190.6 |
| D | 13 | 61 | 53475 | 276.6 | 785 | 762 | 190.6 |
| D | 2 | 206 | 33776 | 173.24 | 785 | 762 | 190.6 |
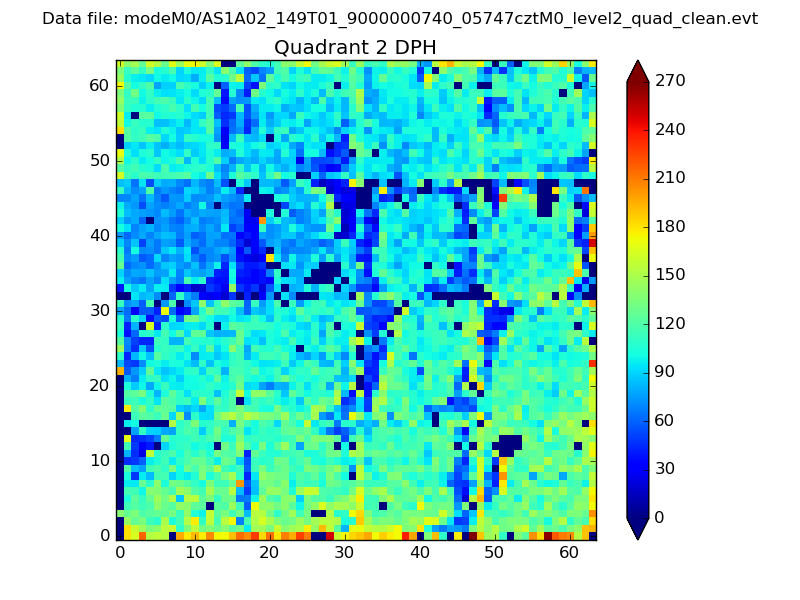
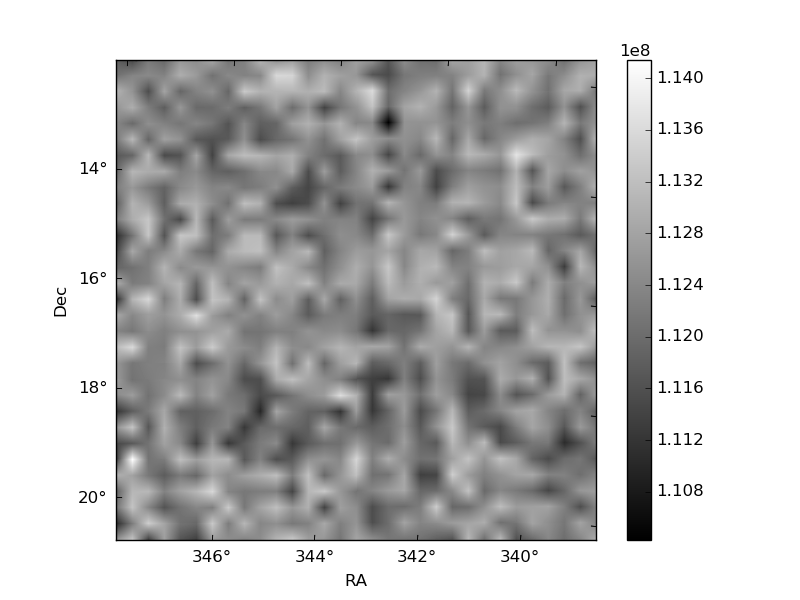
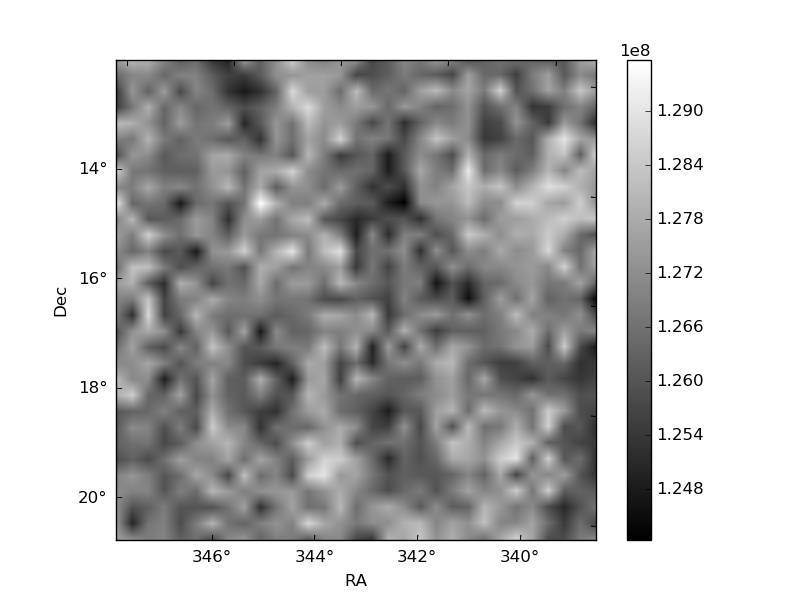
Histogram calculated using DETX and DETY for each event in the final _common_clean file
| Quadrant A | 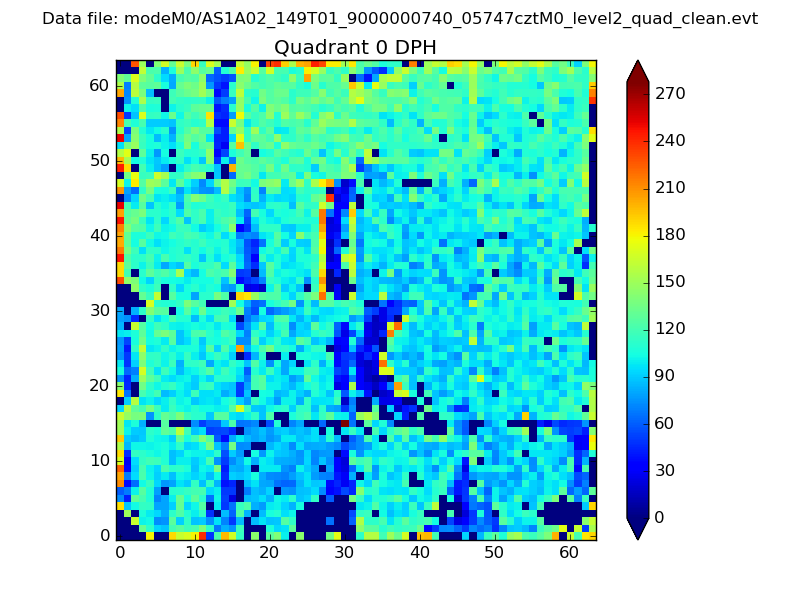 |
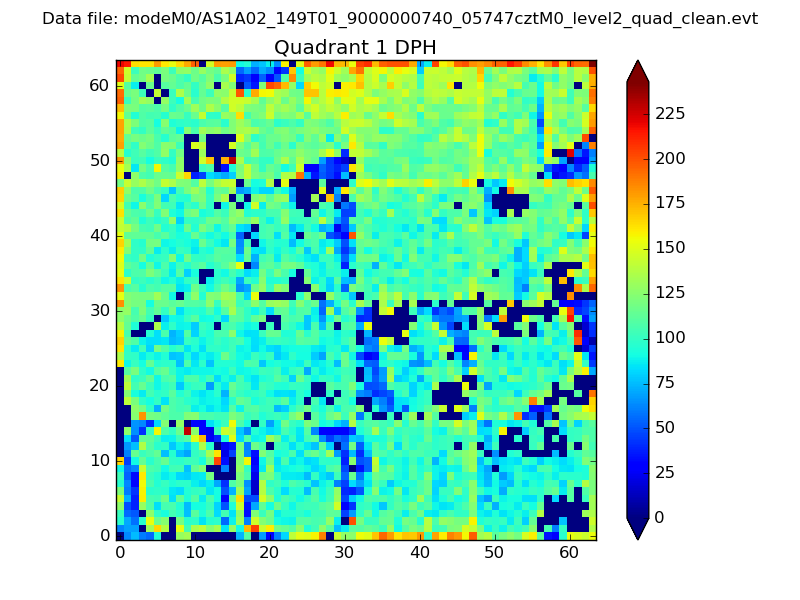 |
Quadrant B |
|---|---|---|---|
| Quadrant D | 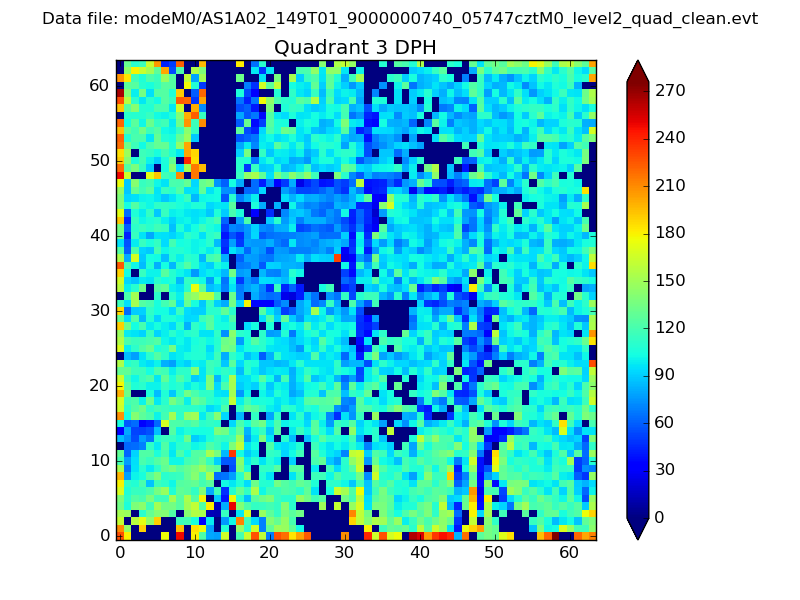 |
 |
Quadrant C |
| Plot type | Count rate plots | Images |
|---|---|---|
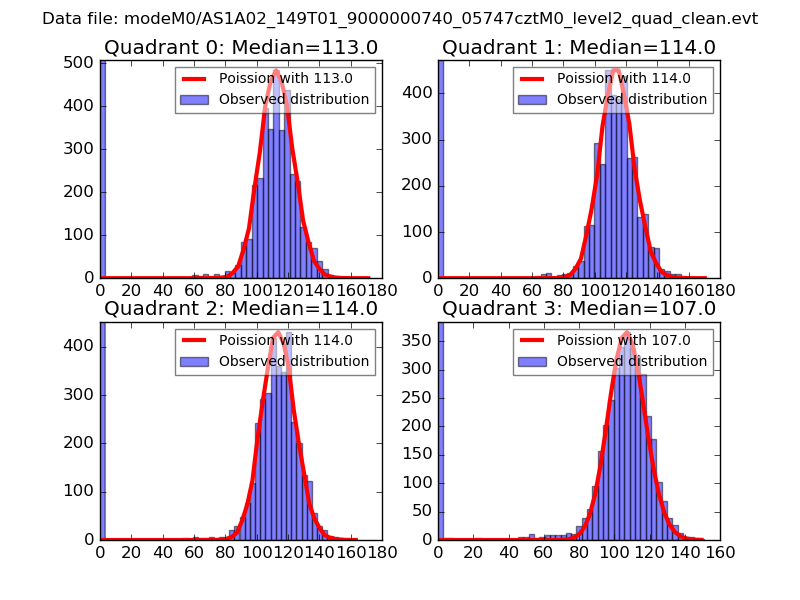
| Comparison with Poisson distribution Blue bars denote a histogram of data divided into 1 sec bins. Red curve is a Poisson curve with rate = median count rate of data. |
 |
 |
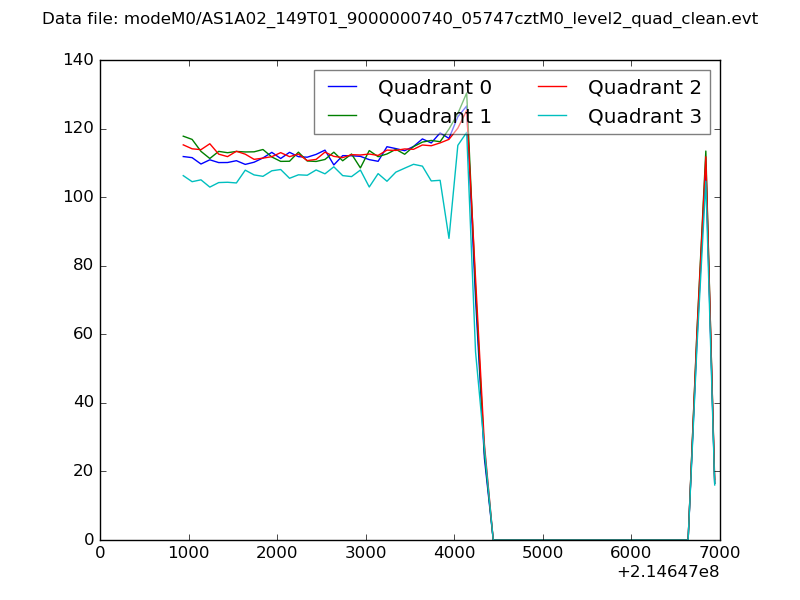
| Quadrant-wise count rates Data is divided into 100 sec bins |
 |
|
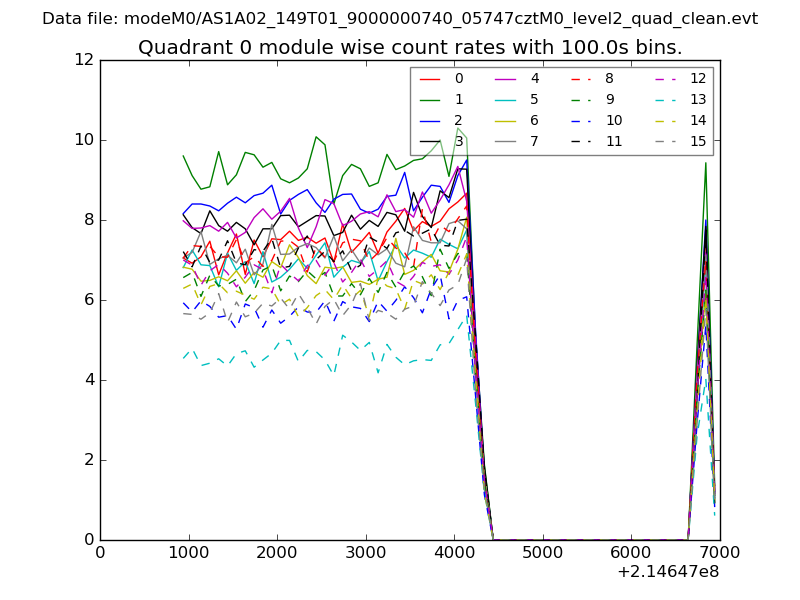
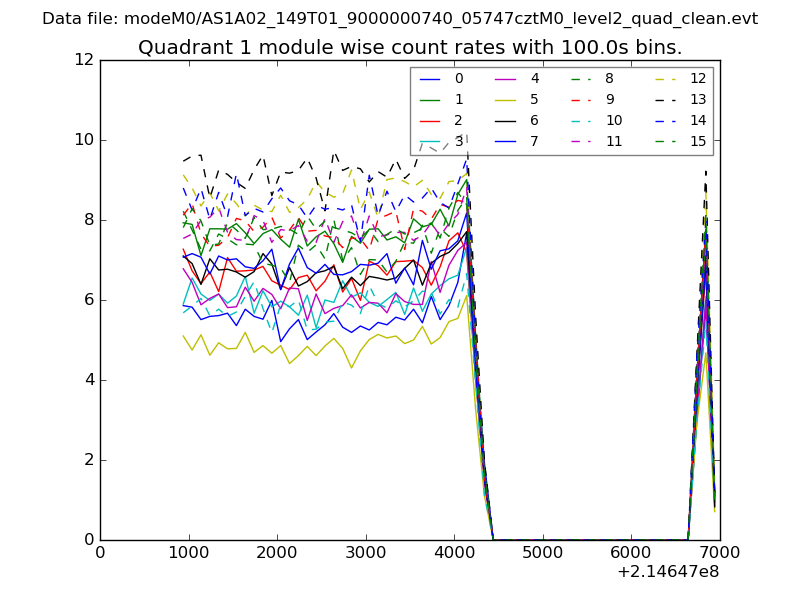
| Module-wise count rates for Quadrant A Data is divided into 100 sec bins |
 |
 |
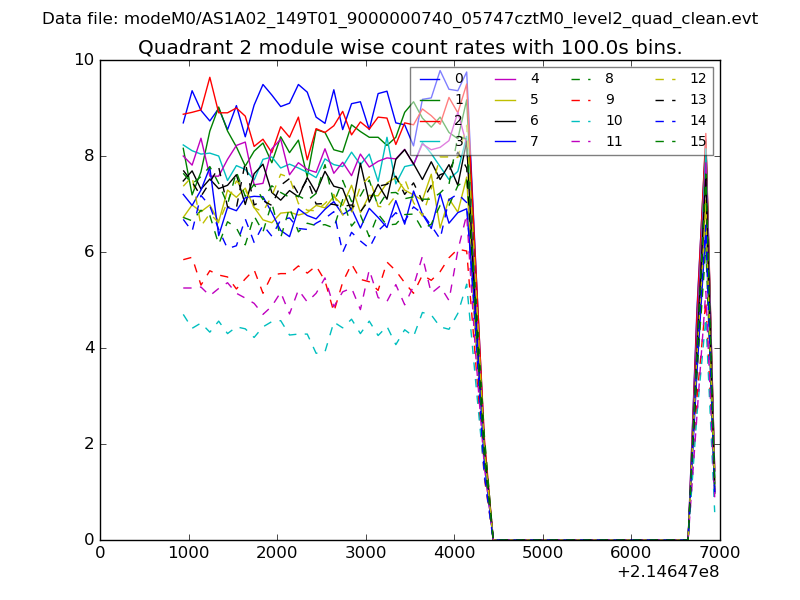
| Module-wise count rates for Quadrant B Data is divided into 100 sec bins |
 |
 |
| Module-wise count rates for Quadrant C Data is divided into 100 sec bins |
 |
 |
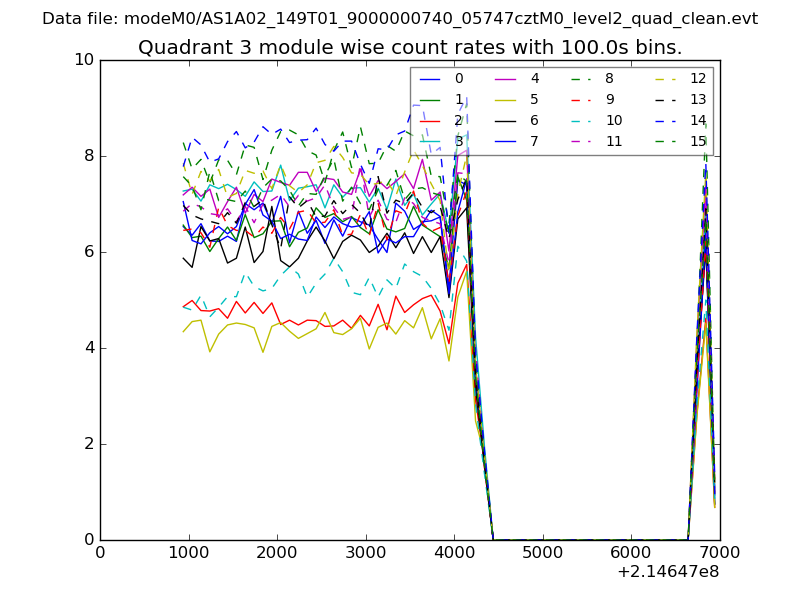
| Module-wise count rates for Quadrant D Data is divided into 100 sec bins |
 |
 |
| Parameter | Plot |
|---|---|
| CZT HV Monitor | 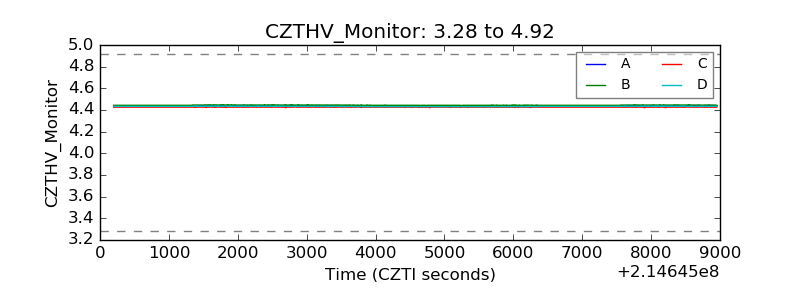 |
| D_VDD | 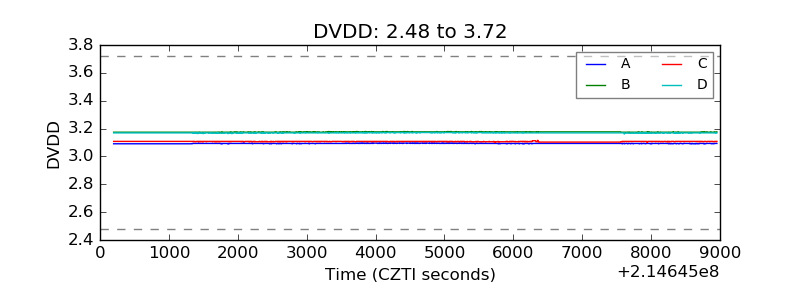 |
| Temperature 1 | 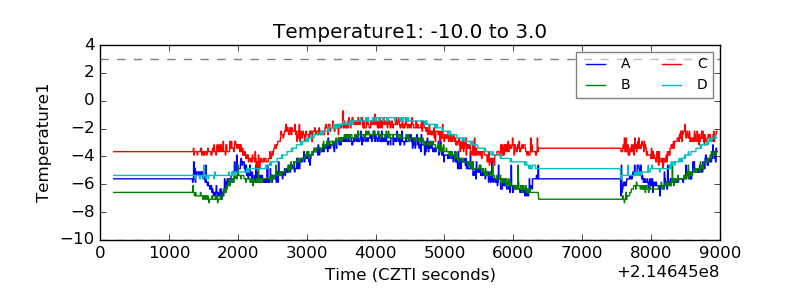 |
| Veto HV Monitor | 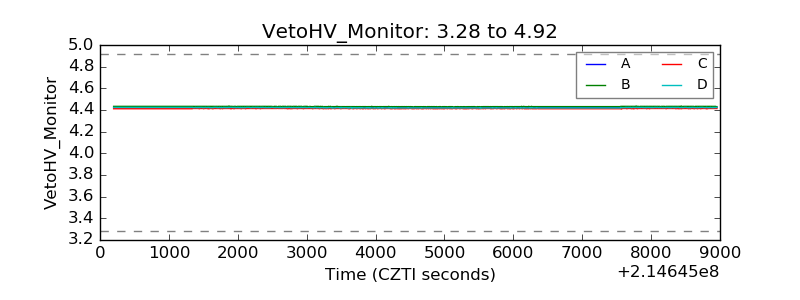 |
| Veto LLD | 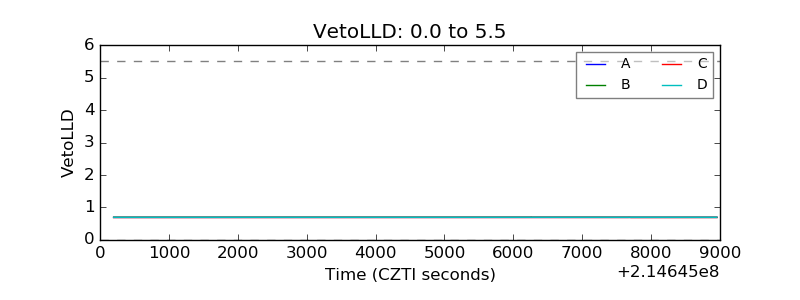 |
| Alpha Counter | 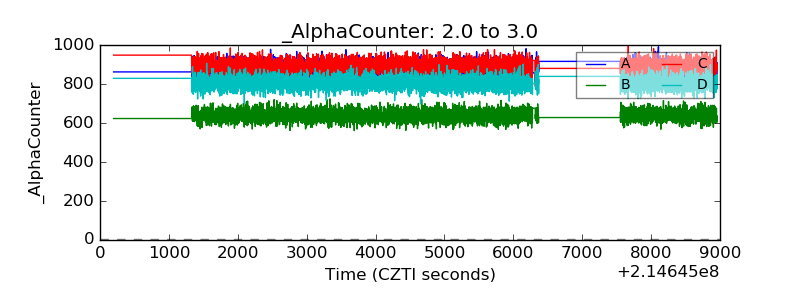 |
| _CPM_Rate | 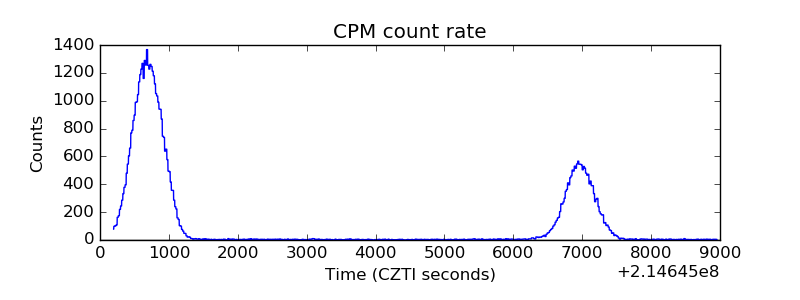 |
| CZT Counter | 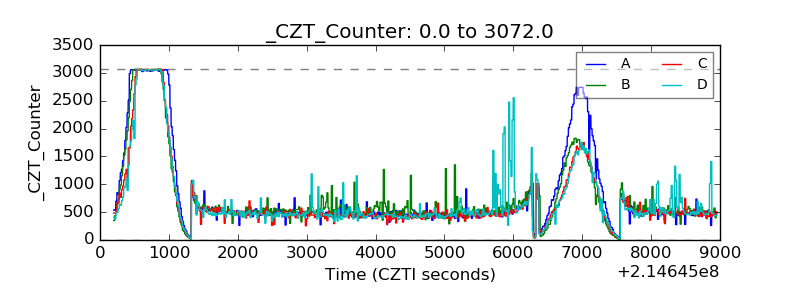 |
| +2.5 Volts monitor |  |
| +5 Volts monitor |  |
| _ROLL_ROT | 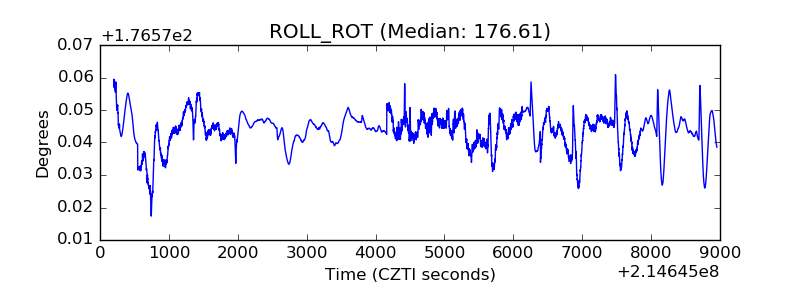 |
| _Roll_DEC | 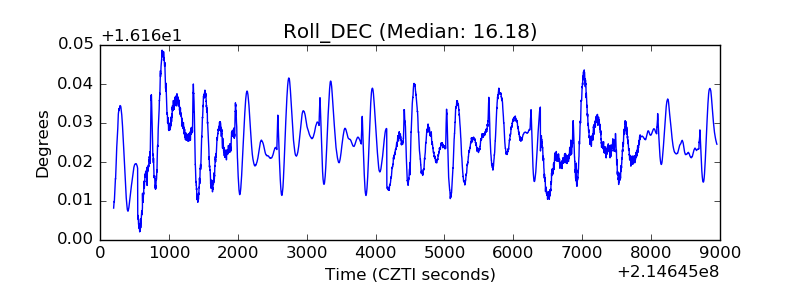 |
| _Roll_RA | 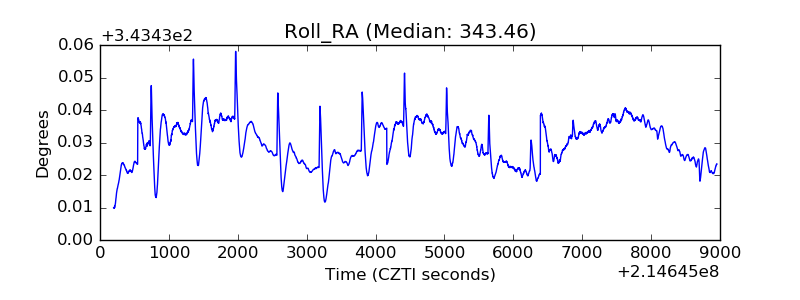 |
| Veto Counter | 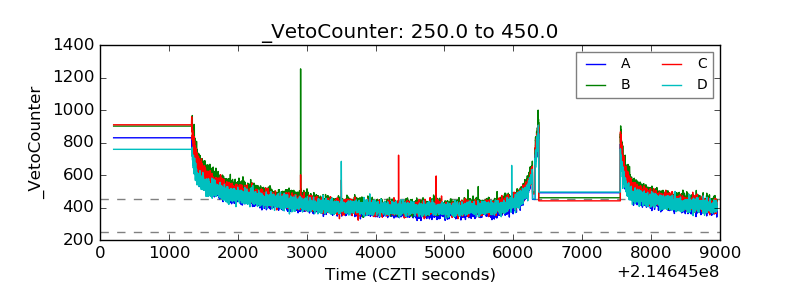 |