| Param | Original file | Final file |
|---|---|---|
| Filename | modeM0/AS1A02_149T01_9000000740_05750cztM0_level2.evt | modeM0/AS1A02_149T01_9000000740_05750cztM0_level2_quad_clean.evt |
| Size (bytes) | 476,648,640 | 83,053,440 |
| Size | 454.6 MB | 79.2 MB |
| Events in quadrant A | 3,398,906 | 504,338 |
| Events in quadrant B | 3,631,536 | 506,085 |
| Events in quadrant C | 3,338,281 | 512,527 |
| Events in quadrant D | 3,575,166 | 489,134 |
| Mode SS | |||
|---|---|---|---|
| Quadrant | BADHDUFLAG | Total packets | Discarded packets |
| A | 0 | 146 | 2 |
| B | 0 | 146 | 2 |
| C | 0 | 145 | 0 |
| D | 0 | 146 | 2 |
| Mode M0 | |||
|---|---|---|---|
| Quadrant | BADHDUFLAG | Total packets | Discarded packets |
| A | 0 | 15229 | 150 |
| B | 0 | 15562 | 151 |
| C | 0 | 15181 | 129 |
| D | 0 | 15723 | 169 |
| Quadrant | Total seconds | Saturated seconds | Saturation percentage |
|---|---|---|---|
| A | 7223 | 189 | 2.616641% |
| B | 7225 | 163 | 2.256055% |
| C | 7233 | 53 | 0.732753% |
| D | 7222 | 105 | 1.453891% |
Noise dominated data is calculated using 1-second bins in cleaned event files. If a bin has >2000 counts, and if more than 50% of those come from <1% of pixels, then it is considered to be noise-dominated and hence unusable.
| Quadrant | # 1 sec bins | Bins with >0 counts | Bins with >2000 counts | High rate bins dominated by noise | Noise dominated (total time) | Noise dominated (detector-on time) | Marked lightcurve |
|---|---|---|---|---|---|---|---|
| A | 7296 | 7293 | 1 | 1 | 0.01% | 0.01% | 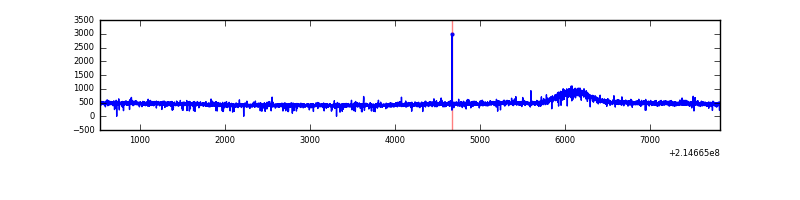 |
| B | 7296 | 7294 | 5 | 5 | 0.07% | 0.07% | 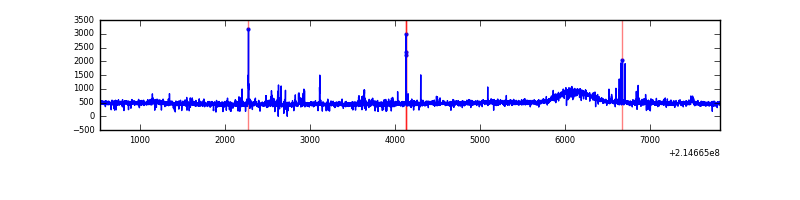 |
| C | 7296 | 7295 | 1 | 1 | 0.01% | 0.01% | 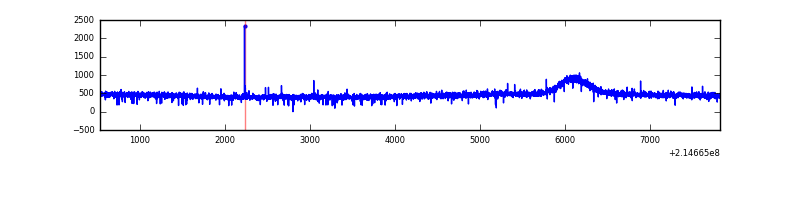 |
| D | 7296 | 7293 | 26 | 26 | 0.36% | 0.36% | 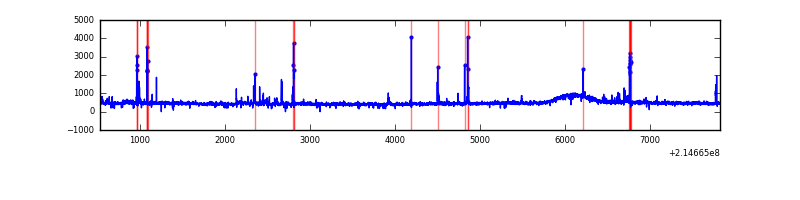 |
Top three noisy pixels from each quadrant. If the there are fewer than three noisy pixels in the level2.evt file, extra rows are filled as -1
| Pixel properties | Quadrant properties | ||||||
|---|---|---|---|---|---|---|---|
| Quadrant | DetID | PixID | Counts | Sigma | Mean | Median | Sigma |
| A | 15 | 236 | 15070 | 77.92 | 877 | 854 | 182.5 |
| A | 0 | 226 | 8739 | 43.22 | 877 | 854 | 182.5 |
| A | 12 | 194 | 8604 | 42.48 | 877 | 854 | 182.5 |
| B | 11 | 51 | 52490 | 297.72 | 882 | 859 | 173.4 |
| B | 15 | 204 | 40248 | 227.13 | 882 | 859 | 173.4 |
| B | 0 | 219 | 36887 | 207.75 | 882 | 859 | 173.4 |
| C | 13 | 61 | 6840 | 30.03 | 852 | 857 | 199.3 |
| C | 5 | 250 | 6118 | 26.4 | 852 | 857 | 199.3 |
| C | 14 | 67 | 4994 | 20.76 | 852 | 857 | 199.3 |
| D | 2 | 14 | 81173 | 381.13 | 854 | 825 | 210.8 |
| D | 5 | 233 | 72203 | 338.58 | 854 | 825 | 210.8 |
| D | 8 | 195 | 44206 | 205.78 | 854 | 825 | 210.8 |
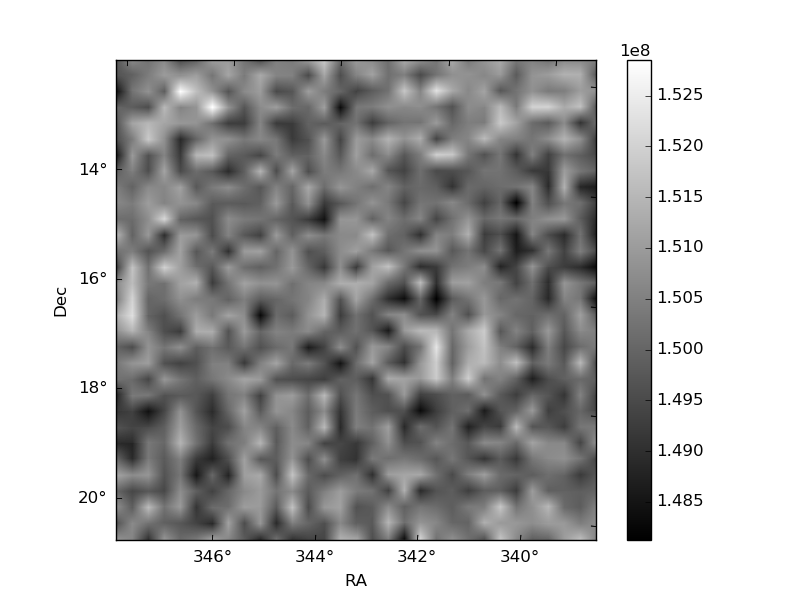
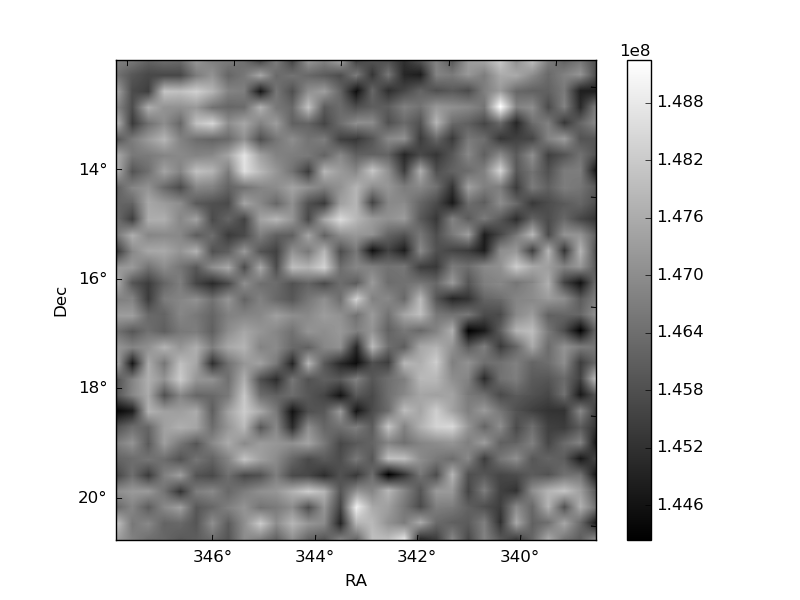
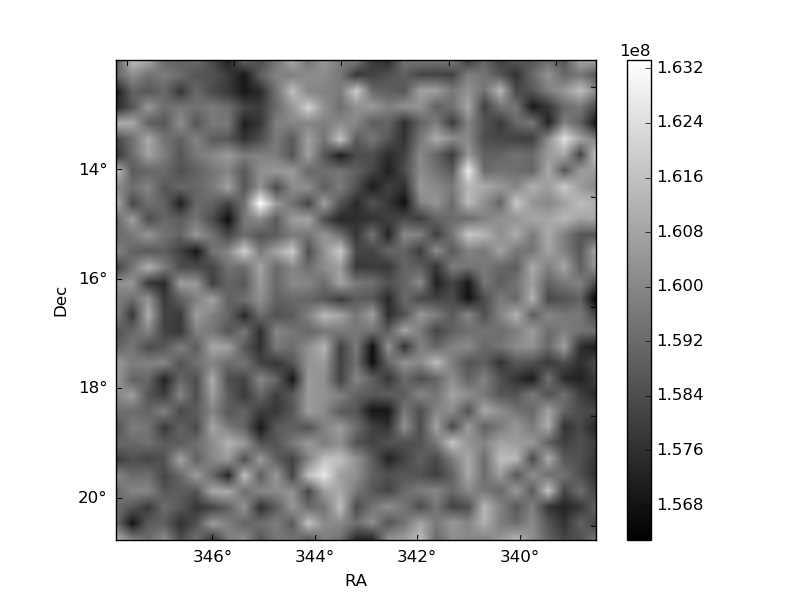
Histogram calculated using DETX and DETY for each event in the final _common_clean file
| Quadrant A | 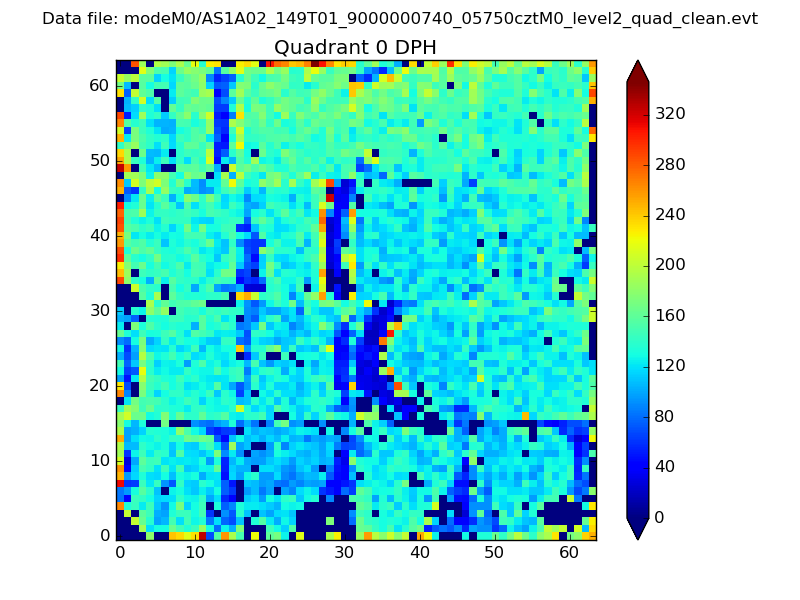 |
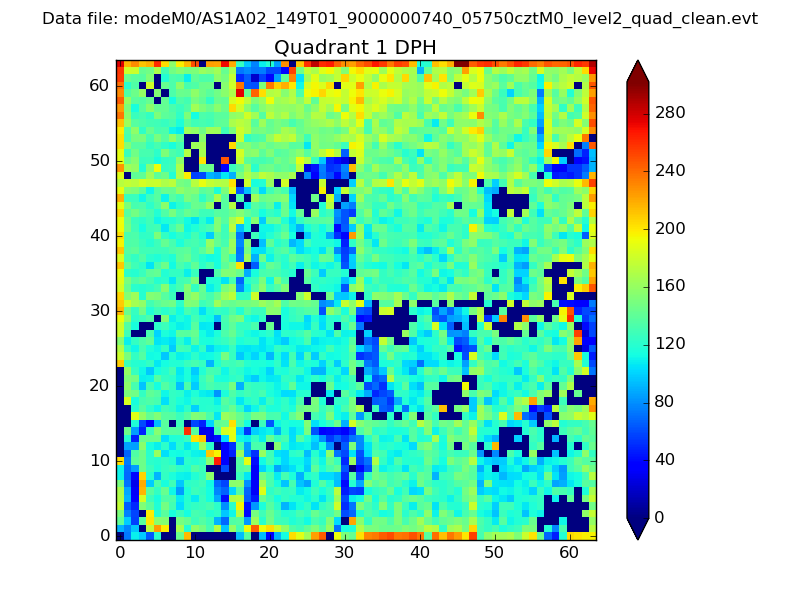 |
Quadrant B |
|---|---|---|---|
| Quadrant D | 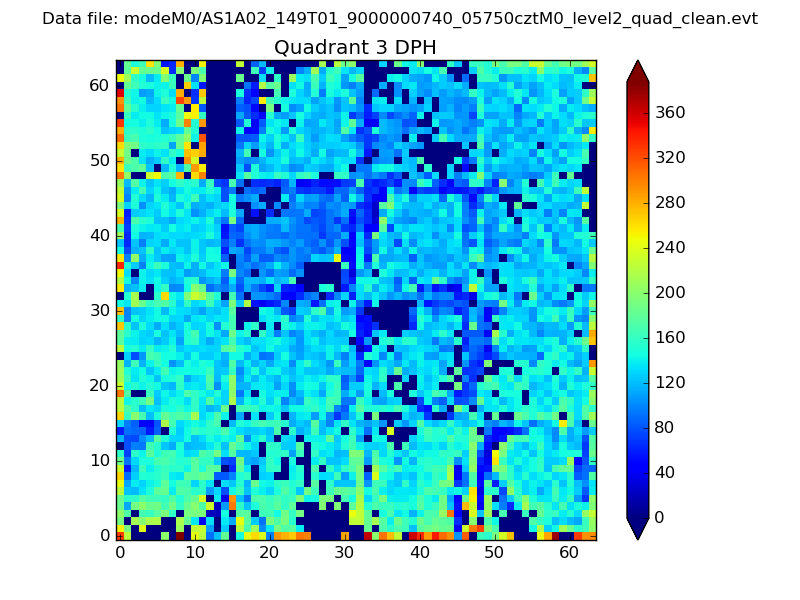 |
 |
Quadrant C |
| Plot type | Count rate plots | Images |
|---|---|---|
| Comparison with Poisson distribution Blue bars denote a histogram of data divided into 1 sec bins. Red curve is a Poisson curve with rate = median count rate of data. |
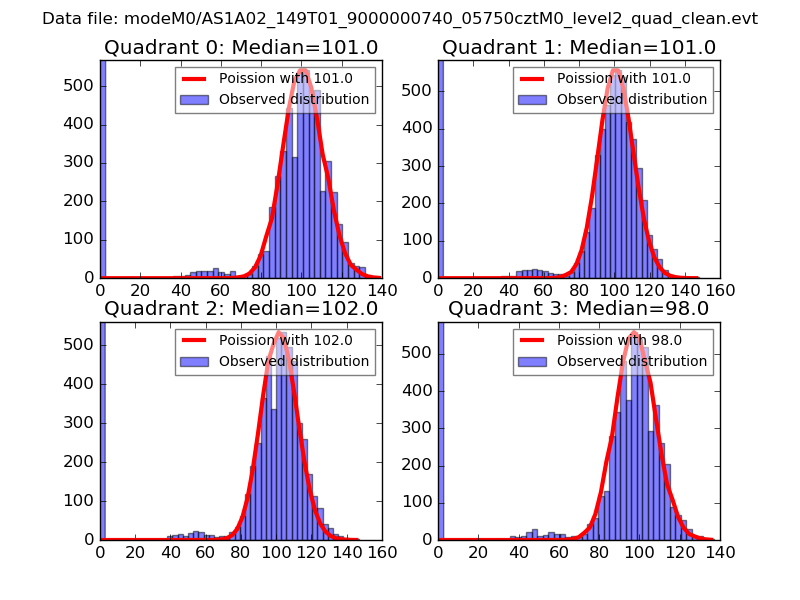 |
 |
| Quadrant-wise count rates Data is divided into 100 sec bins |
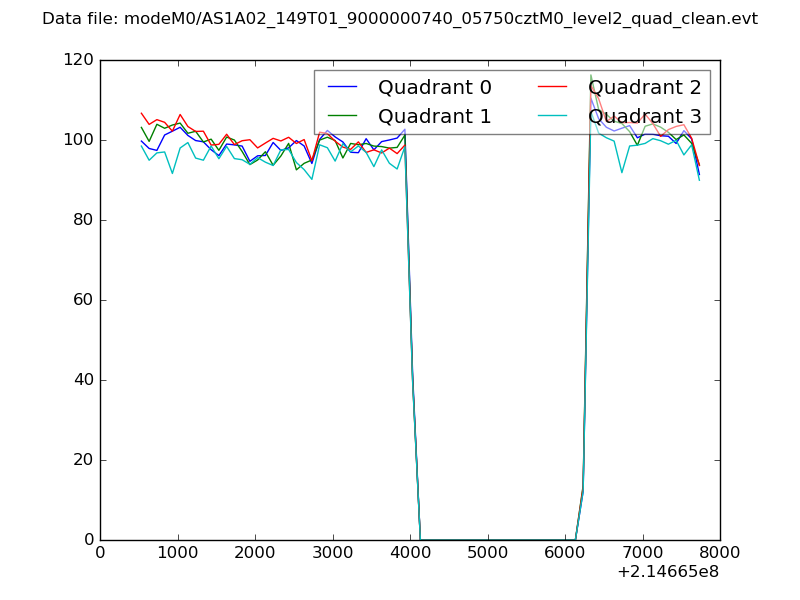 |
|
| Module-wise count rates for Quadrant A Data is divided into 100 sec bins |
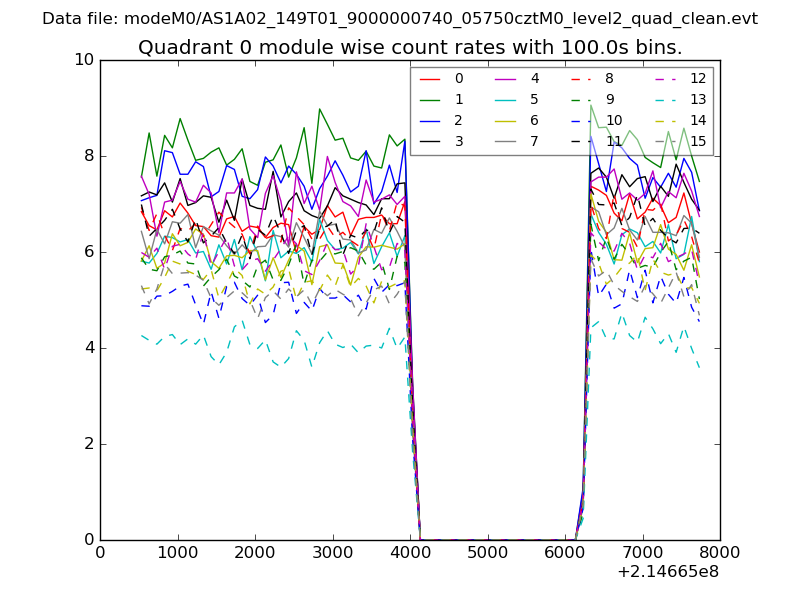 |
 |
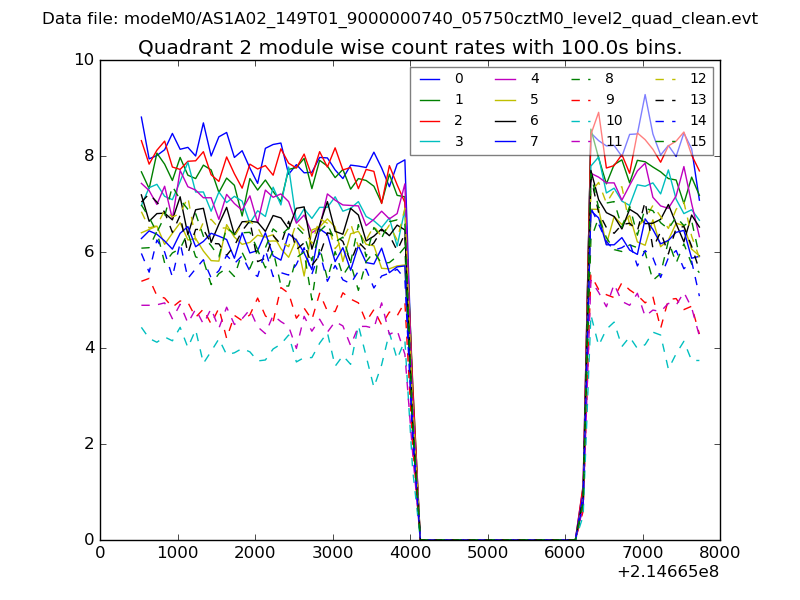
| Module-wise count rates for Quadrant B Data is divided into 100 sec bins |
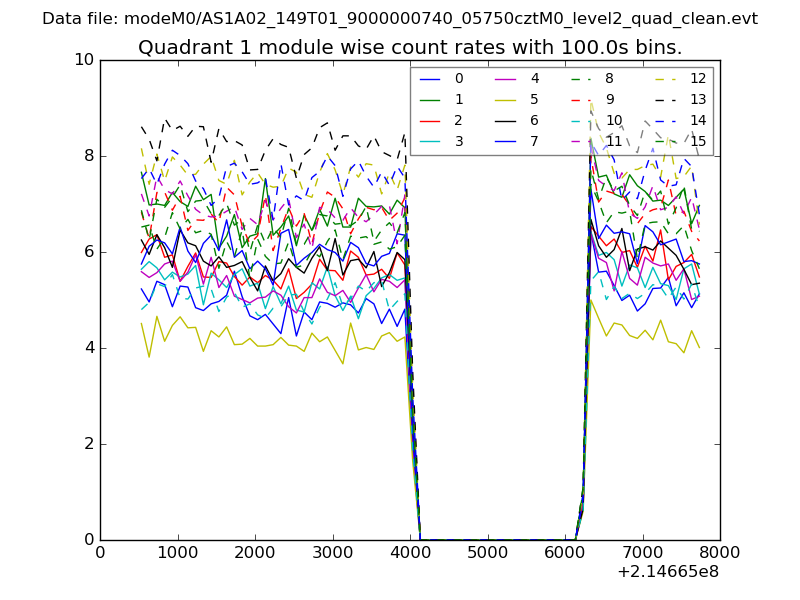 |
 |
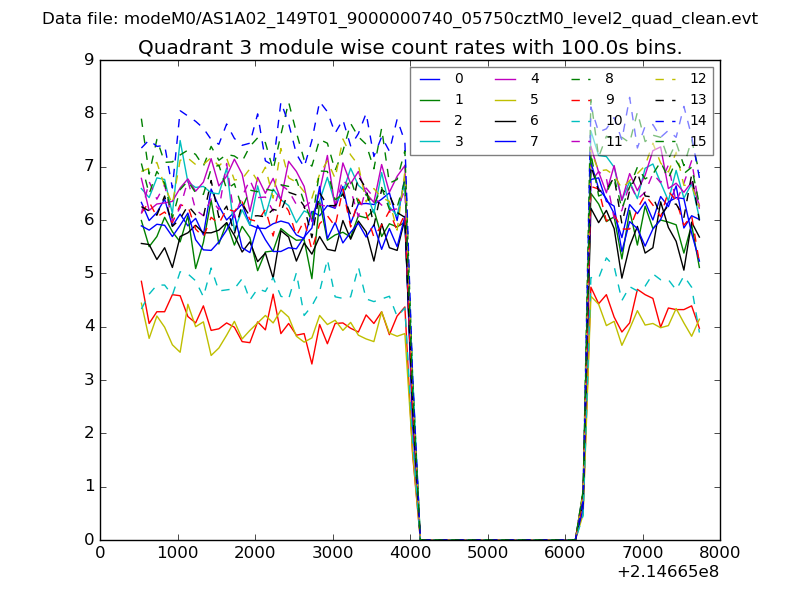
| Module-wise count rates for Quadrant C Data is divided into 100 sec bins |
 |
 |
| Module-wise count rates for Quadrant D Data is divided into 100 sec bins |
 |
 |
| Parameter | Plot |
|---|---|
| CZT HV Monitor | 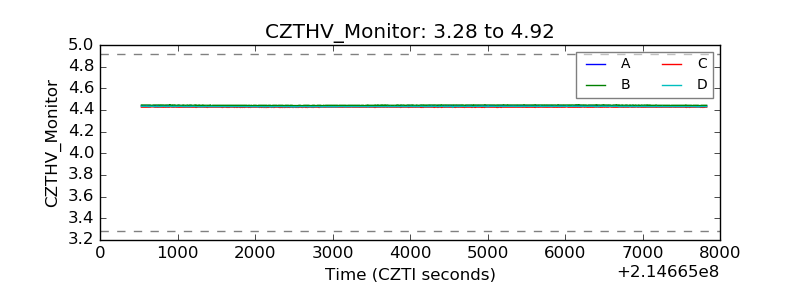 |
| D_VDD | 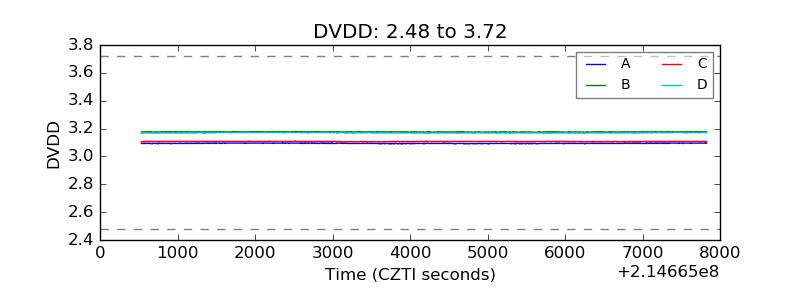 |
| Temperature 1 | 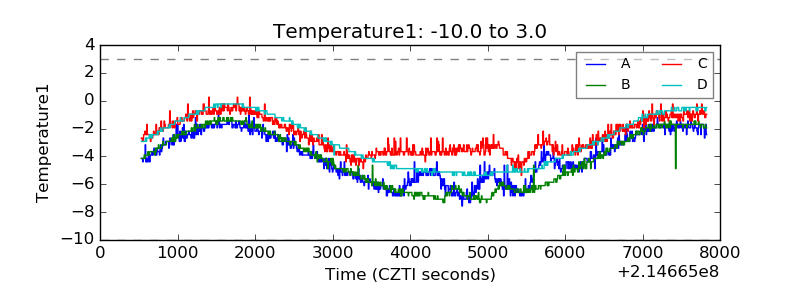 |
| Veto HV Monitor | 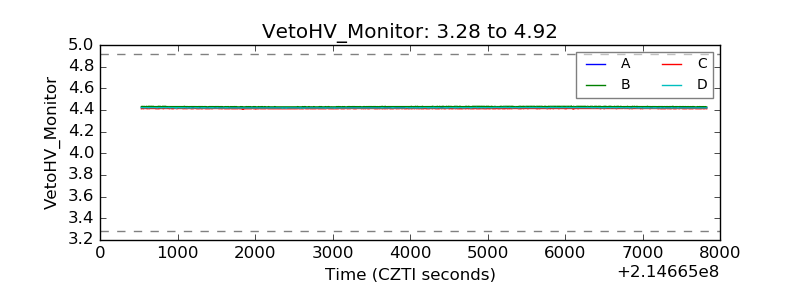 |
| Veto LLD | 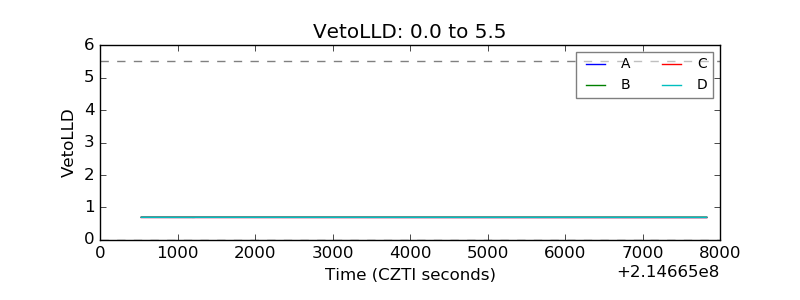 |
| Alpha Counter | 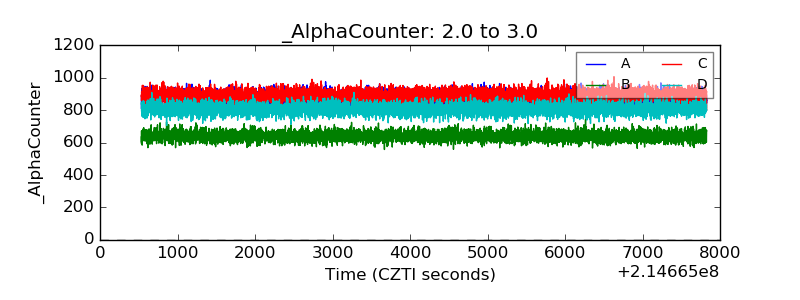 |
| _CPM_Rate | 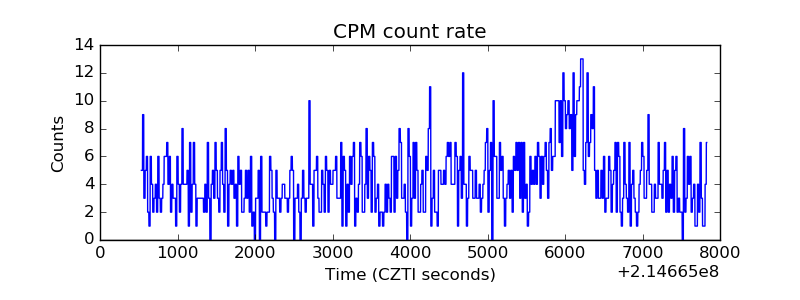 |
| CZT Counter |  |
| +2.5 Volts monitor |  |
| +5 Volts monitor | 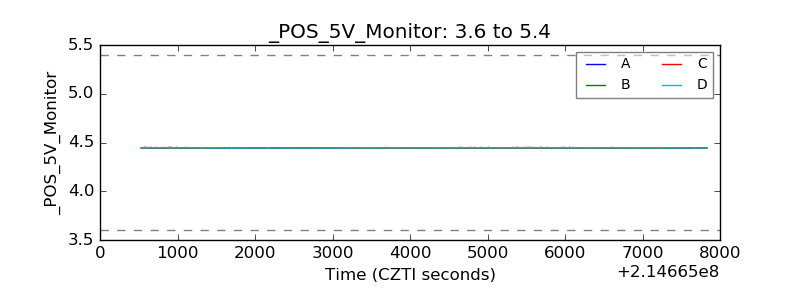 |
| _ROLL_ROT | 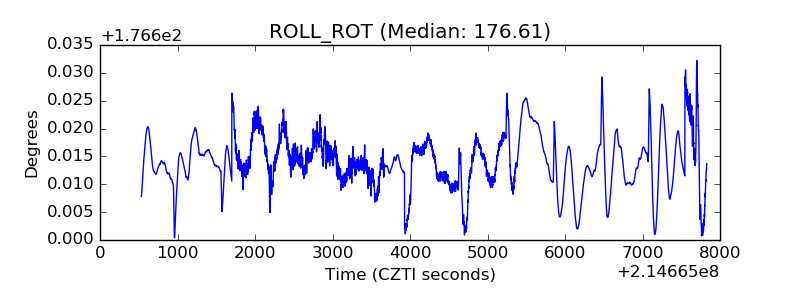 |
| _Roll_DEC | 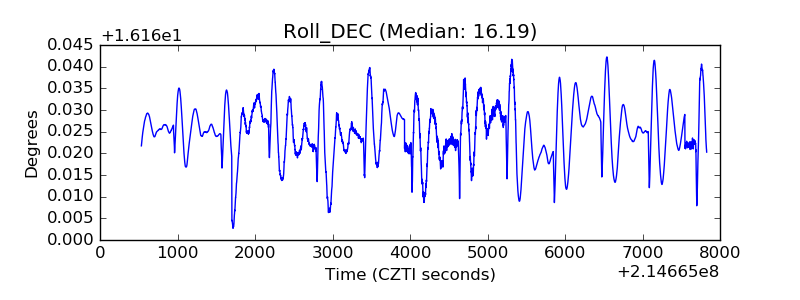 |
| _Roll_RA |  |
| Veto Counter | 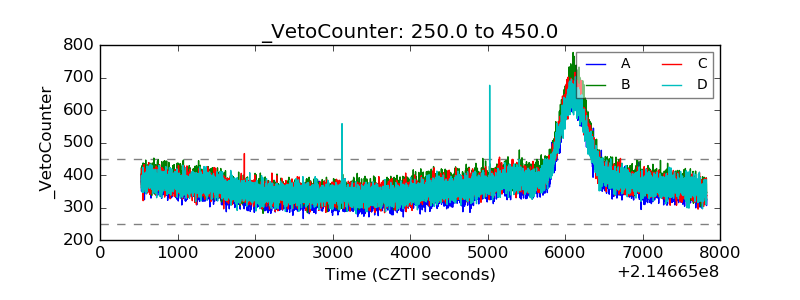 |