| Param | Original file | Final file |
|---|---|---|
| Filename | modeM0/AS1A02_149T01_9000000740_05751cztM0_level2.evt | modeM0/AS1A02_149T01_9000000740_05751cztM0_level2_quad_clean.evt |
| Size (bytes) | 552,009,600 | 95,397,120 |
| Size | 526.4 MB | 91.0 MB |
| Events in quadrant A | 3,925,622 | 580,531 |
| Events in quadrant B | 4,212,062 | 585,449 |
| Events in quadrant C | 3,874,114 | 590,892 |
| Events in quadrant D | 4,150,099 | 563,526 |
| Mode SS | |||
|---|---|---|---|
| Quadrant | BADHDUFLAG | Total packets | Discarded packets |
| A | 0 | 166 | 2 |
| B | 0 | 166 | 2 |
| C | 0 | 166 | 4 |
| D | 0 | 166 | 4 |
| Mode M0 | |||
|---|---|---|---|
| Quadrant | BADHDUFLAG | Total packets | Discarded packets |
| A | 0 | 17523 | 153 |
| B | 0 | 17928 | 158 |
| C | 0 | 17440 | 160 |
| D | 0 | 17936 | 156 |
| Quadrant | Total seconds | Saturated seconds | Saturation percentage |
|---|---|---|---|
| A | 8181 | 272 | 3.324777% |
| B | 8186 | 270 | 3.298314% |
| C | 8177 | 85 | 1.039501% |
| D | 8181 | 119 | 1.454590% |
Noise dominated data is calculated using 1-second bins in cleaned event files. If a bin has >2000 counts, and if more than 50% of those come from <1% of pixels, then it is considered to be noise-dominated and hence unusable.
| Quadrant | # 1 sec bins | Bins with >0 counts | Bins with >2000 counts | High rate bins dominated by noise | Noise dominated (total time) | Noise dominated (detector-on time) | Marked lightcurve |
|---|---|---|---|---|---|---|---|
| A | 8277 | 8254 | 0 | 0 | 0.00% | 0.00% |  |
| B | 8277 | 8249 | 3 | 3 | 0.04% | 0.04% |  |
| C | 8277 | 8247 | 0 | 0 | 0.00% | 0.00% | 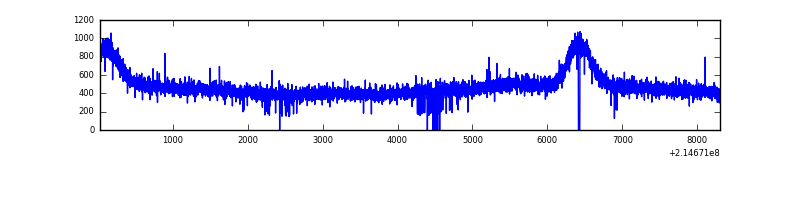 |
| D | 8277 | 8253 | 16 | 16 | 0.19% | 0.19% | 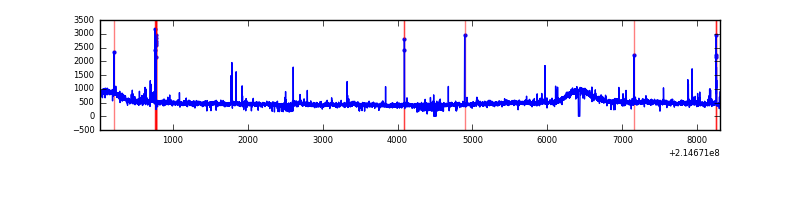 |
Top three noisy pixels from each quadrant. If the there are fewer than three noisy pixels in the level2.evt file, extra rows are filled as -1
| Pixel properties | Quadrant properties | ||||||
|---|---|---|---|---|---|---|---|
| Quadrant | DetID | PixID | Counts | Sigma | Mean | Median | Sigma |
| A | 12 | 194 | 10157 | 43.54 | 1017 | 991 | 210.5 |
| A | 0 | 226 | 9998 | 42.78 | 1017 | 991 | 210.5 |
| A | 15 | 236 | 7635 | 31.56 | 1017 | 991 | 210.5 |
| B | 15 | 204 | 86079 | 420.19 | 1023 | 996 | 202.5 |
| B | 11 | 51 | 54104 | 262.28 | 1023 | 996 | 202.5 |
| B | 0 | 229 | 34109 | 163.53 | 1023 | 996 | 202.5 |
| C | 14 | 67 | 14230 | 56.98 | 987 | 993 | 232.3 |
| C | 13 | 61 | 7923 | 29.83 | 987 | 993 | 232.3 |
| C | 8 | 128 | 4952 | 17.04 | 987 | 993 | 232.3 |
| D | 8 | 195 | 82365 | 333.19 | 989 | 957 | 244.3 |
| D | 5 | 233 | 60865 | 245.19 | 989 | 957 | 244.3 |
| D | 12 | 221 | 59178 | 238.29 | 989 | 957 | 244.3 |
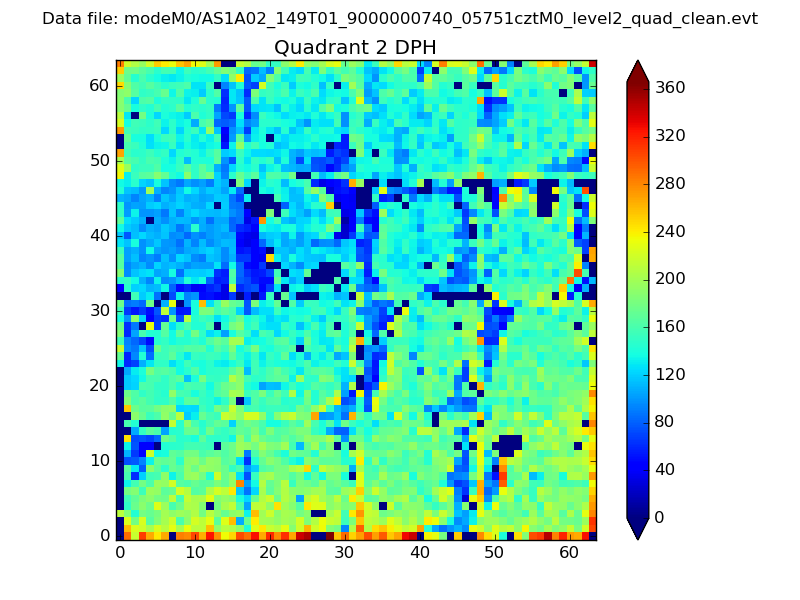
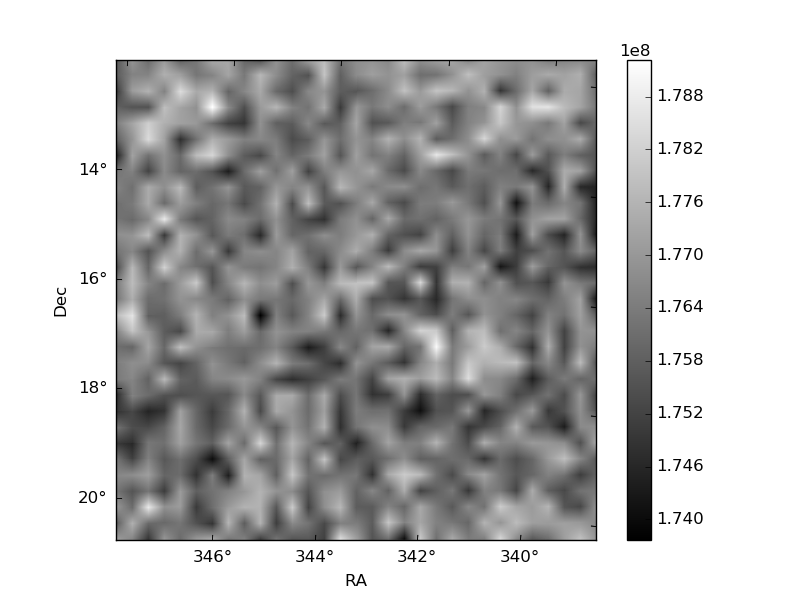
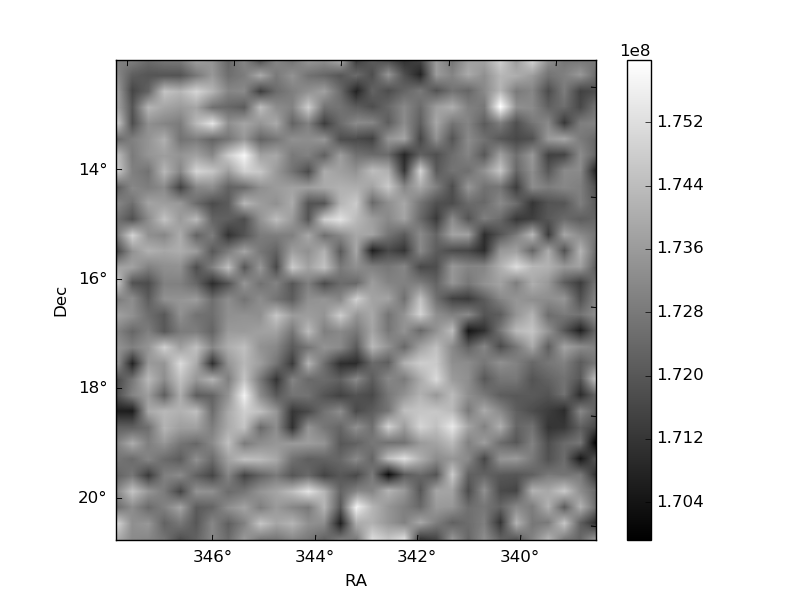
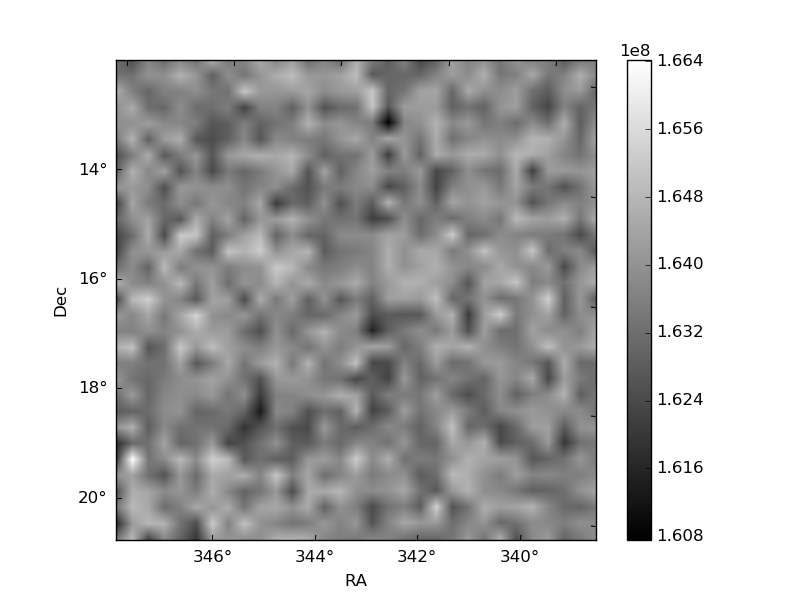
Histogram calculated using DETX and DETY for each event in the final _common_clean file
| Quadrant A | 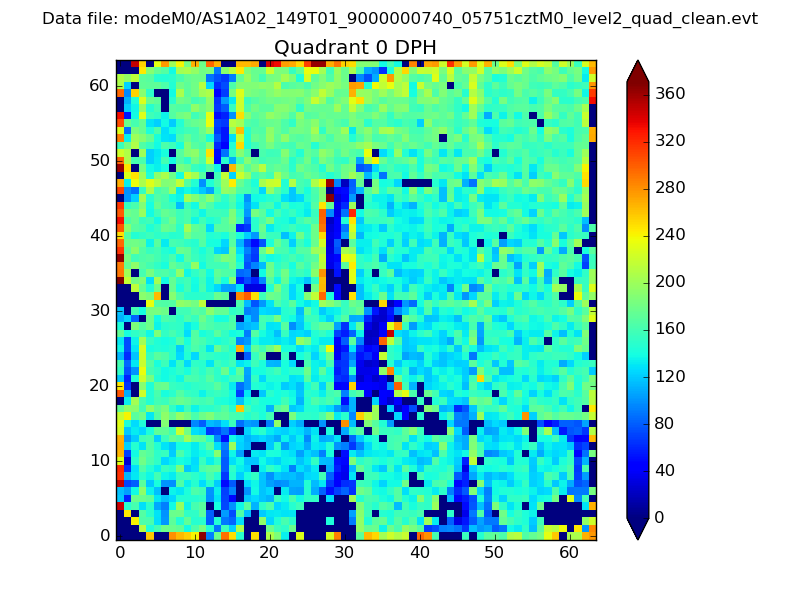 |
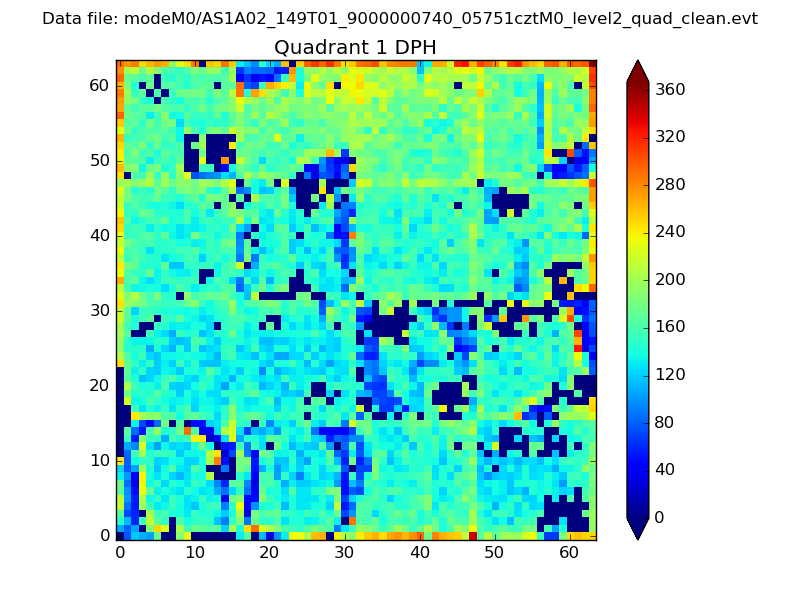 |
Quadrant B |
|---|---|---|---|
| Quadrant D | 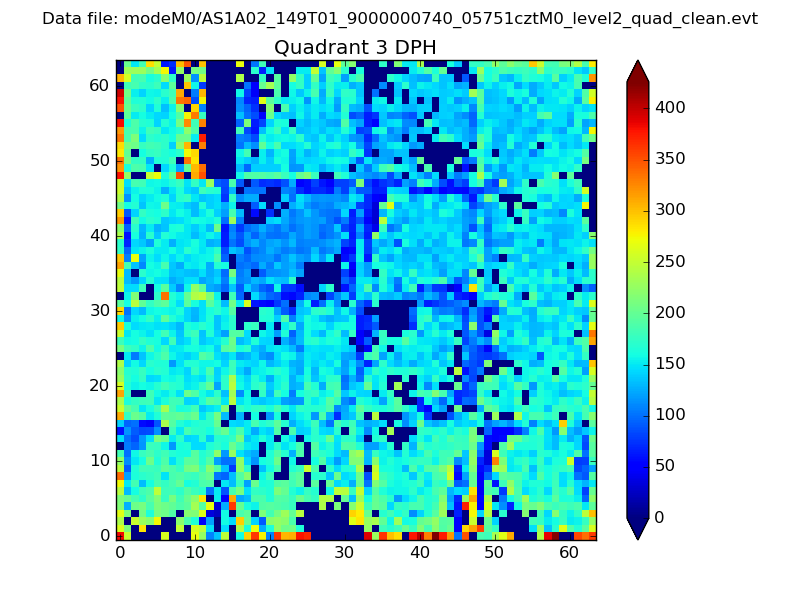 |
 |
Quadrant C |
| Plot type | Count rate plots | Images |
|---|---|---|
| Comparison with Poisson distribution Blue bars denote a histogram of data divided into 1 sec bins. Red curve is a Poisson curve with rate = median count rate of data. |
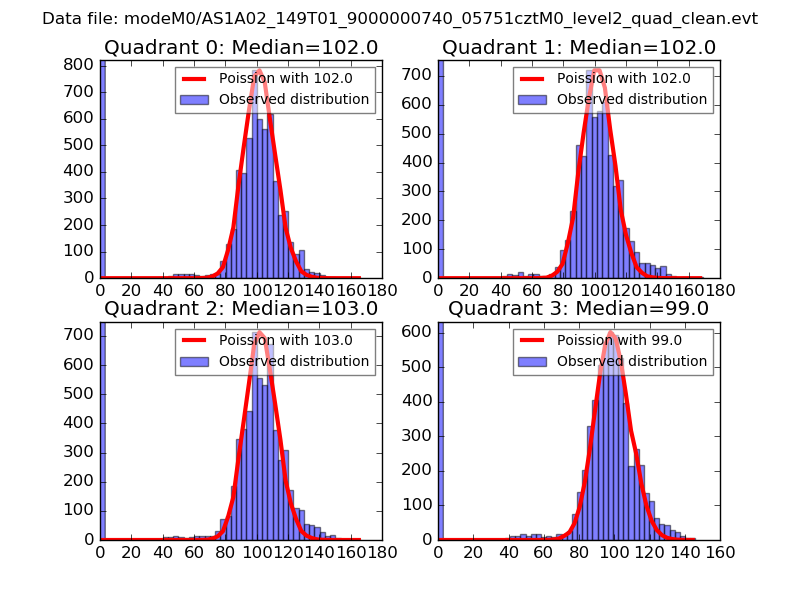 |
 |
| Quadrant-wise count rates Data is divided into 100 sec bins |
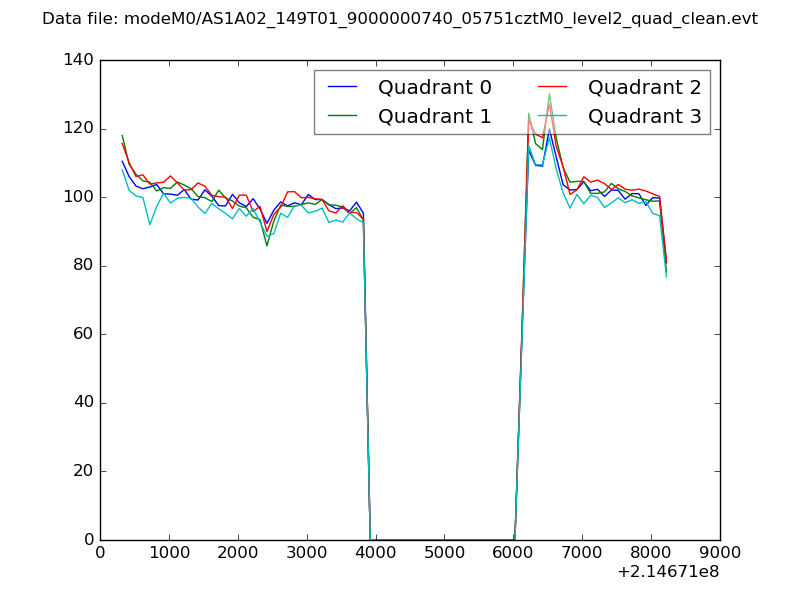 |
|
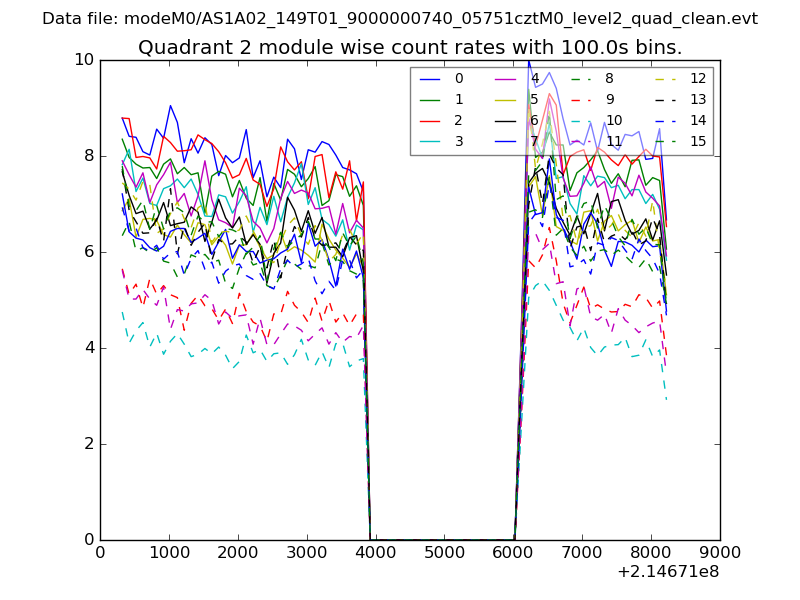
| Module-wise count rates for Quadrant A Data is divided into 100 sec bins |
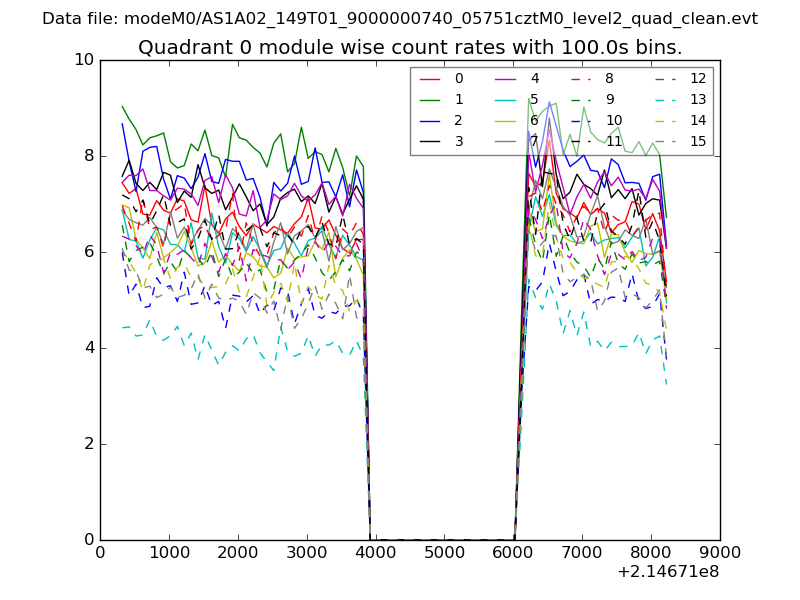 |
 |
| Module-wise count rates for Quadrant B Data is divided into 100 sec bins |
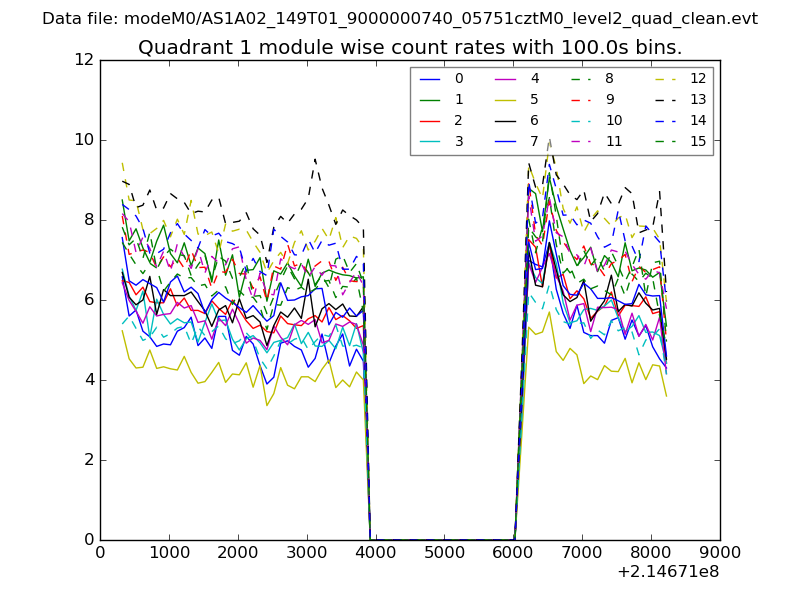 |
 |
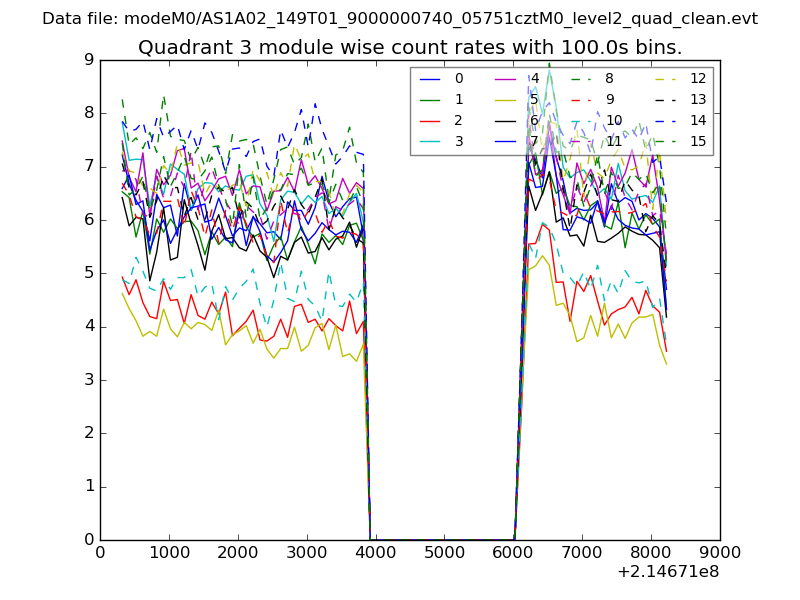
| Module-wise count rates for Quadrant C Data is divided into 100 sec bins |
 |
 |
| Module-wise count rates for Quadrant D Data is divided into 100 sec bins |
 |
 |
| Parameter | Plot |
|---|---|
| CZT HV Monitor | 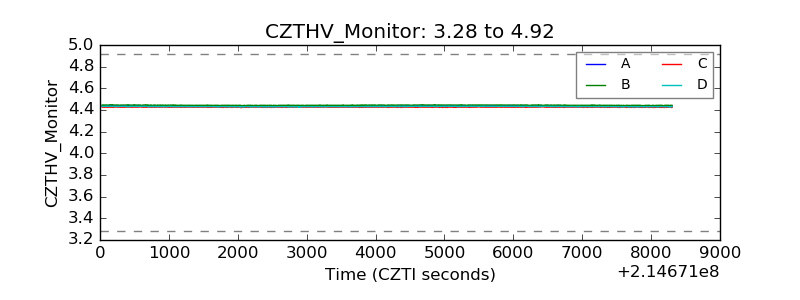 |
| D_VDD | 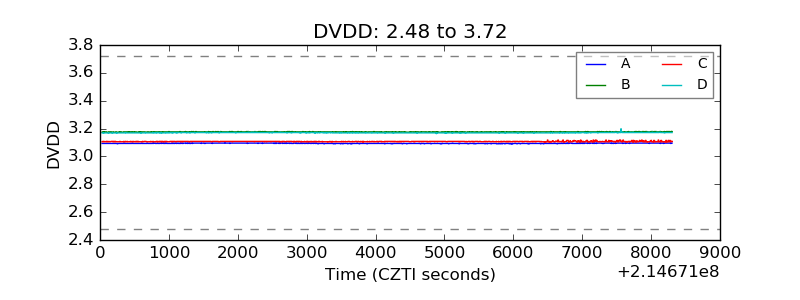 |
| Temperature 1 | 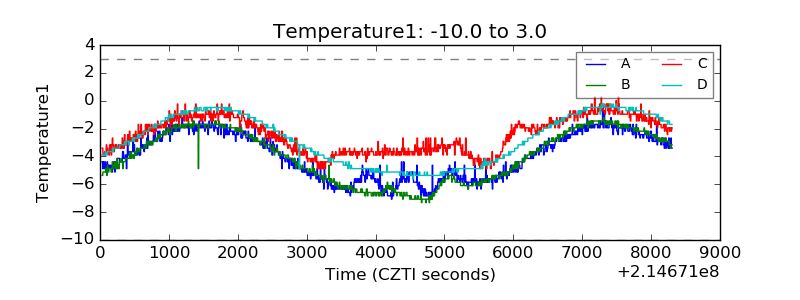 |
| Veto HV Monitor | 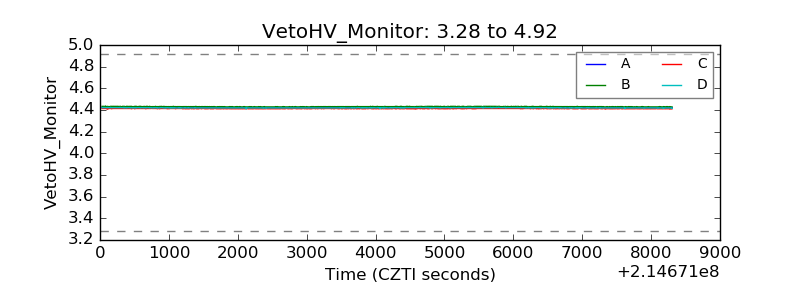 |
| Veto LLD | 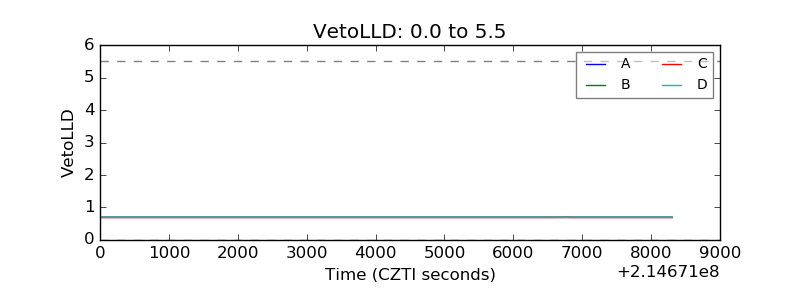 |
| Alpha Counter | 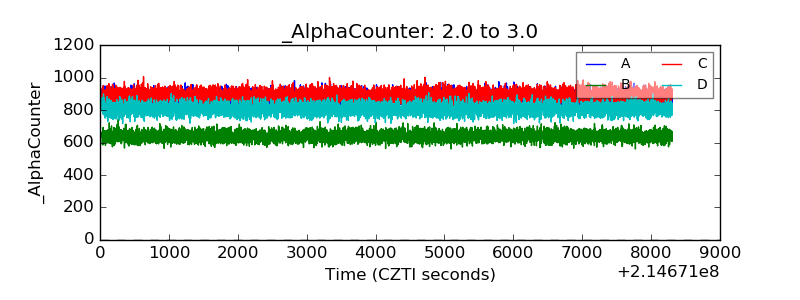 |
| _CPM_Rate | 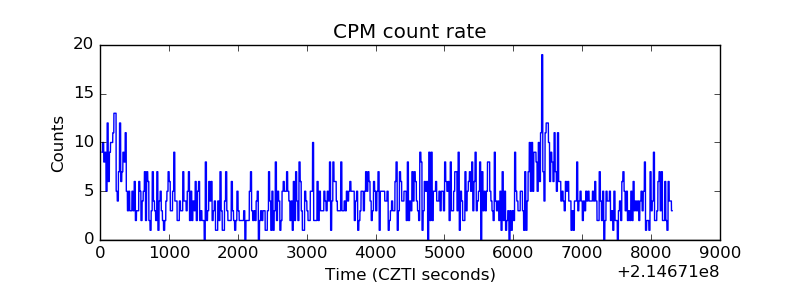 |
| CZT Counter | 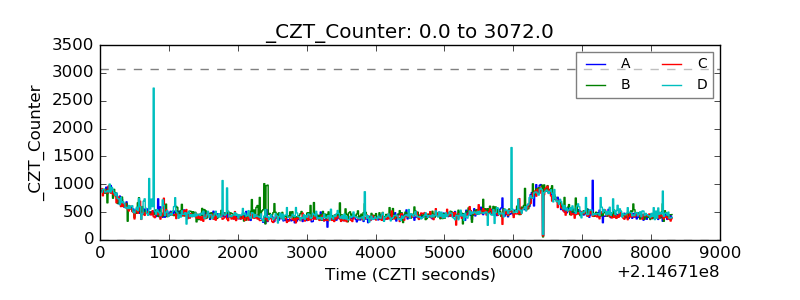 |
| +2.5 Volts monitor |  |
| +5 Volts monitor | 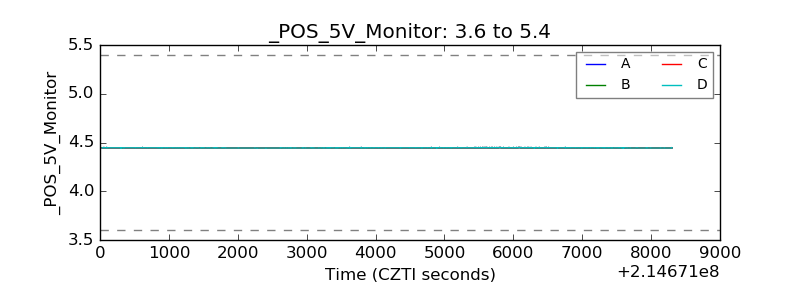 |
| _ROLL_ROT | 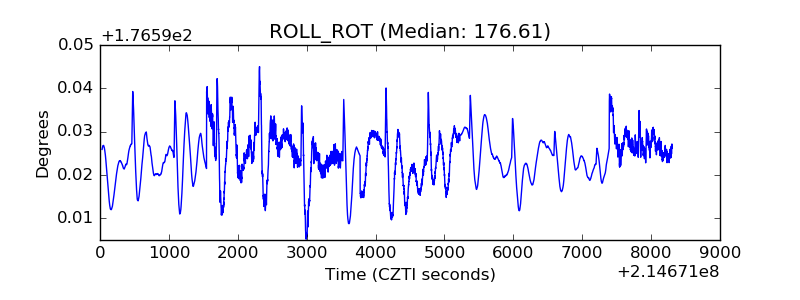 |
| _Roll_DEC | 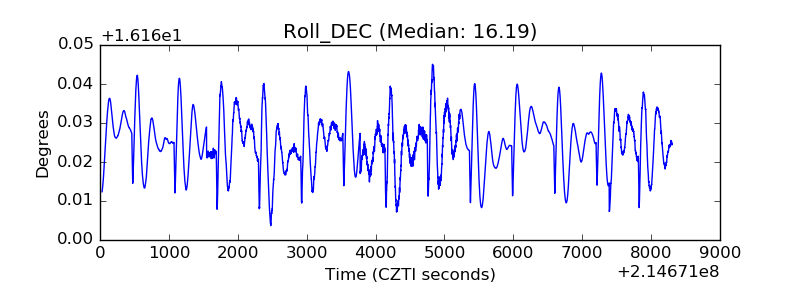 |
| _Roll_RA | 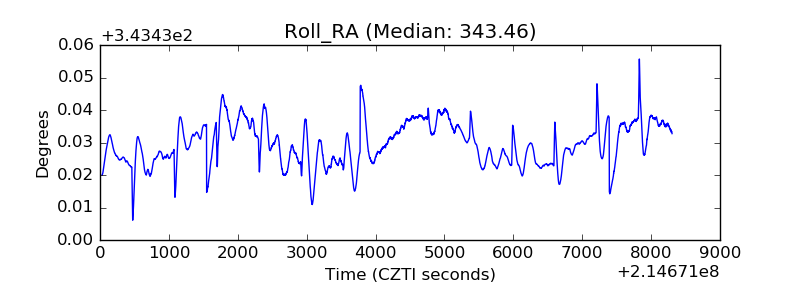 |
| Veto Counter | 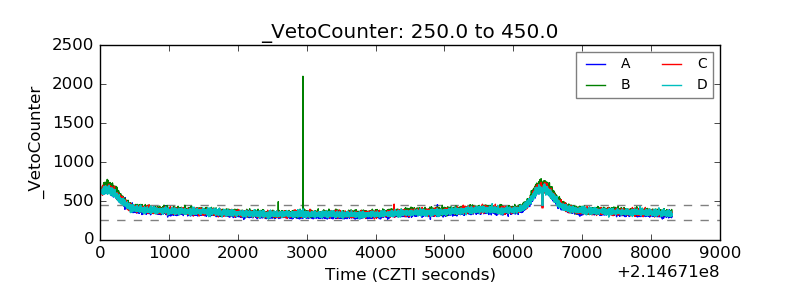 |