| Param | Original file | Final file |
|---|---|---|
| Filename | modeM0/AS1A02_149T01_9000000740_05752cztM0_level2.evt | modeM0/AS1A02_149T01_9000000740_05752cztM0_level2_quad_clean.evt |
| Size (bytes) | 347,935,680 | 56,969,280 |
| Size | 331.8 MB | 54.3 MB |
| Events in quadrant A | 2,452,365 | 335,869 |
| Events in quadrant B | 2,646,365 | 335,159 |
| Events in quadrant C | 2,449,089 | 337,496 |
| Events in quadrant D | 2,608,489 | 325,196 |
| Mode SS | |||
|---|---|---|---|
| Quadrant | BADHDUFLAG | Total packets | Discarded packets |
| A | 0 | 114 | 2 |
| B | 0 | 114 | 2 |
| C | 0 | 114 | 0 |
| D | 0 | 114 | 0 |
| Mode M0 | |||
|---|---|---|---|
| Quadrant | BADHDUFLAG | Total packets | Discarded packets |
| A | 0 | 11383 | 65 |
| B | 0 | 11652 | 71 |
| C | 0 | 11351 | 46 |
| D | 0 | 11629 | 58 |
| Quadrant | Total seconds | Saturated seconds | Saturation percentage |
|---|---|---|---|
| A | 5582 | 12 | 0.214977% |
| B | 5578 | 25 | 0.448189% |
| C | 5591 | 1 | 0.017886% |
| D | 5586 | 7 | 0.125313% |
Noise dominated data is calculated using 1-second bins in cleaned event files. If a bin has >2000 counts, and if more than 50% of those come from <1% of pixels, then it is considered to be noise-dominated and hence unusable.
| Quadrant | # 1 sec bins | Bins with >0 counts | Bins with >2000 counts | High rate bins dominated by noise | Noise dominated (total time) | Noise dominated (detector-on time) | Marked lightcurve |
|---|---|---|---|---|---|---|---|
| A | 5614 | 5610 | 0 | 0 | 0.00% | 0.00% | 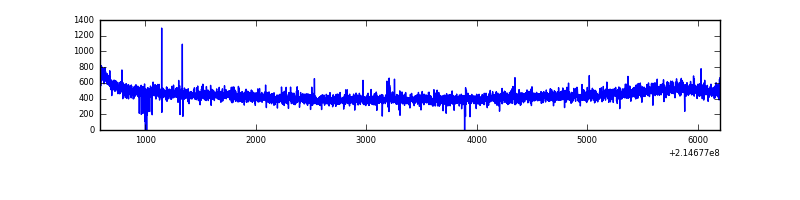 |
| B | 5614 | 5612 | 11 | 11 | 0.20% | 0.20% | 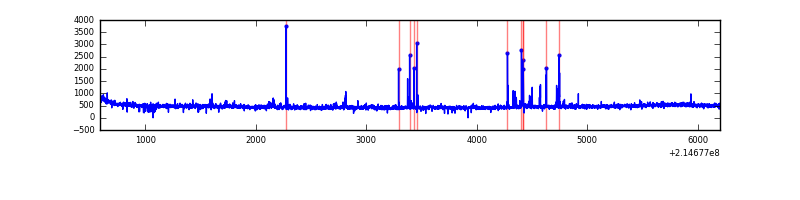 |
| C | 5614 | 5613 | 0 | 0 | 0.00% | 0.00% | 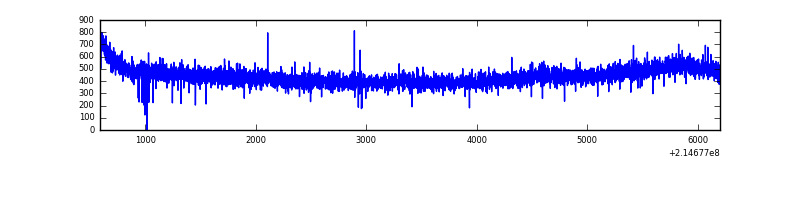 |
| D | 5614 | 5610 | 6 | 6 | 0.11% | 0.11% | 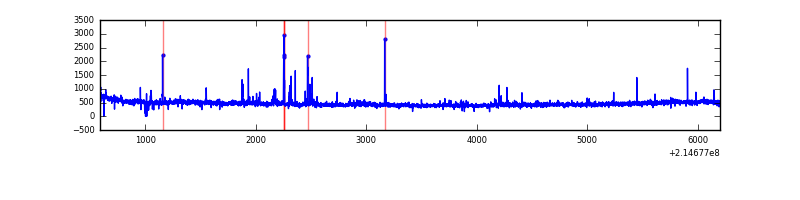 |
Top three noisy pixels from each quadrant. If the there are fewer than three noisy pixels in the level2.evt file, extra rows are filled as -1
| Pixel properties | Quadrant properties | ||||||
|---|---|---|---|---|---|---|---|
| Quadrant | DetID | PixID | Counts | Sigma | Mean | Median | Sigma |
| A | 12 | 194 | 6199 | 42.5 | 635 | 621 | 131.3 |
| A | 0 | 226 | 6010 | 41.06 | 635 | 621 | 131.3 |
| A | 0 | 50 | 4352 | 28.43 | 635 | 621 | 131.3 |
| B | 4 | 81 | 55648 | 441.93 | 641 | 625 | 124.5 |
| B | 15 | 204 | 31125 | 244.97 | 641 | 625 | 124.5 |
| B | 0 | 214 | 22101 | 172.49 | 641 | 625 | 124.5 |
| C | 8 | 128 | 12758 | 83.32 | 619 | 623 | 145.6 |
| C | 14 | 67 | 7607 | 47.95 | 619 | 623 | 145.6 |
| C | 8 | 112 | 6970 | 43.58 | 619 | 623 | 145.6 |
| D | 8 | 195 | 90193 | 584.86 | 619 | 599 | 153.2 |
| D | 2 | 14 | 58965 | 381.01 | 619 | 599 | 153.2 |
| D | 12 | 221 | 49574 | 319.71 | 619 | 599 | 153.2 |
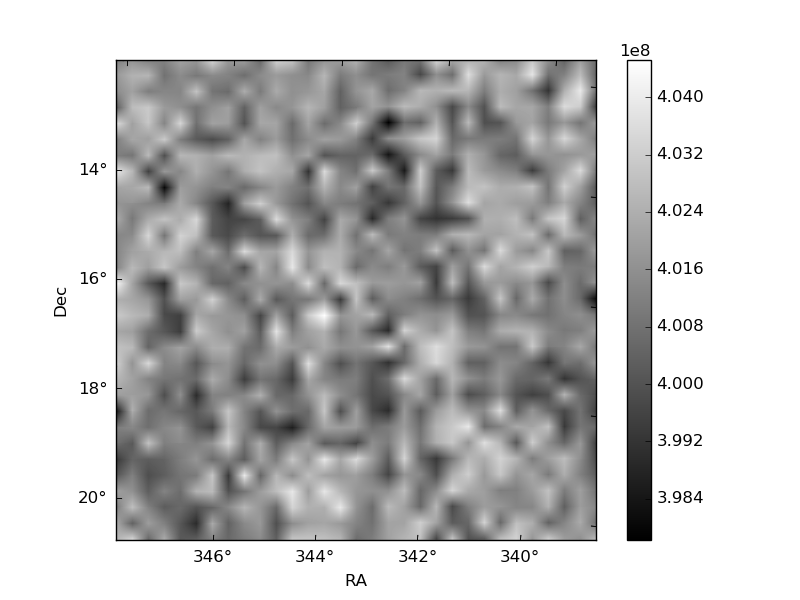
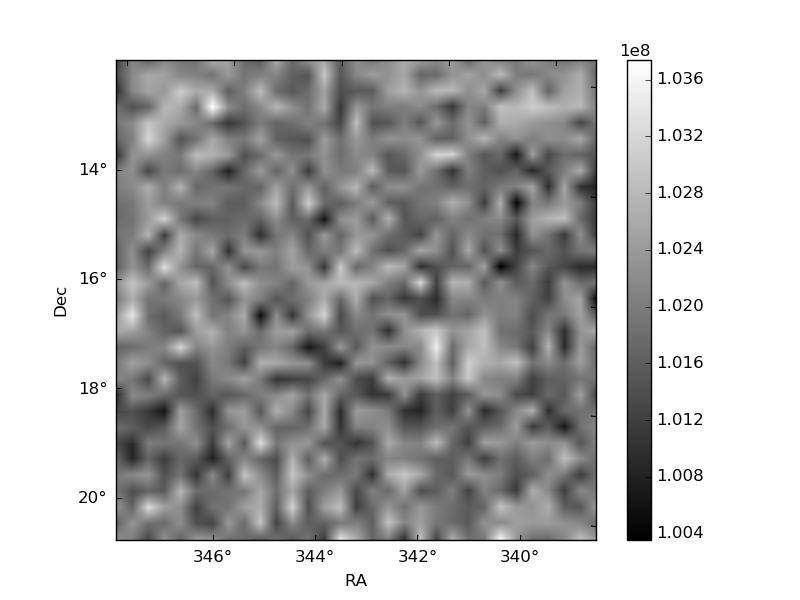
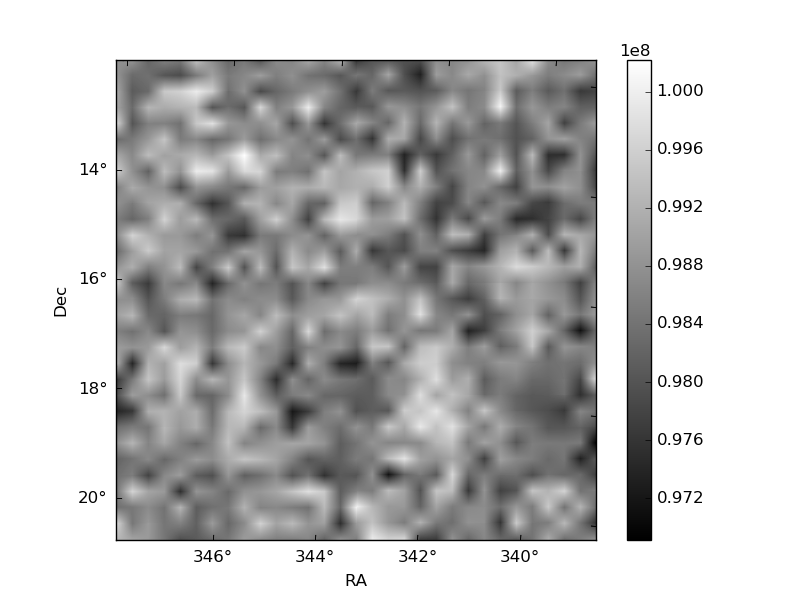
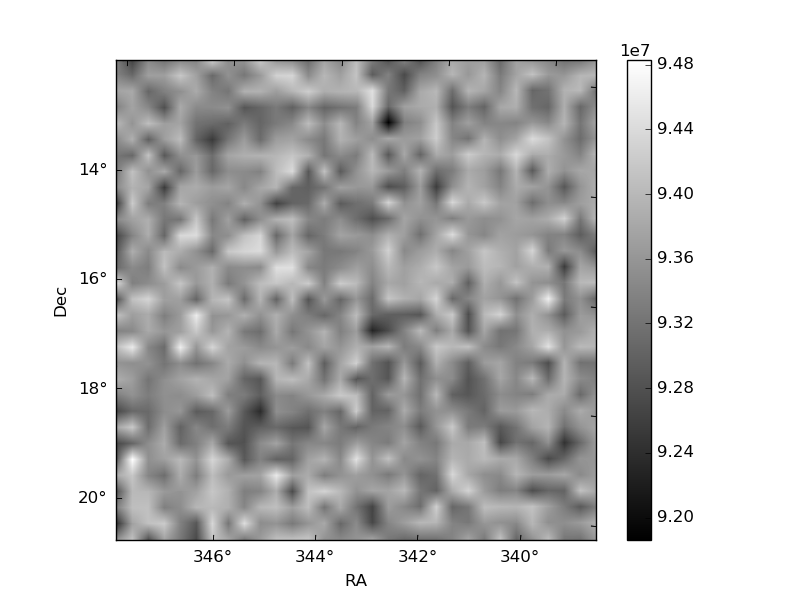
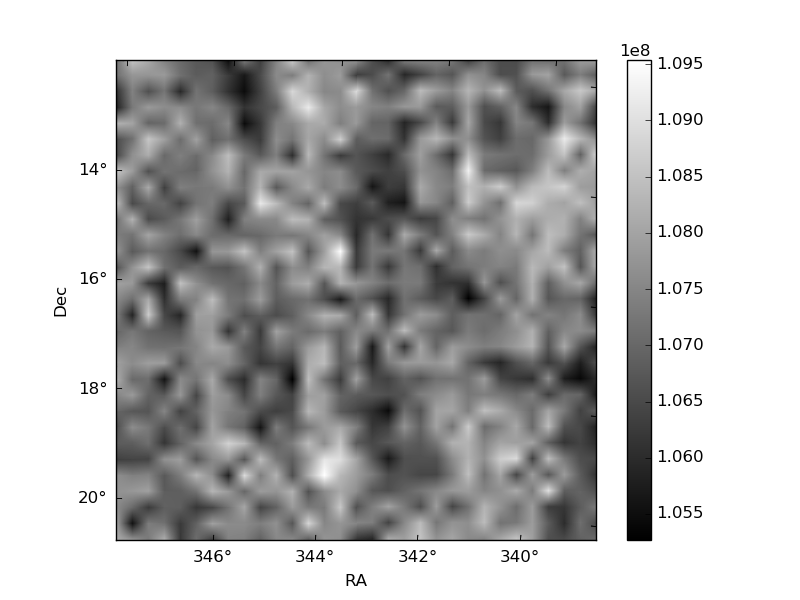
Histogram calculated using DETX and DETY for each event in the final _common_clean file
| Quadrant A | 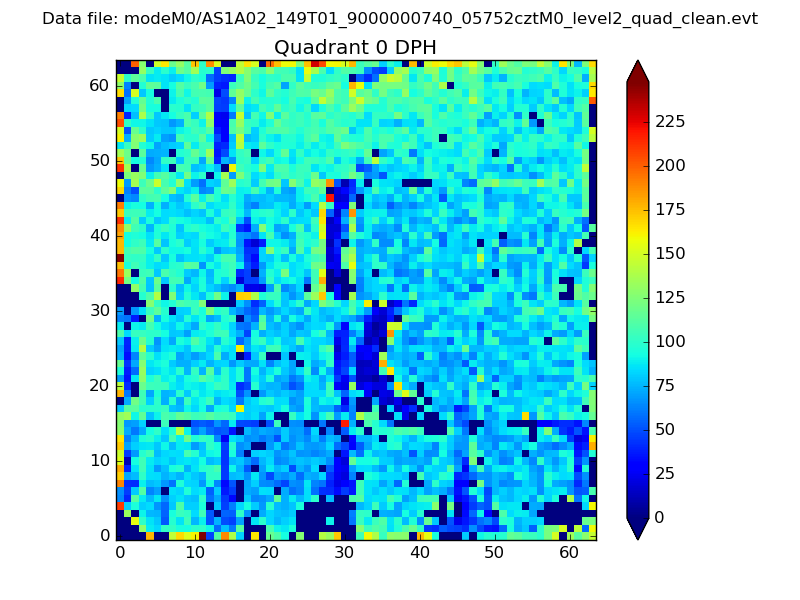 |
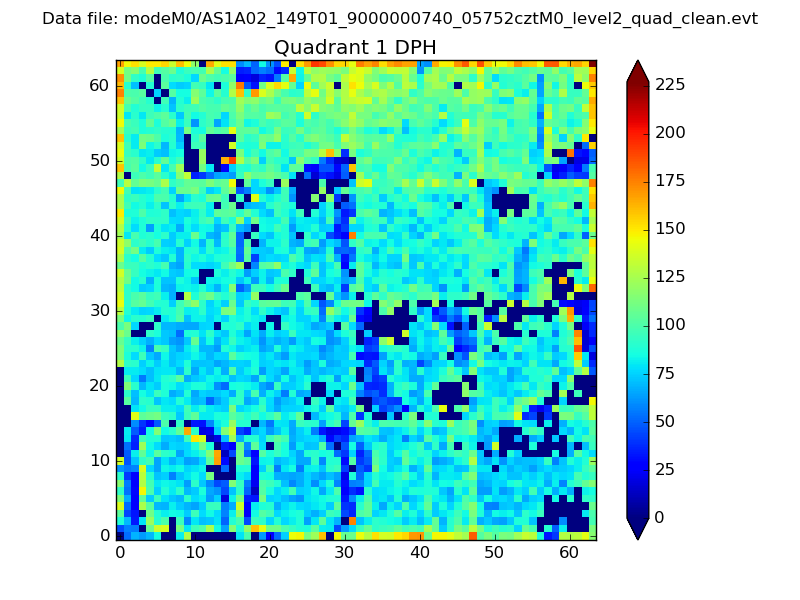 |
Quadrant B |
|---|---|---|---|
| Quadrant D | 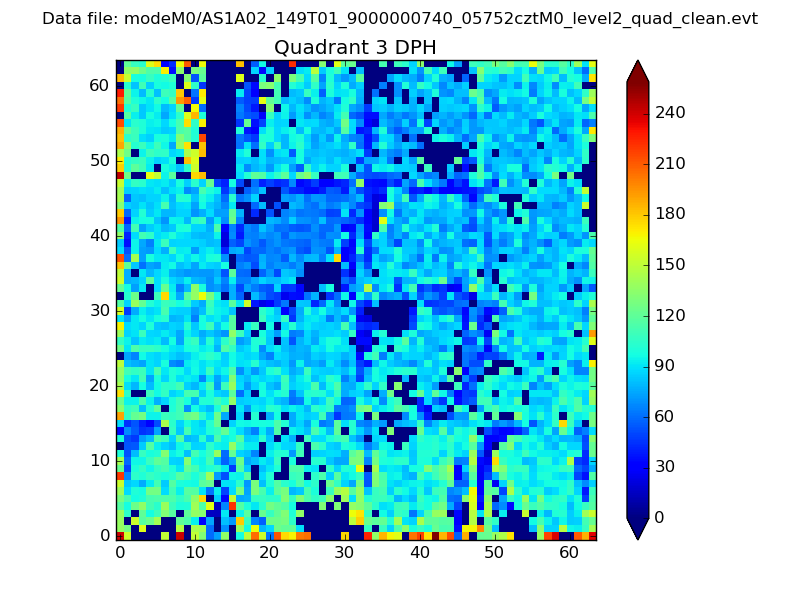 |
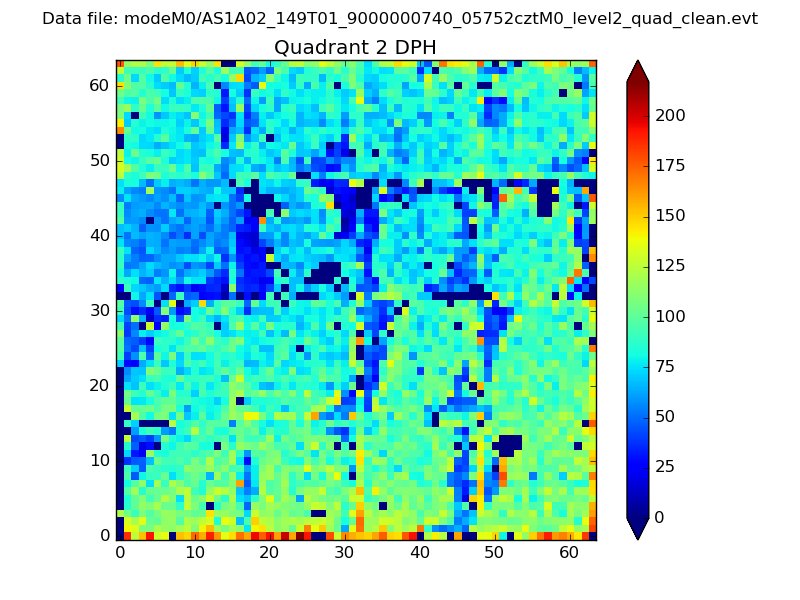 |
Quadrant C |
| Plot type | Count rate plots | Images |
|---|---|---|
| Comparison with Poisson distribution Blue bars denote a histogram of data divided into 1 sec bins. Red curve is a Poisson curve with rate = median count rate of data. |
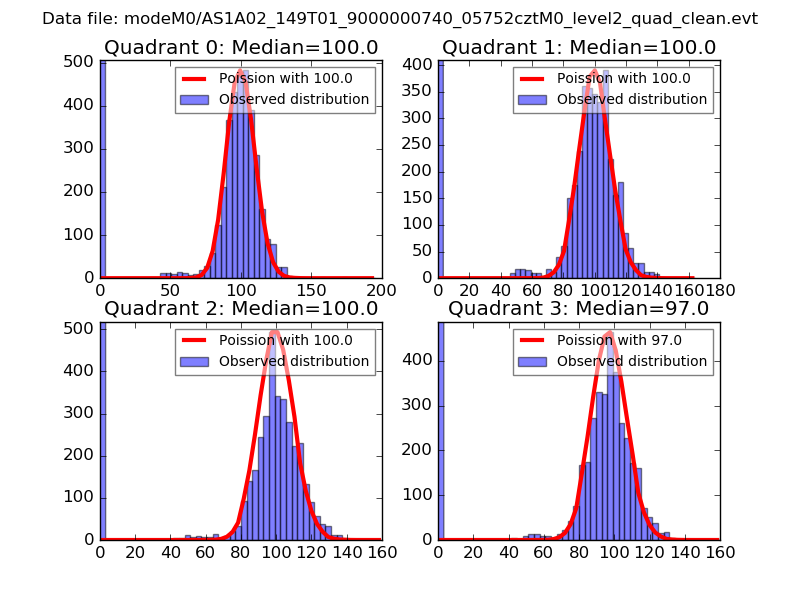 |
 |
| Quadrant-wise count rates Data is divided into 100 sec bins |
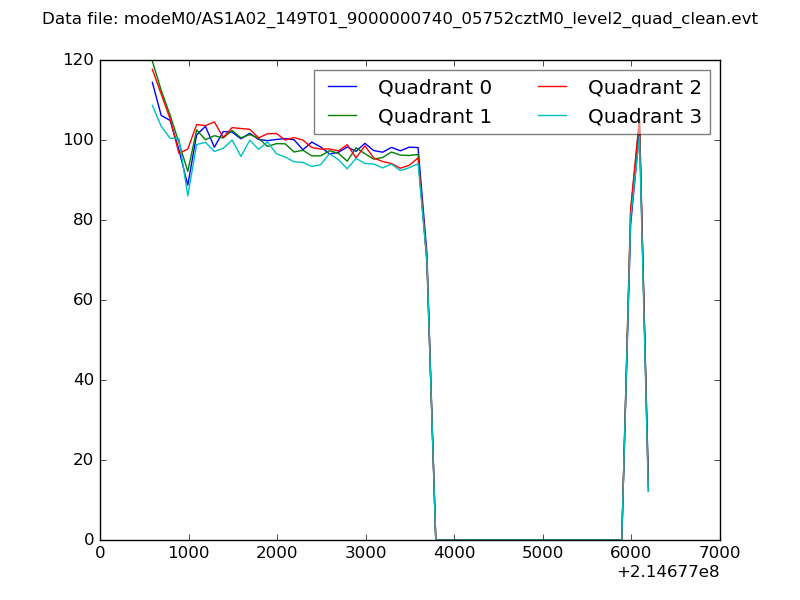 |
|
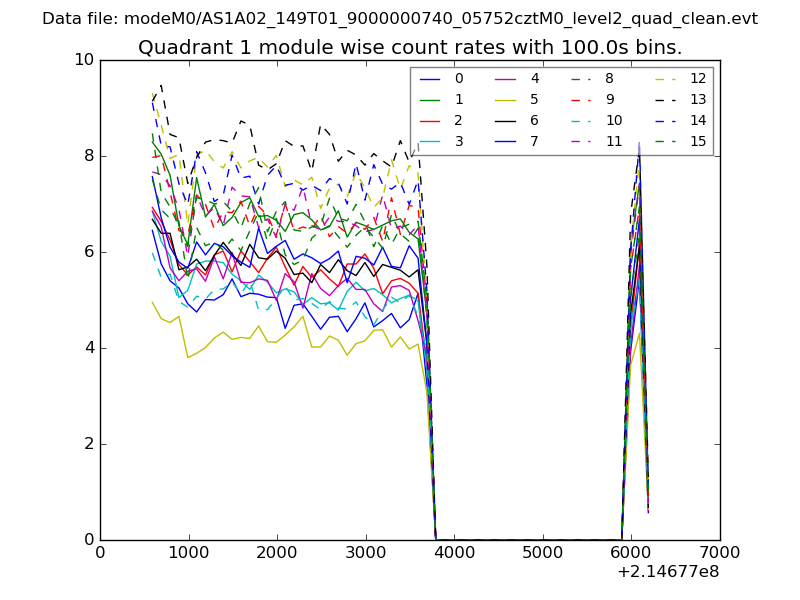
| Module-wise count rates for Quadrant A Data is divided into 100 sec bins |
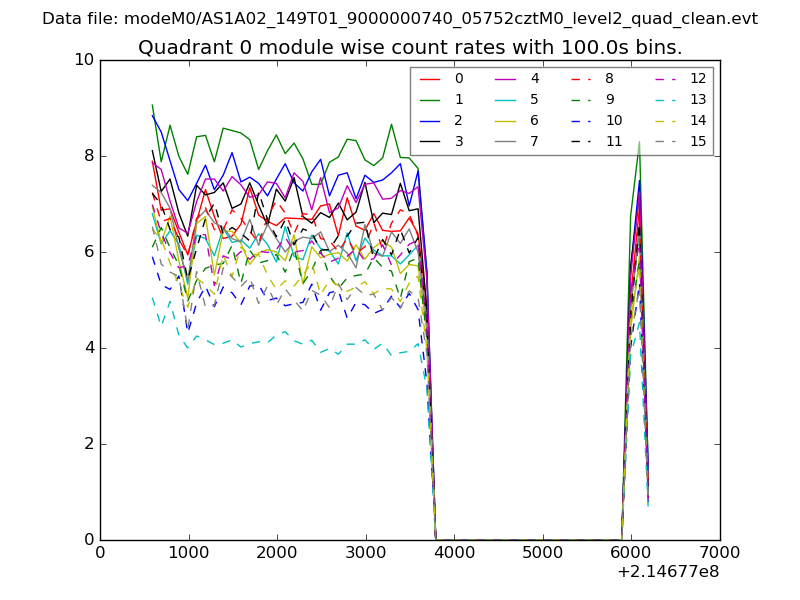 |
 |
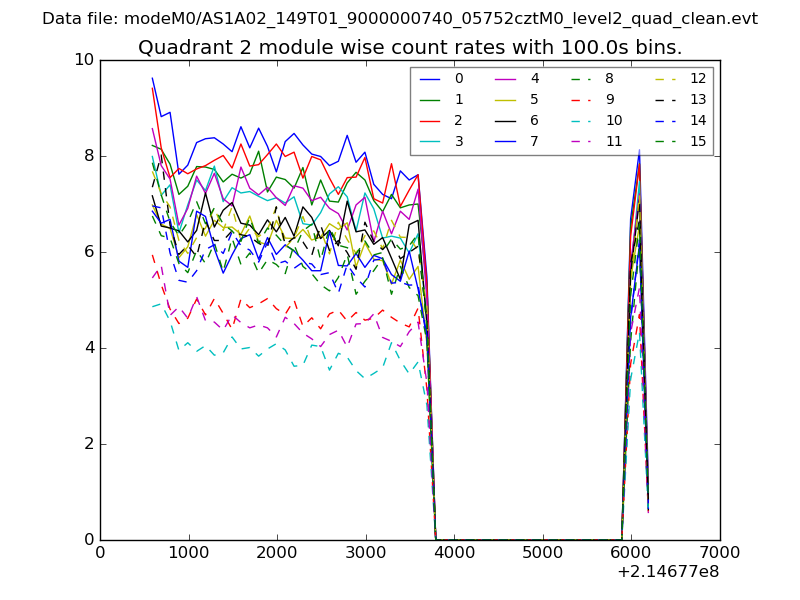
| Module-wise count rates for Quadrant B Data is divided into 100 sec bins |
 |
 |
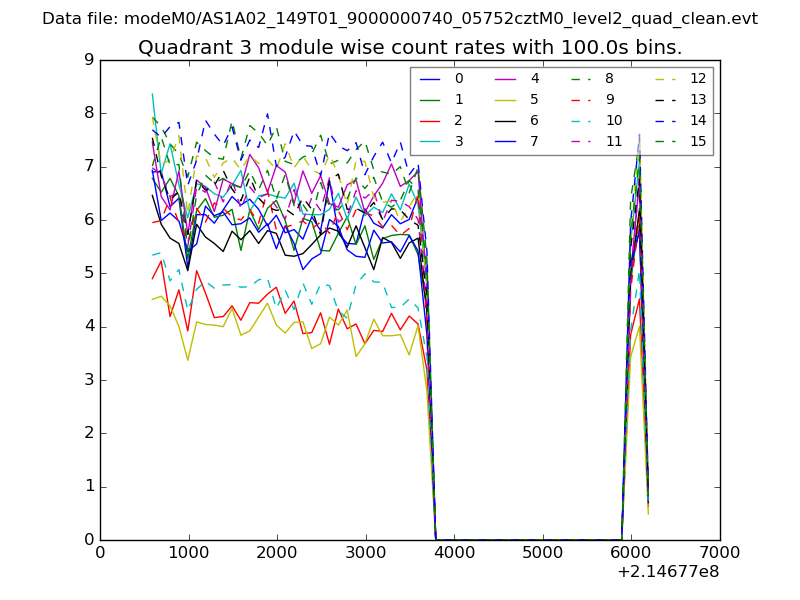
| Module-wise count rates for Quadrant C Data is divided into 100 sec bins |
 |
 |
| Module-wise count rates for Quadrant D Data is divided into 100 sec bins |
 |
 |
| Parameter | Plot |
|---|---|
| CZT HV Monitor | 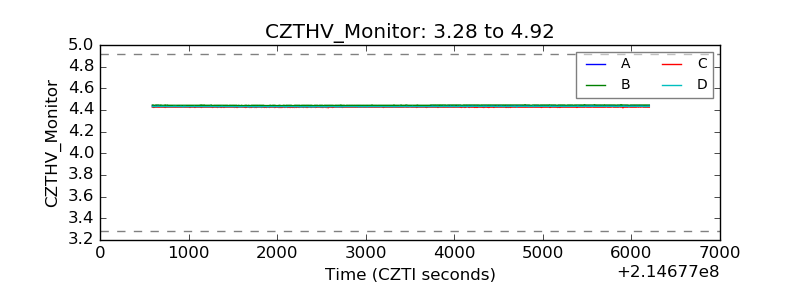 |
| D_VDD | 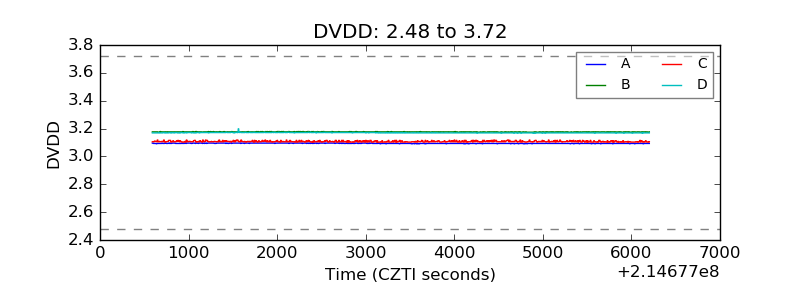 |
| Temperature 1 | 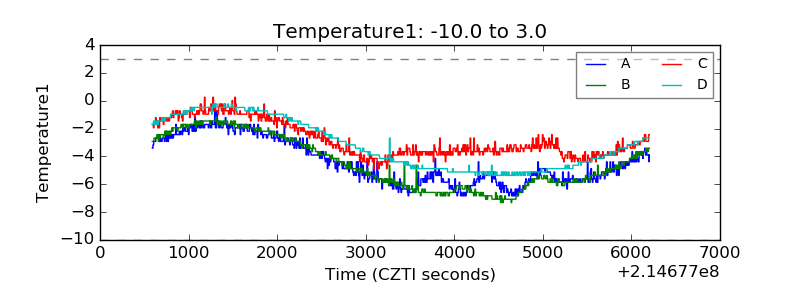 |
| Veto HV Monitor | 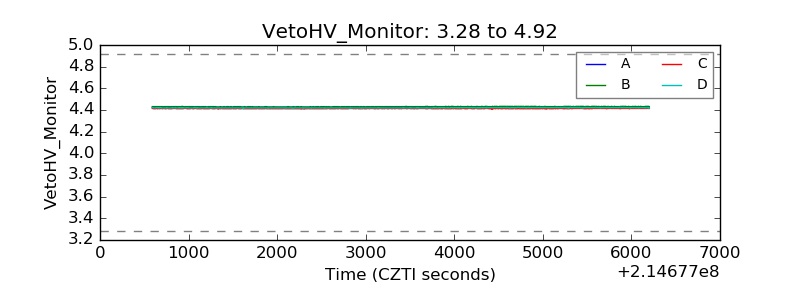 |
| Veto LLD | 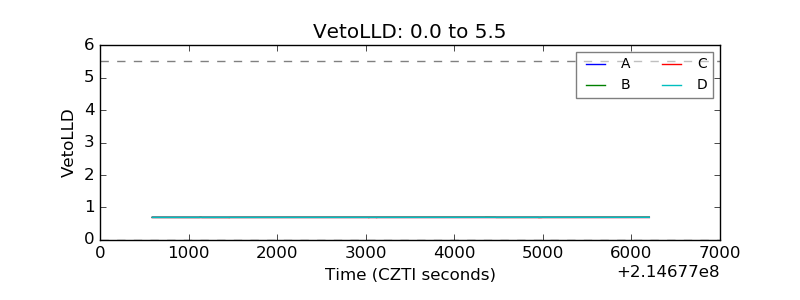 |
| Alpha Counter | 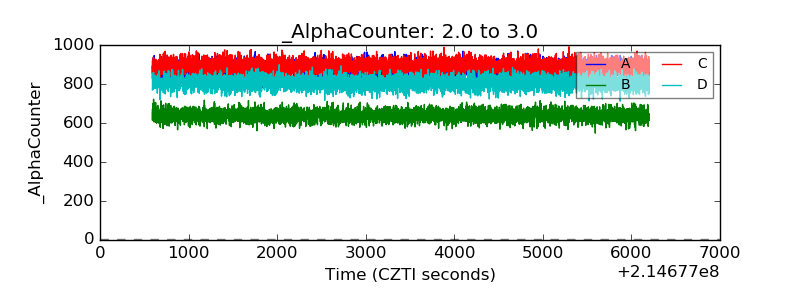 |
| _CPM_Rate | 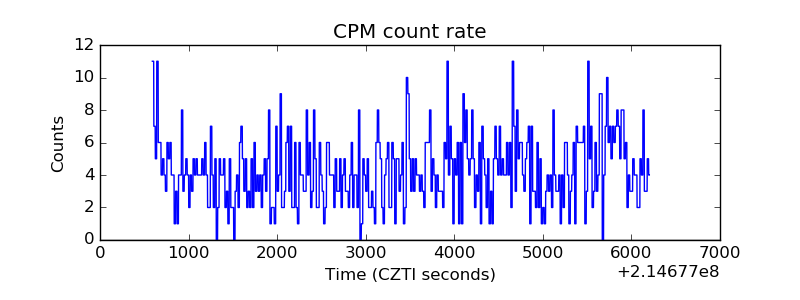 |
| CZT Counter | 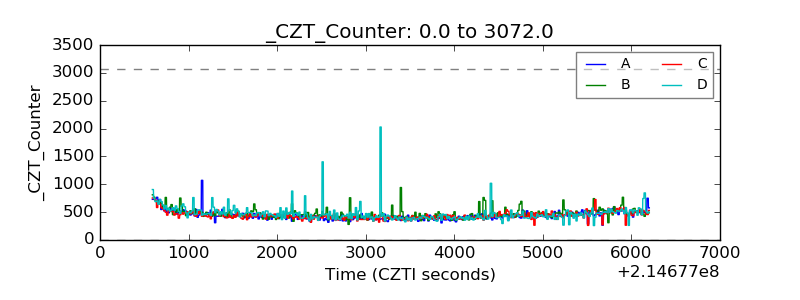 |
| +2.5 Volts monitor | 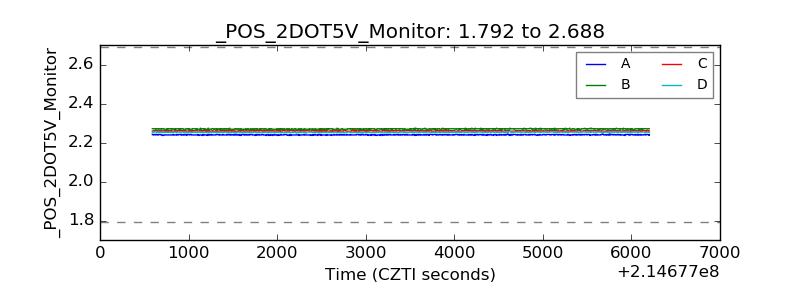 |
| +5 Volts monitor | 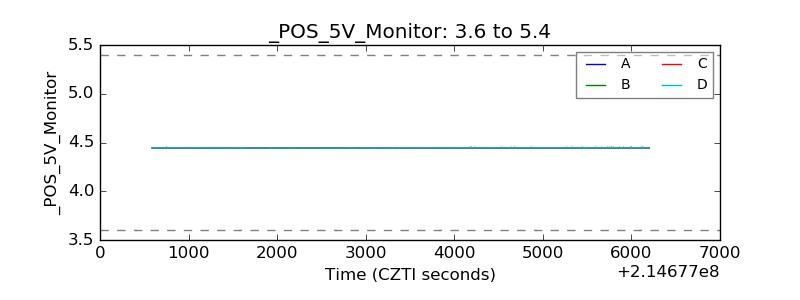 |
| _ROLL_ROT | 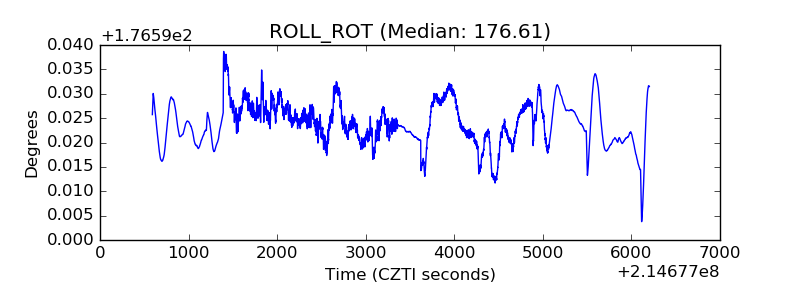 |
| _Roll_DEC | 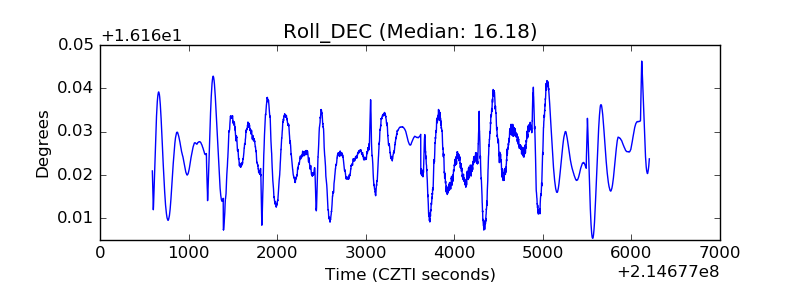 |
| _Roll_RA | 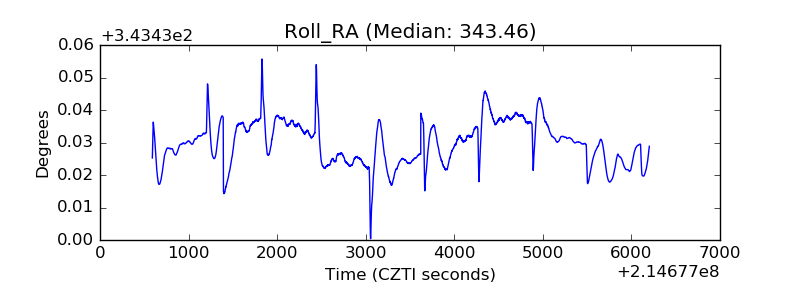 |
| Veto Counter | 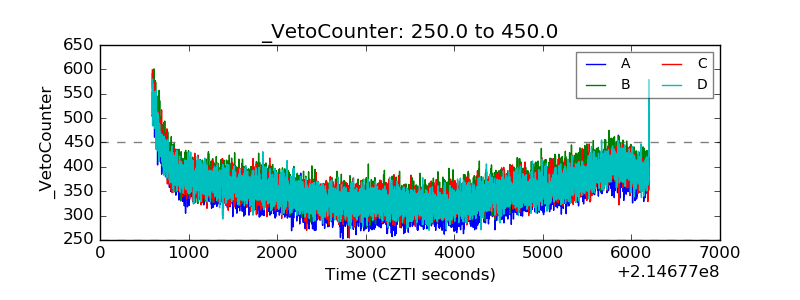 |