| Param | Original file | Final file |
|---|---|---|
| Filename | modeM0/AS1A02_149T01_9000000740_05754cztM0_level2.evt | modeM0/AS1A02_149T01_9000000740_05754cztM0_level2_quad_clean.evt |
| Size (bytes) | 858,006,720 | 147,283,200 |
| Size | 818.3 MB | 140.5 MB |
| Events in quadrant A | 5,971,616 | 889,472 |
| Events in quadrant B | 6,584,851 | 888,014 |
| Events in quadrant C | 5,877,285 | 908,675 |
| Events in quadrant D | 6,660,084 | 865,644 |
| Mode M9 | |||
|---|---|---|---|
| Quadrant | BADHDUFLAG | Total packets | Discarded packets |
| A | 0 | 18 | 0 |
| B | 0 | 18 | 0 |
| C | 0 | 18 | 0 |
| D | 0 | 18 | 0 |
| Mode SS | |||
|---|---|---|---|
| Quadrant | BADHDUFLAG | Total packets | Discarded packets |
| A | 0 | 268 | 2 |
| B | 0 | 268 | 0 |
| C | 0 | 268 | 0 |
| D | 0 | 268 | 0 |
| Mode M0 | |||
|---|---|---|---|
| Quadrant | BADHDUFLAG | Total packets | Discarded packets |
| A | 0 | 27212 | 54 |
| B | 0 | 28394 | 86 |
| C | 0 | 26992 | 60 |
| D | 0 | 28914 | 69 |
| Quadrant | Total seconds | Saturated seconds | Saturation percentage |
|---|---|---|---|
| A | 13167 | 142 | 1.078454% |
| B | 13155 | 228 | 1.733181% |
| C | 13163 | 73 | 0.554585% |
| D | 13164 | 152 | 1.154664% |
Noise dominated data is calculated using 1-second bins in cleaned event files. If a bin has >2000 counts, and if more than 50% of those come from <1% of pixels, then it is considered to be noise-dominated and hence unusable.
| Quadrant | # 1 sec bins | Bins with >0 counts | Bins with >2000 counts | High rate bins dominated by noise | Noise dominated (total time) | Noise dominated (detector-on time) | Marked lightcurve |
|---|---|---|---|---|---|---|---|
| A | 14826 | 13195 | 3 | 3 | 0.02% | 0.02% | 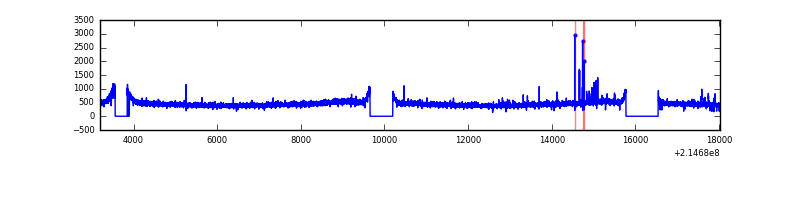 |
| B | 14826 | 13193 | 56 | 56 | 0.38% | 0.42% | 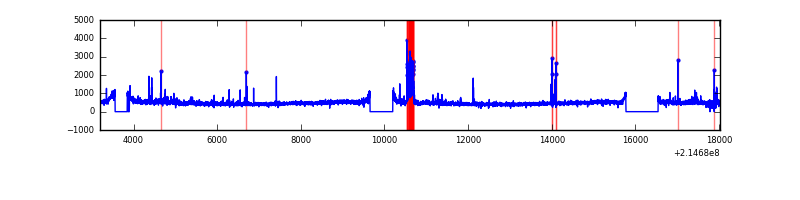 |
| C | 14826 | 13194 | 0 | 0 | 0.00% | 0.00% | 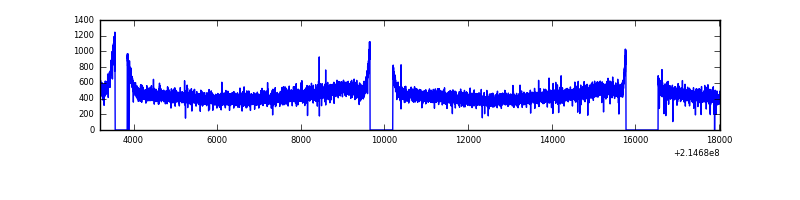 |
| D | 14826 | 13195 | 56 | 56 | 0.38% | 0.42% | 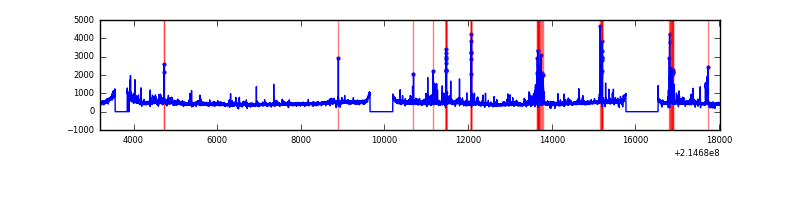 |
Top three noisy pixels from each quadrant. If the there are fewer than three noisy pixels in the level2.evt file, extra rows are filled as -1
| Pixel properties | Quadrant properties | ||||||
|---|---|---|---|---|---|---|---|
| Quadrant | DetID | PixID | Counts | Sigma | Mean | Median | Sigma |
| A | 15 | 236 | 31558 | 95.07 | 1538 | 1503 | 316.2 |
| A | 15 | 174 | 15676 | 44.83 | 1538 | 1503 | 316.2 |
| A | 12 | 194 | 15153 | 43.18 | 1538 | 1503 | 316.2 |
| B | 10 | 245 | 236432 | 783.61 | 1547 | 1509 | 299.8 |
| B | 15 | 204 | 117624 | 387.31 | 1547 | 1509 | 299.8 |
| B | 0 | 219 | 108033 | 355.32 | 1547 | 1509 | 299.8 |
| C | 13 | 61 | 12090 | 30.26 | 1501 | 1507 | 349.7 |
| C | 14 | 67 | 8129 | 18.94 | 1501 | 1507 | 349.7 |
| C | 8 | 128 | 7177 | 16.21 | 1501 | 1507 | 349.7 |
| D | 10 | 15 | 298668 | 808.68 | 1496 | 1450 | 367.5 |
| D | 8 | 195 | 183457 | 495.21 | 1496 | 1450 | 367.5 |
| D | 12 | 221 | 146714 | 395.24 | 1496 | 1450 | 367.5 |
Histogram calculated using DETX and DETY for each event in the final _common_clean file
| Quadrant A |  |
 |
Quadrant B |
|---|---|---|---|
| Quadrant D |  |
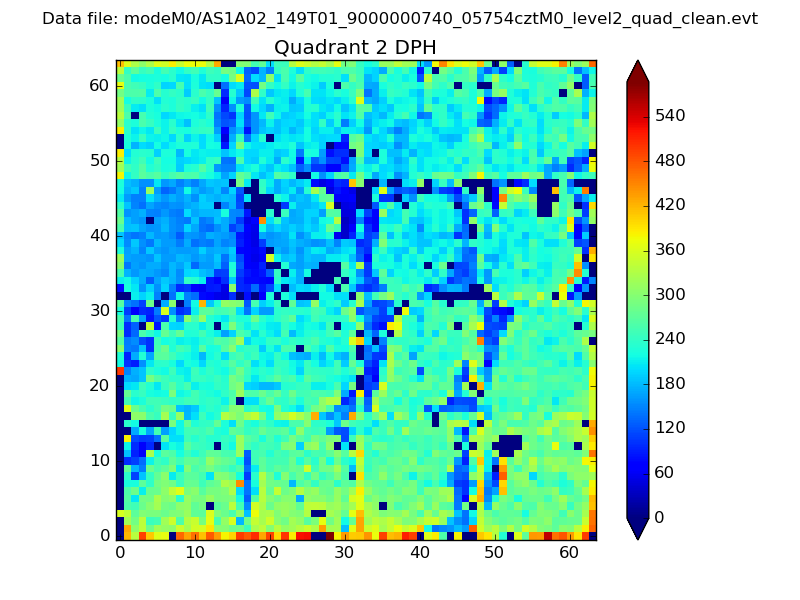 |
Quadrant C |
| Plot type | Count rate plots | Images |
|---|---|---|
| Comparison with Poisson distribution Blue bars denote a histogram of data divided into 1 sec bins. Red curve is a Poisson curve with rate = median count rate of data. |
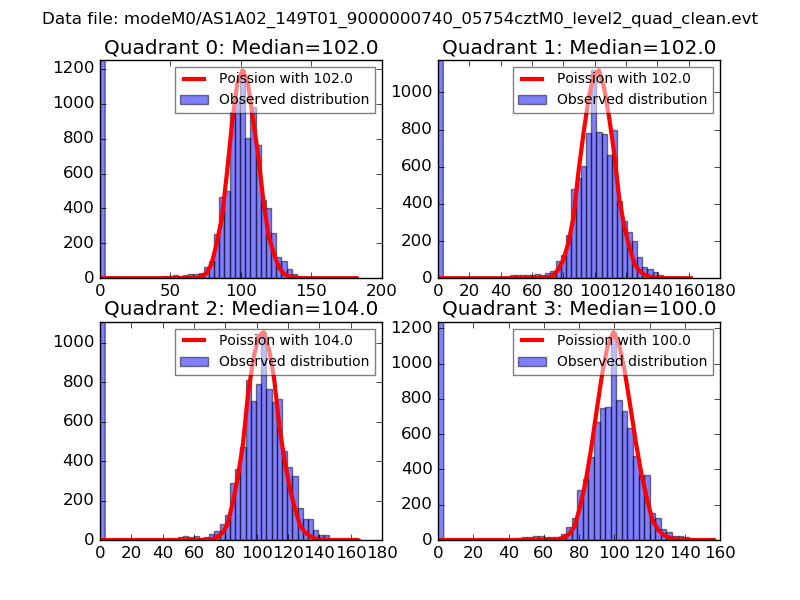 |
 |
| Quadrant-wise count rates Data is divided into 100 sec bins |
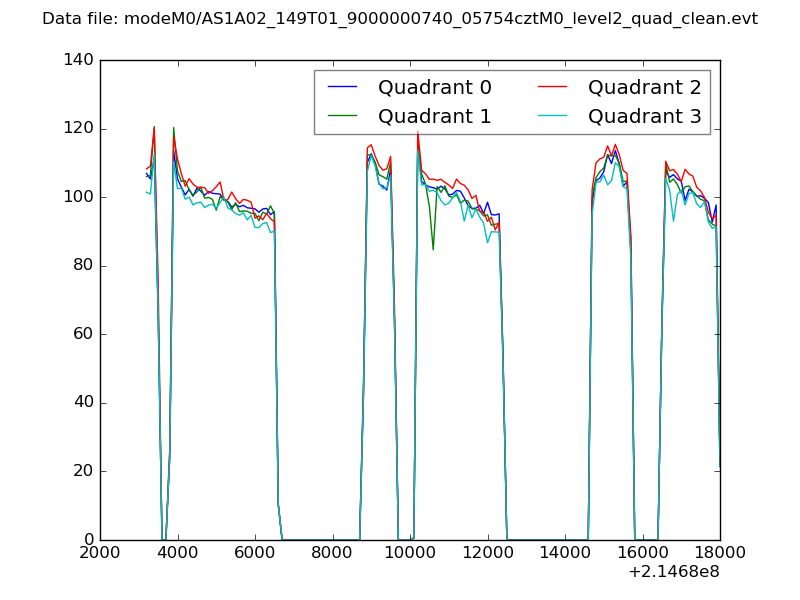 |
|
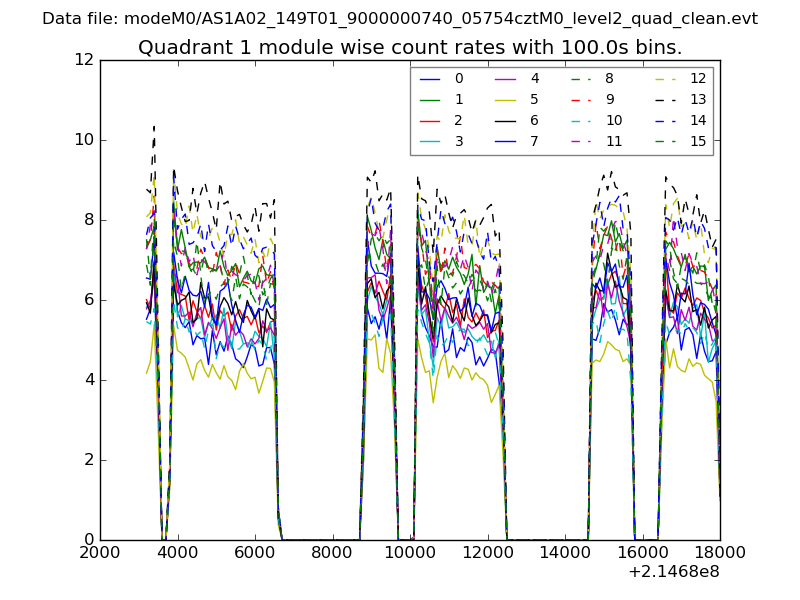
| Module-wise count rates for Quadrant A Data is divided into 100 sec bins |
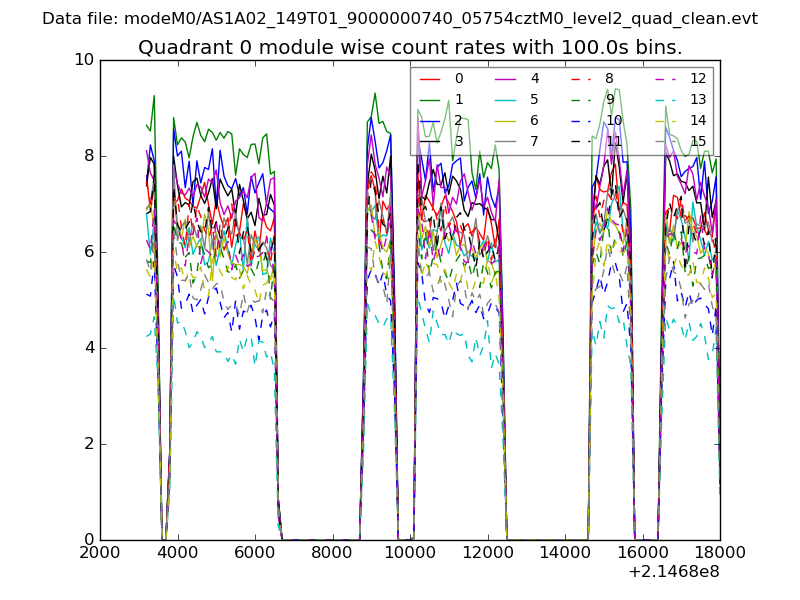 |
 |
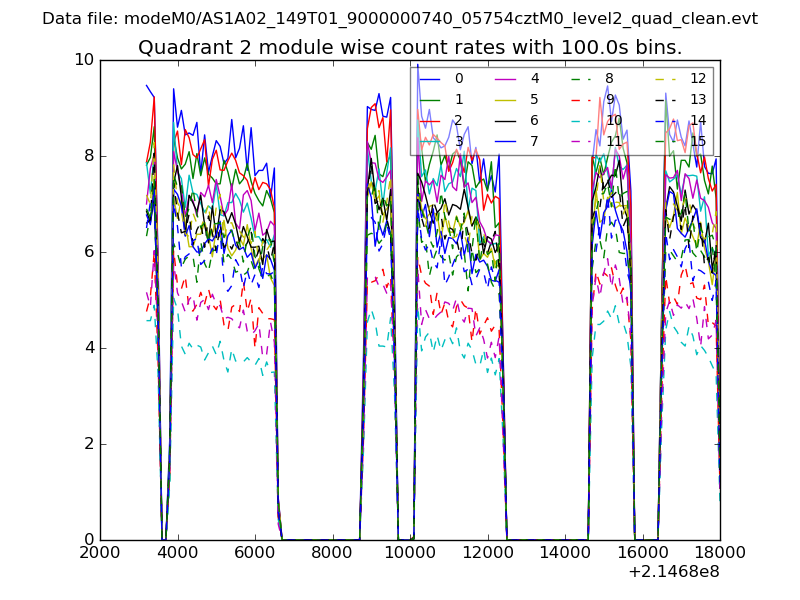
| Module-wise count rates for Quadrant B Data is divided into 100 sec bins |
 |
 |
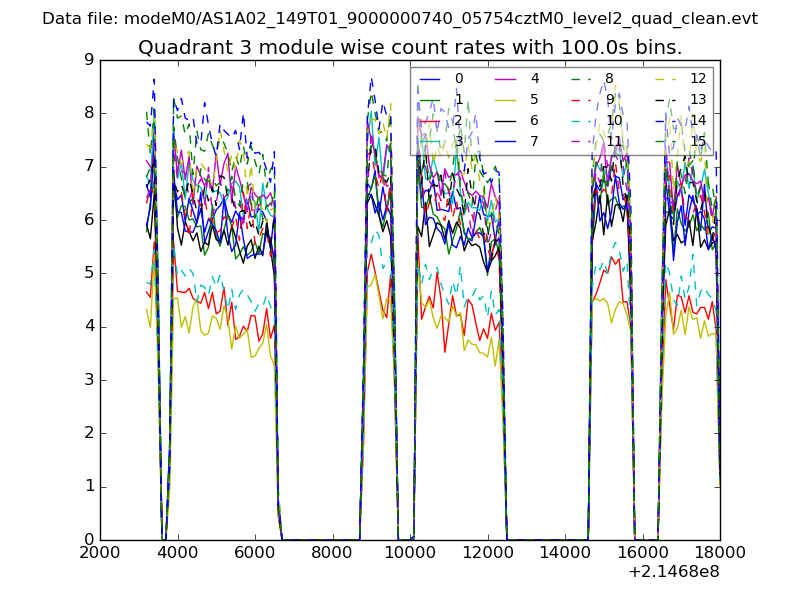
| Module-wise count rates for Quadrant C Data is divided into 100 sec bins |
 |
 |
| Module-wise count rates for Quadrant D Data is divided into 100 sec bins |
 |
 |
| Parameter | Plot |
|---|---|
| CZT HV Monitor | 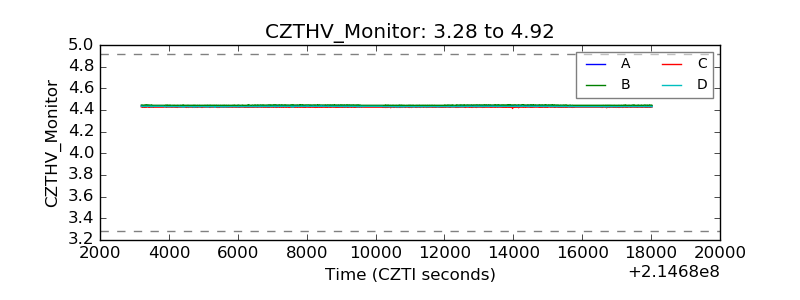 |
| D_VDD | 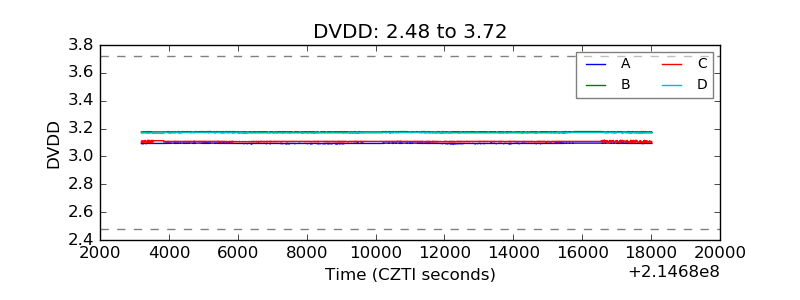 |
| Temperature 1 | 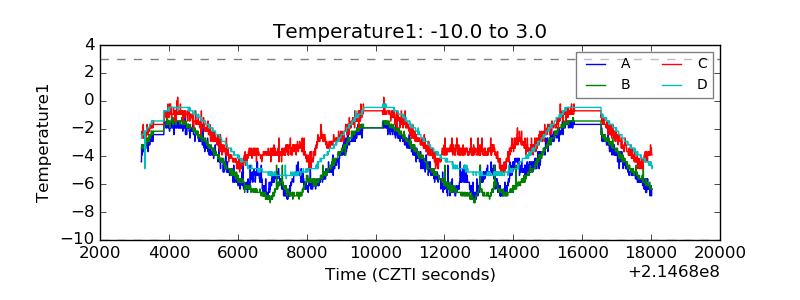 |
| Veto HV Monitor | 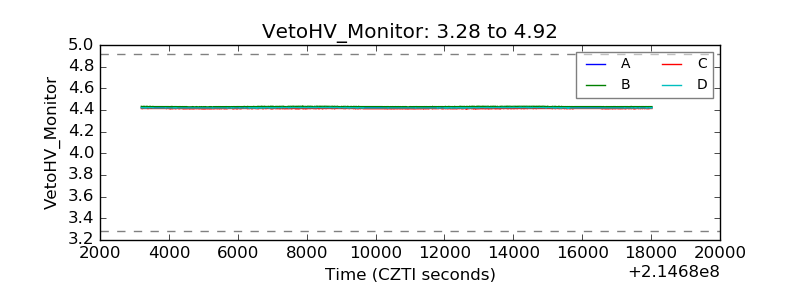 |
| Veto LLD | 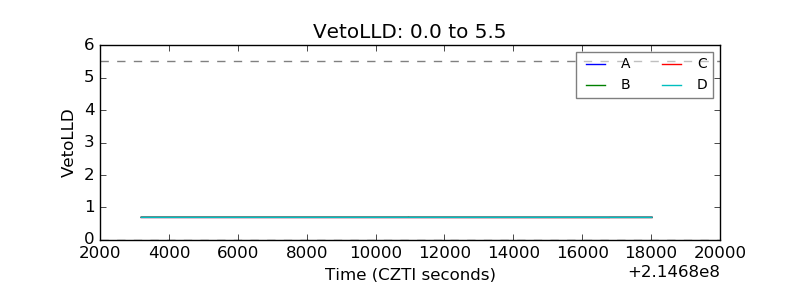 |
| Alpha Counter | 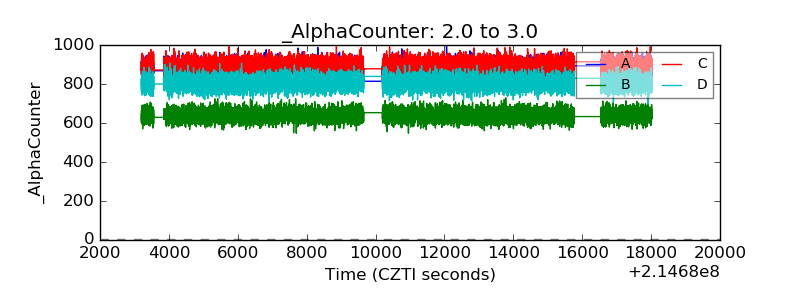 |
| _CPM_Rate | 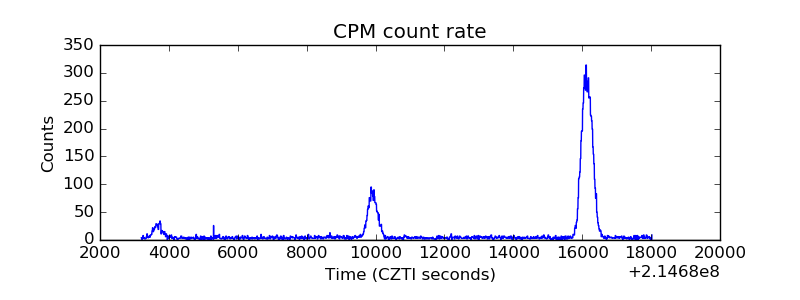 |
| CZT Counter | 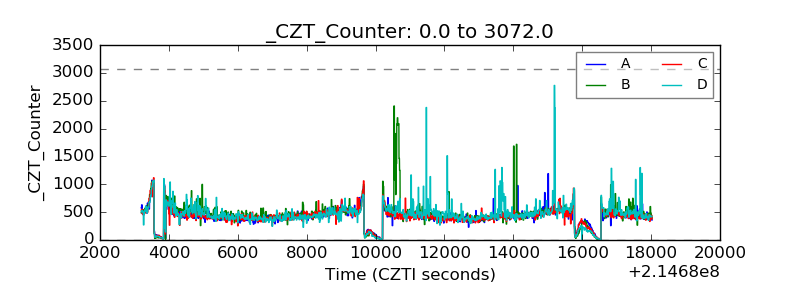 |
| +2.5 Volts monitor | 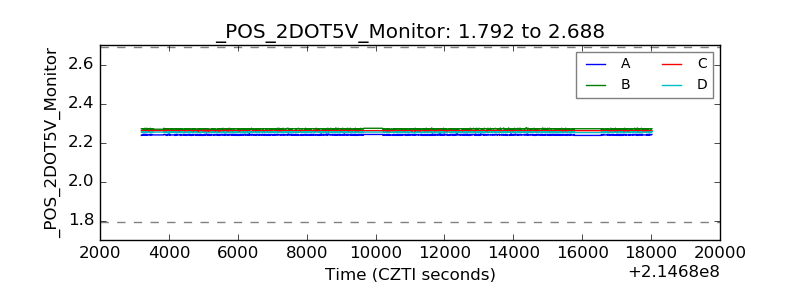 |
| +5 Volts monitor |  |
| _ROLL_ROT | 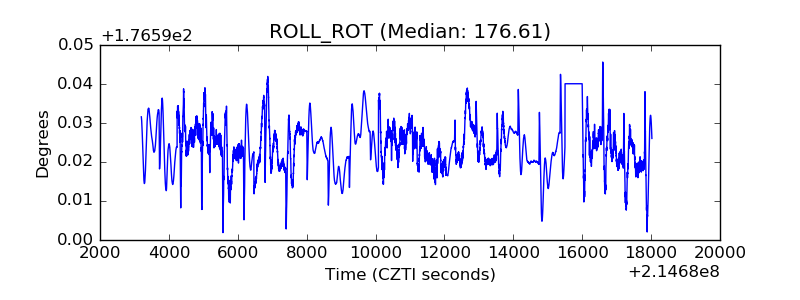 |
| _Roll_DEC | 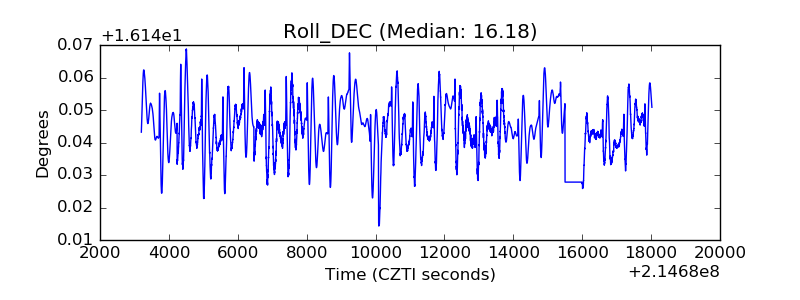 |
| _Roll_RA |  |
| Veto Counter | 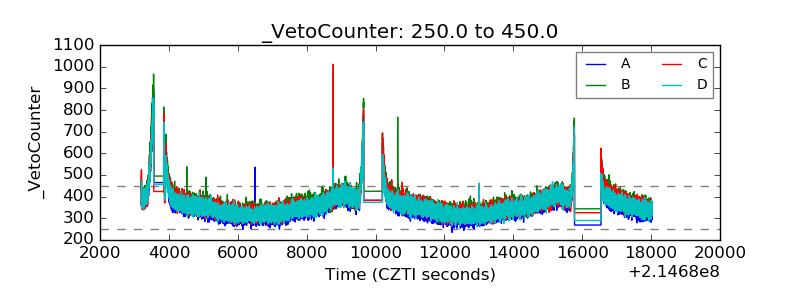 |