| Param | Original file | Final file |
|---|---|---|
| Filename | modeM0/AS1A02_149T01_9000000740_05756cztM0_level2.evt | modeM0/AS1A02_149T01_9000000740_05756cztM0_level2_quad_clean.evt |
| Size (bytes) | 413,766,720 | 69,488,640 |
| Size | 394.6 MB | 66.3 MB |
| Events in quadrant A | 2,952,314 | 414,739 |
| Events in quadrant B | 3,175,591 | 418,800 |
| Events in quadrant C | 2,892,857 | 416,142 |
| Events in quadrant D | 3,064,937 | 397,911 |
| Mode M9 | |||
|---|---|---|---|
| Quadrant | BADHDUFLAG | Total packets | Discarded packets |
| A | 0 | 15 | 0 |
| B | 0 | 15 | 0 |
| C | 0 | 15 | 0 |
| D | 0 | 16 | 0 |
| Mode SS | |||
|---|---|---|---|
| Quadrant | BADHDUFLAG | Total packets | Discarded packets |
| A | 0 | 134 | 0 |
| B | 0 | 134 | 0 |
| C | 0 | 134 | 0 |
| D | 0 | 134 | 0 |
| Mode M0 | |||
|---|---|---|---|
| Quadrant | BADHDUFLAG | Total packets | Discarded packets |
| A | 0 | 13292 | 7 |
| B | 0 | 13797 | 4 |
| C | 0 | 13211 | 9 |
| D | 0 | 13722 | 2 |
| Quadrant | Total seconds | Saturated seconds | Saturation percentage |
|---|---|---|---|
| A | 6539 | 16 | 0.244686% |
| B | 6540 | 28 | 0.428135% |
| C | 6537 | 10 | 0.152975% |
| D | 6541 | 25 | 0.382205% |
Noise dominated data is calculated using 1-second bins in cleaned event files. If a bin has >2000 counts, and if more than 50% of those come from <1% of pixels, then it is considered to be noise-dominated and hence unusable.
| Quadrant | # 1 sec bins | Bins with >0 counts | Bins with >2000 counts | High rate bins dominated by noise | Noise dominated (total time) | Noise dominated (detector-on time) | Marked lightcurve |
|---|---|---|---|---|---|---|---|
| A | 7636 | 6542 | 4 | 4 | 0.05% | 0.06% | 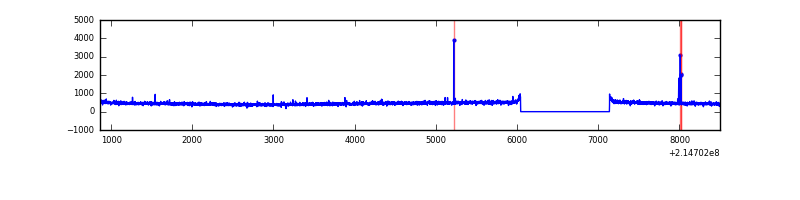 |
| B | 7636 | 6542 | 8 | 8 | 0.10% | 0.12% | 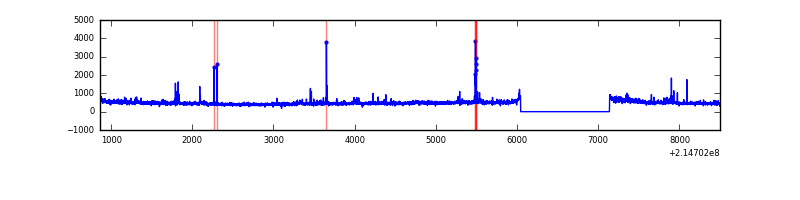 |
| C | 7636 | 6541 | 0 | 0 | 0.00% | 0.00% | 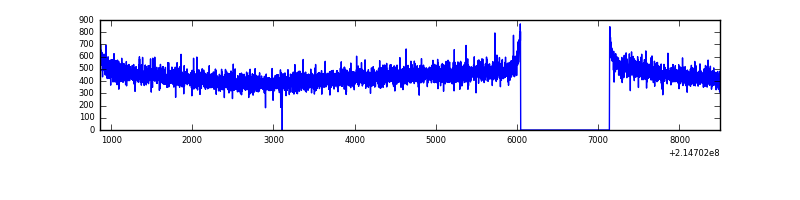 |
| D | 7636 | 6542 | 15 | 15 | 0.20% | 0.23% | 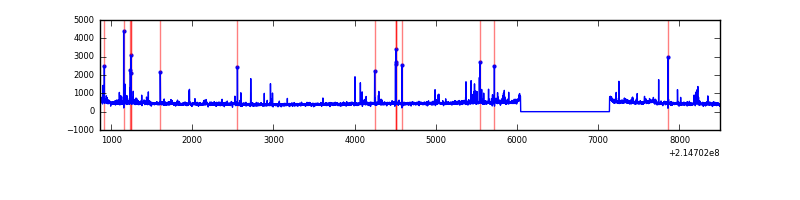 |
Top three noisy pixels from each quadrant. If the there are fewer than three noisy pixels in the level2.evt file, extra rows are filled as -1
| Pixel properties | Quadrant properties | ||||||
|---|---|---|---|---|---|---|---|
| Quadrant | DetID | PixID | Counts | Sigma | Mean | Median | Sigma |
| A | 0 | 50 | 22971 | 142.78 | 758 | 739 | 155.7 |
| A | 0 | 226 | 7353 | 42.47 | 758 | 739 | 155.7 |
| A | 12 | 194 | 7287 | 42.05 | 758 | 739 | 155.7 |
| B | 15 | 85 | 80059 | 535.82 | 770 | 752 | 148.0 |
| B | 15 | 204 | 59233 | 395.12 | 770 | 752 | 148.0 |
| B | 0 | 219 | 18552 | 120.26 | 770 | 752 | 148.0 |
| C | 13 | 61 | 5979 | 30.02 | 741 | 745 | 174.3 |
| C | 3 | 202 | 1905 | 6.65 | 741 | 745 | 174.3 |
| C | 7 | 247 | 1641 | 5.14 | 741 | 745 | 174.3 |
| D | 10 | 15 | 91280 | 497.47 | 735 | 714 | 182.1 |
| D | 8 | 195 | 51518 | 279.06 | 735 | 714 | 182.1 |
| D | 2 | 14 | 42012 | 226.85 | 735 | 714 | 182.1 |
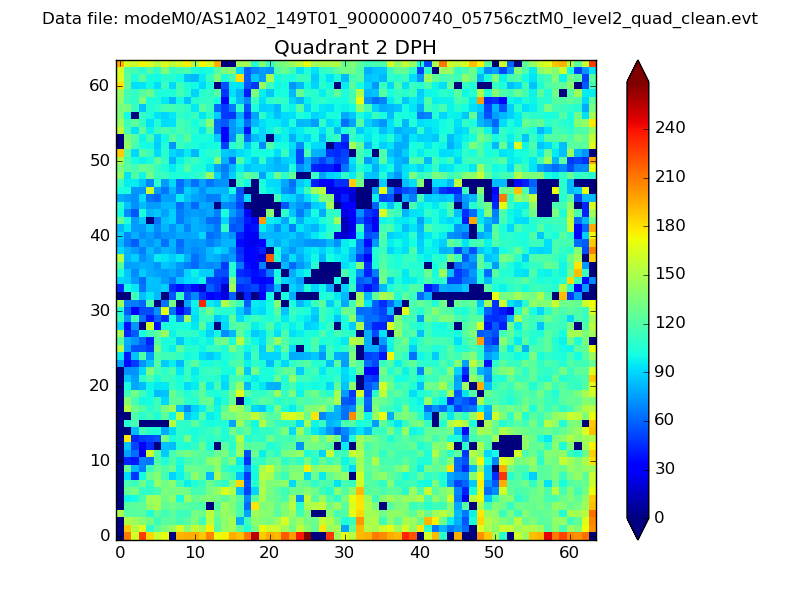
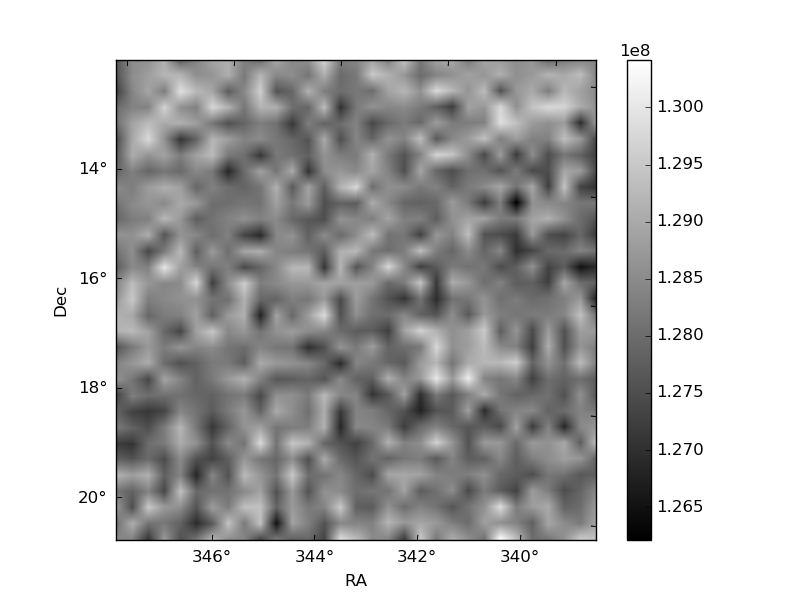
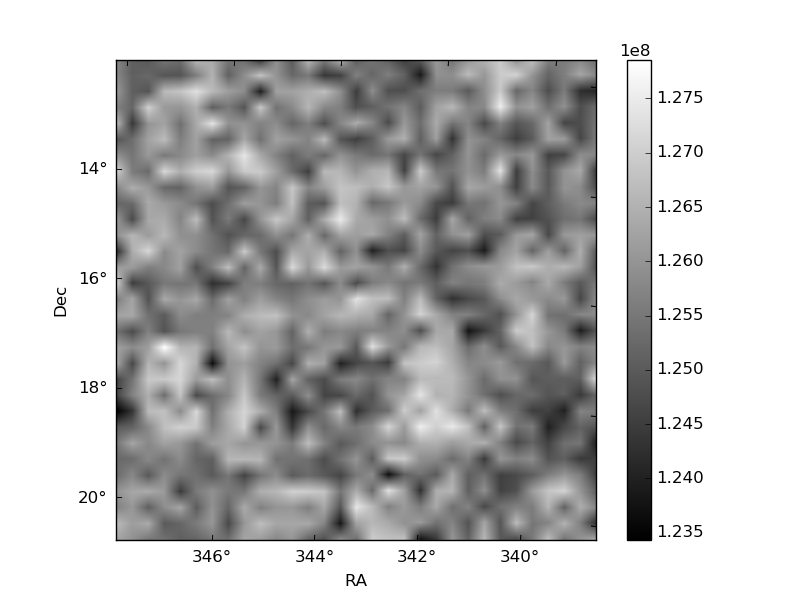
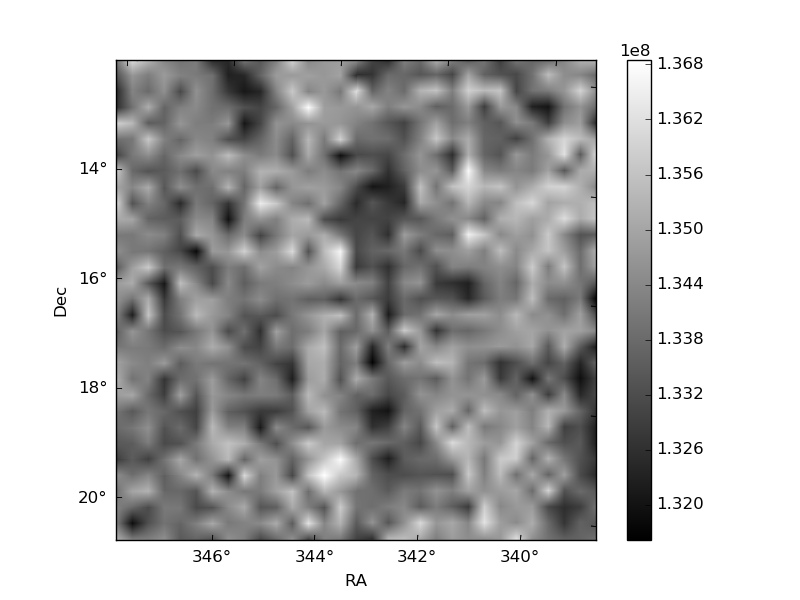
Histogram calculated using DETX and DETY for each event in the final _common_clean file
| Quadrant A | 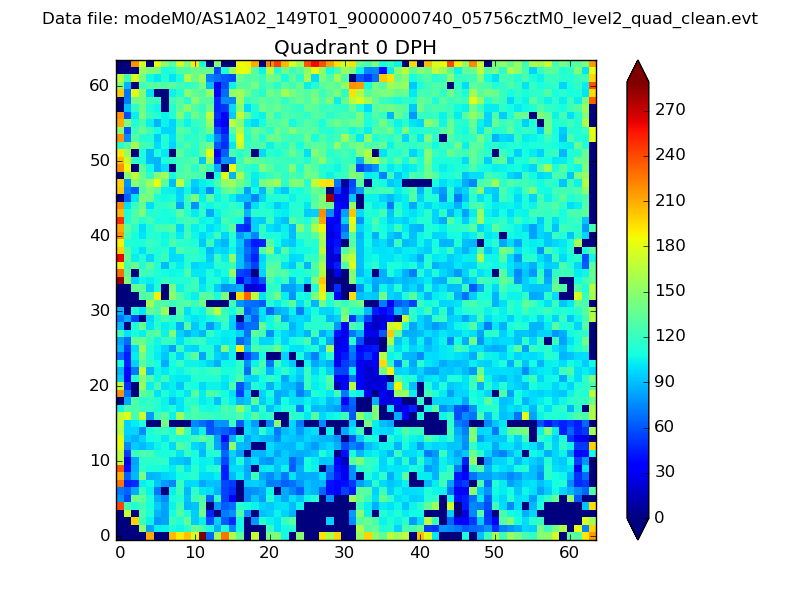 |
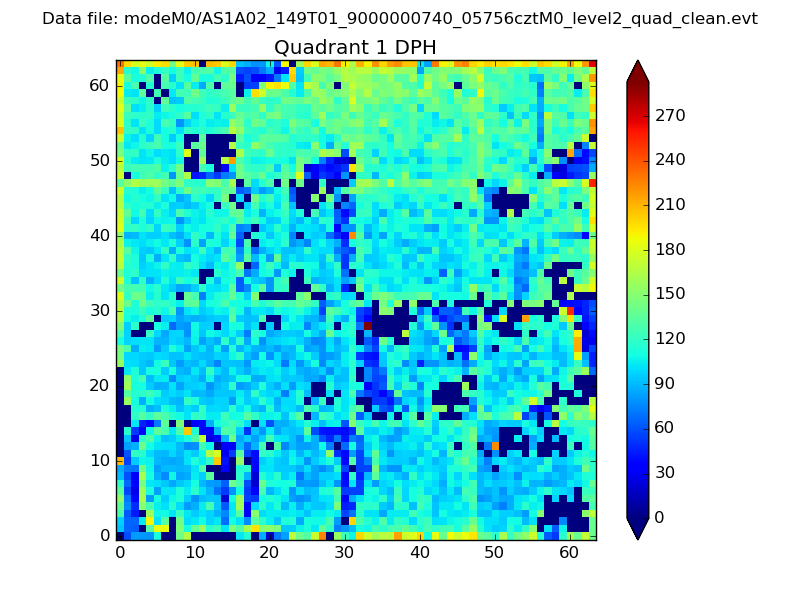 |
Quadrant B |
|---|---|---|---|
| Quadrant D | 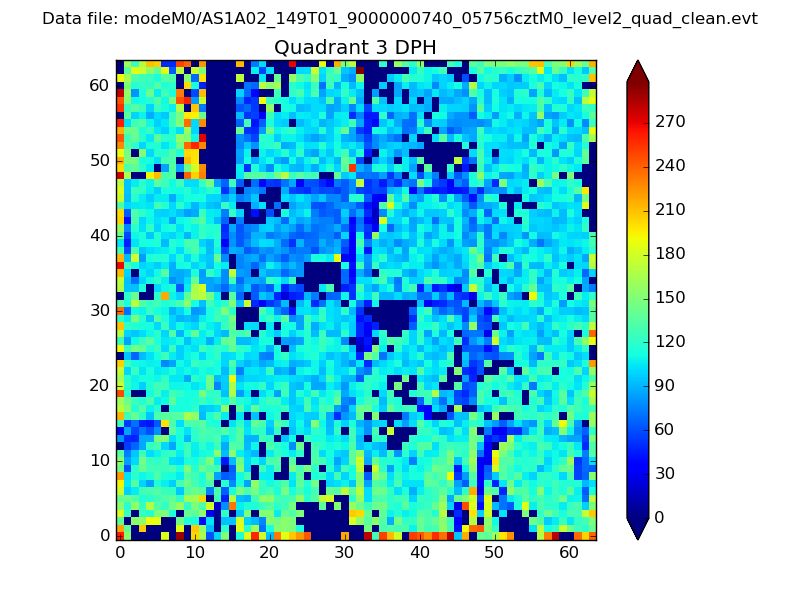 |
 |
Quadrant C |
| Plot type | Count rate plots | Images |
|---|---|---|
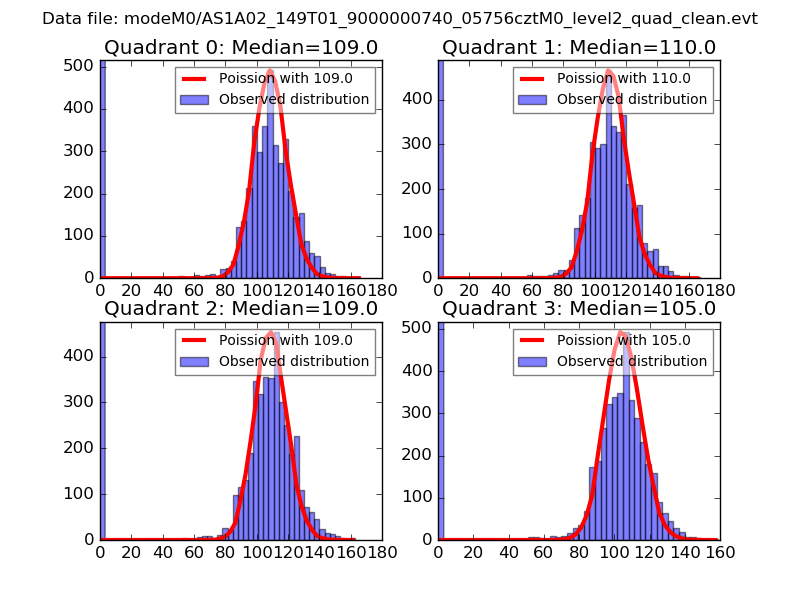
| Comparison with Poisson distribution Blue bars denote a histogram of data divided into 1 sec bins. Red curve is a Poisson curve with rate = median count rate of data. |
 |
 |
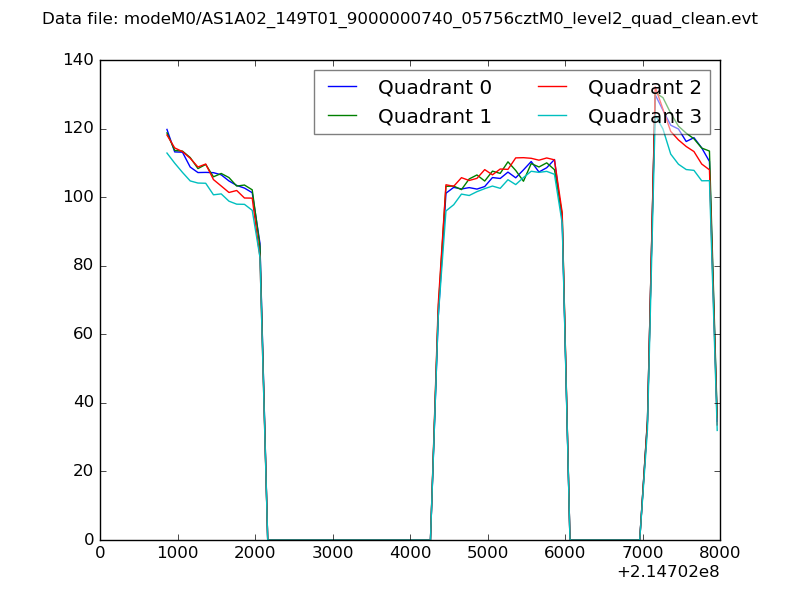
| Quadrant-wise count rates Data is divided into 100 sec bins |
 |
|
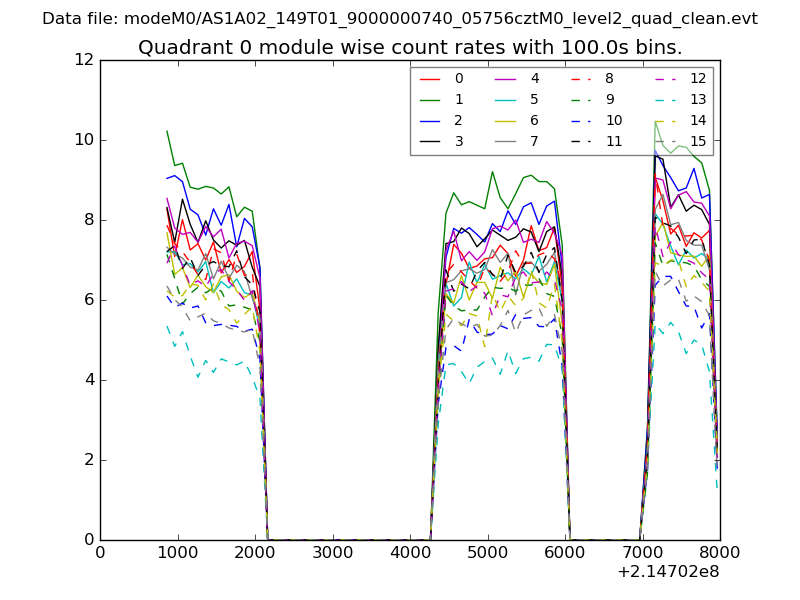
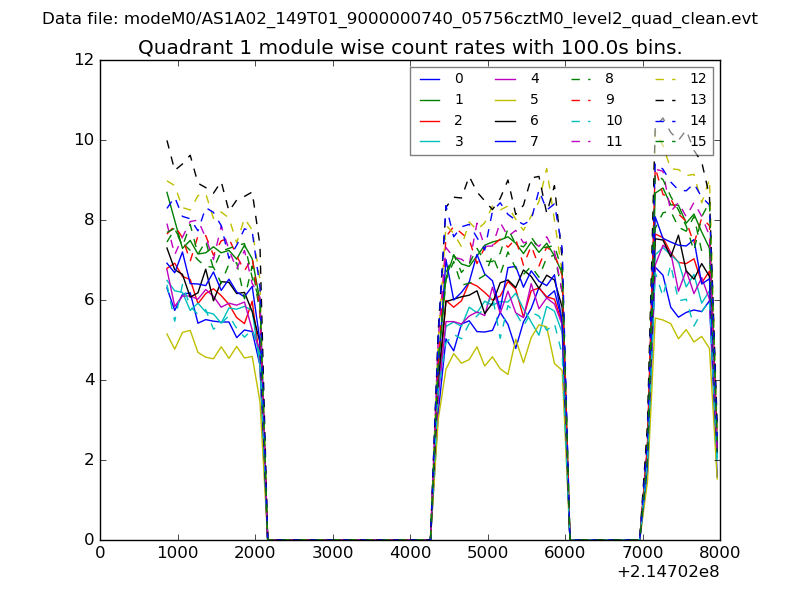
| Module-wise count rates for Quadrant A Data is divided into 100 sec bins |
 |
 |
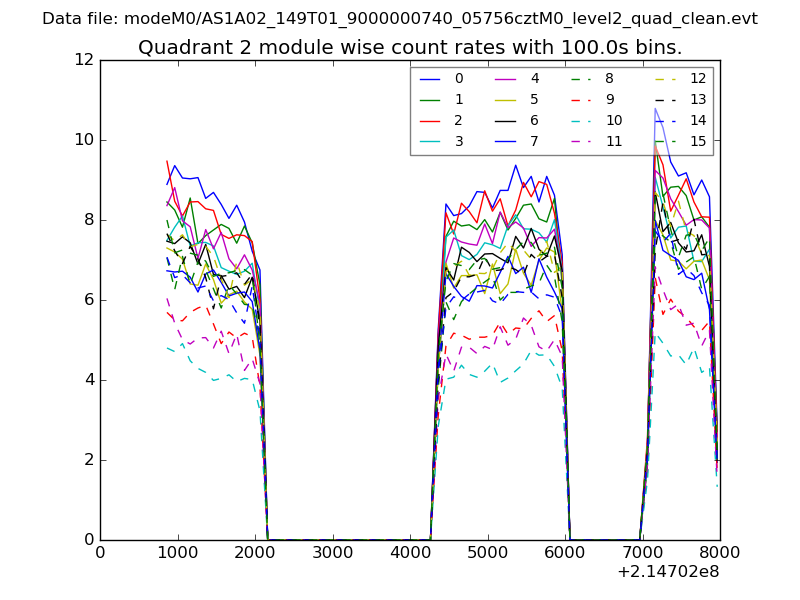
| Module-wise count rates for Quadrant B Data is divided into 100 sec bins |
 |
 |
| Module-wise count rates for Quadrant C Data is divided into 100 sec bins |
 |
 |
| Module-wise count rates for Quadrant D Data is divided into 100 sec bins |
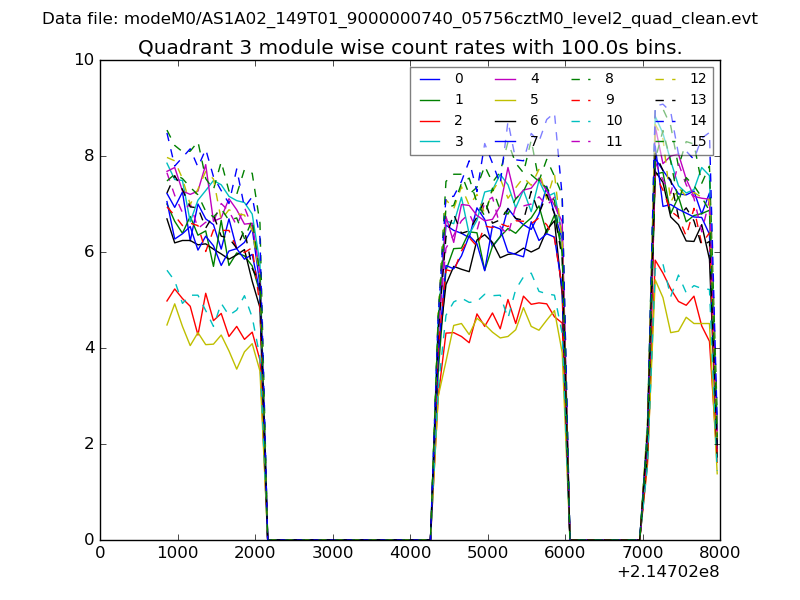 |
 |
| Parameter | Plot |
|---|---|
| CZT HV Monitor | 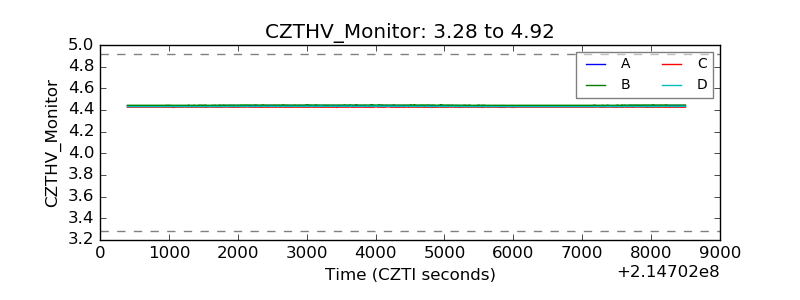 |
| D_VDD | 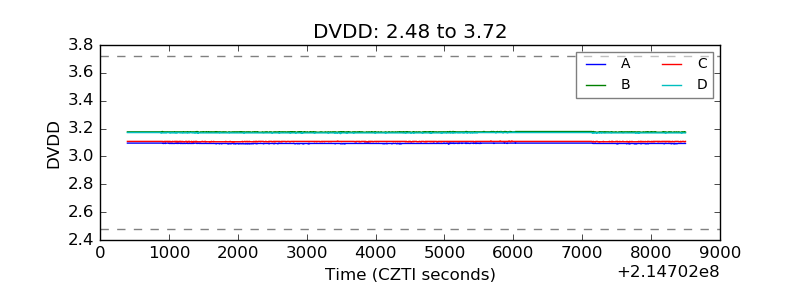 |
| Temperature 1 | 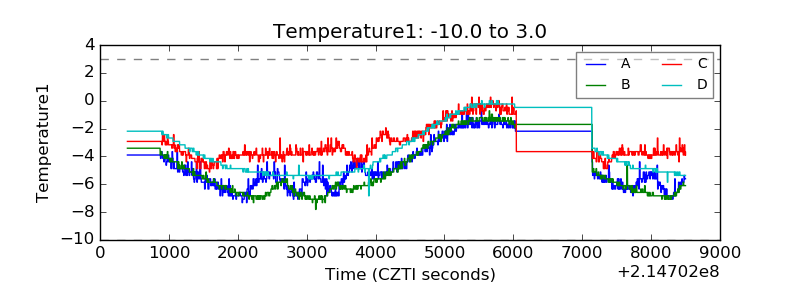 |
| Veto HV Monitor | 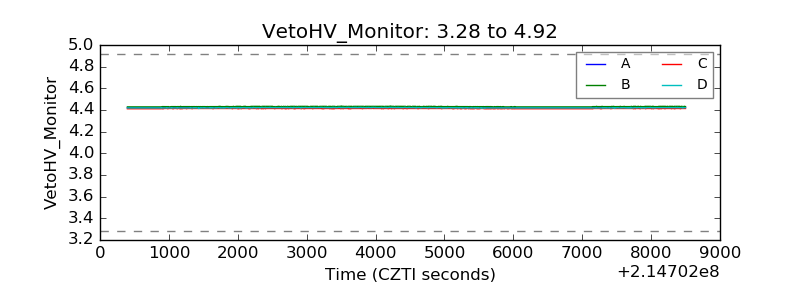 |
| Veto LLD | 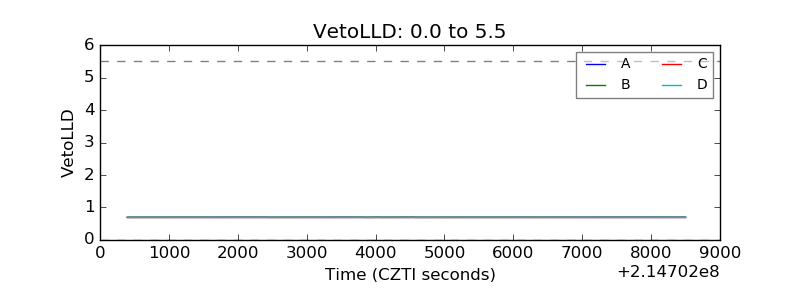 |
| Alpha Counter | 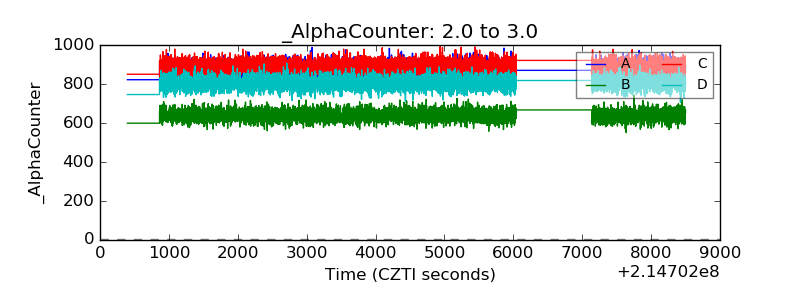 |
| _CPM_Rate | 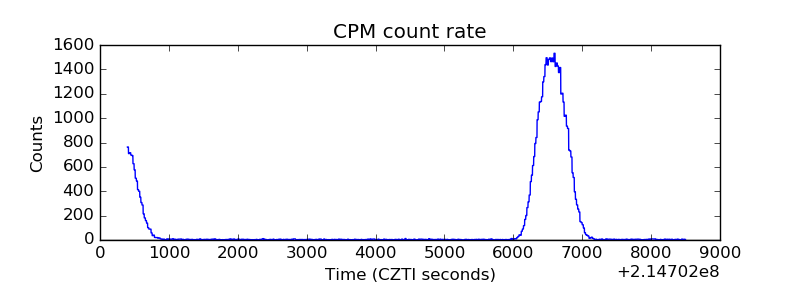 |
| CZT Counter | 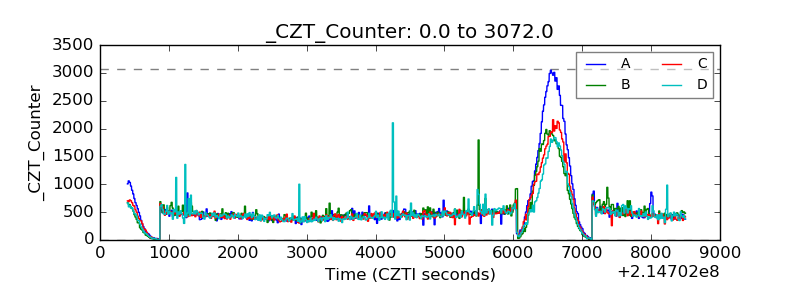 |
| +2.5 Volts monitor |  |
| +5 Volts monitor |  |
| _ROLL_ROT | 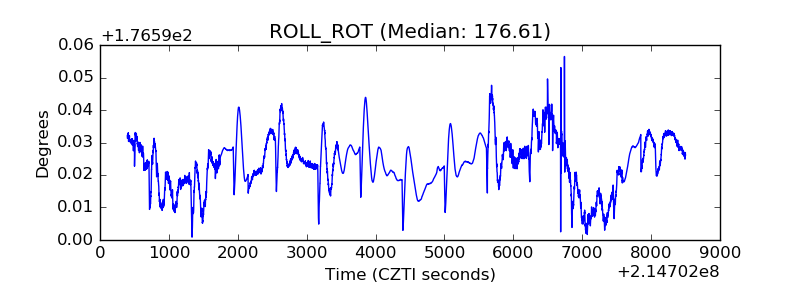 |
| _Roll_DEC | 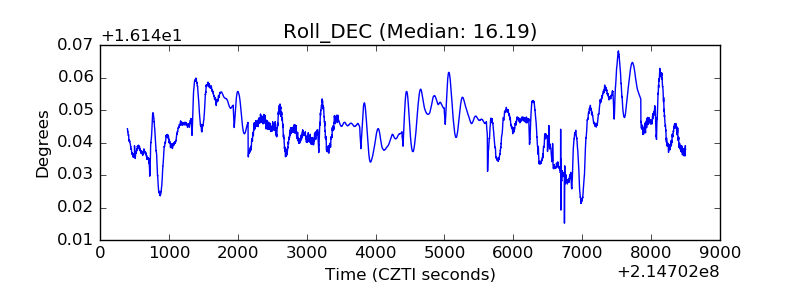 |
| _Roll_RA | 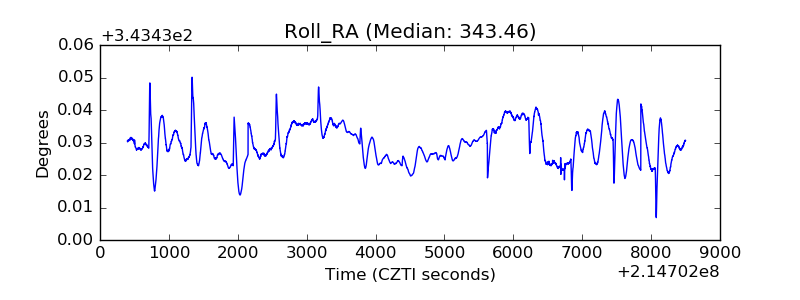 |
| Veto Counter | 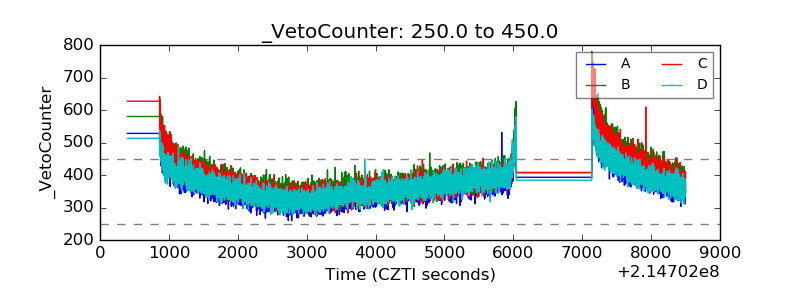 |