| Param | Original file | Final file |
|---|---|---|
| Filename | modeM0/AS1A02_149T01_9000000740_05758cztM0_level2.evt | modeM0/AS1A02_149T01_9000000740_05758cztM0_level2_quad_clean.evt |
| Size (bytes) | 429,595,200 | 64,491,840 |
| Size | 409.7 MB | 61.5 MB |
| Events in quadrant A | 3,141,414 | 377,801 |
| Events in quadrant B | 3,296,960 | 384,181 |
| Events in quadrant C | 2,988,161 | 378,930 |
| Events in quadrant D | 3,141,400 | 357,951 |
| Mode M9 | |||
|---|---|---|---|
| Quadrant | BADHDUFLAG | Total packets | Discarded packets |
| A | 0 | 21 | 0 |
| B | 0 | 21 | 0 |
| C | 0 | 21 | 0 |
| D | 0 | 21 | 0 |
| Mode SS | |||
|---|---|---|---|
| Quadrant | BADHDUFLAG | Total packets | Discarded packets |
| A | 0 | 134 | 0 |
| B | 0 | 134 | 0 |
| C | 0 | 134 | 0 |
| D | 0 | 134 | 0 |
| Mode M0 | |||
|---|---|---|---|
| Quadrant | BADHDUFLAG | Total packets | Discarded packets |
| A | 0 | 13587 | 3 |
| B | 0 | 14032 | 2 |
| C | 0 | 13282 | 2 |
| D | 0 | 13660 | 2 |
| Quadrant | Total seconds | Saturated seconds | Saturation percentage |
|---|---|---|---|
| A | 6498 | 55 | 0.846414% |
| B | 6498 | 56 | 0.861804% |
| C | 6498 | 31 | 0.477070% |
| D | 6498 | 33 | 0.507849% |
Noise dominated data is calculated using 1-second bins in cleaned event files. If a bin has >2000 counts, and if more than 50% of those come from <1% of pixels, then it is considered to be noise-dominated and hence unusable.
| Quadrant | # 1 sec bins | Bins with >0 counts | Bins with >2000 counts | High rate bins dominated by noise | Noise dominated (total time) | Noise dominated (detector-on time) | Marked lightcurve |
|---|---|---|---|---|---|---|---|
| A | 7668 | 6499 | 15 | 15 | 0.20% | 0.23% | 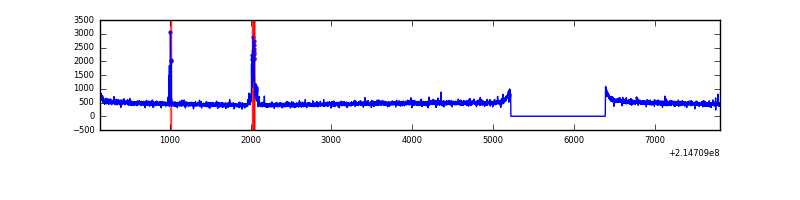 |
| B | 7668 | 6499 | 5 | 5 | 0.07% | 0.08% | 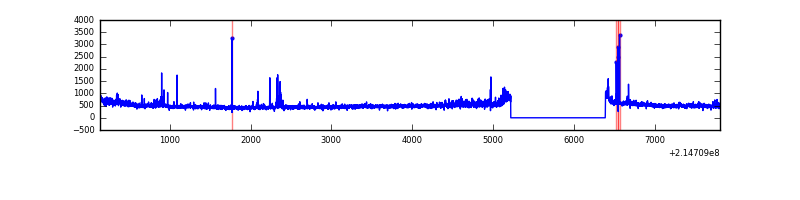 |
| C | 7668 | 6499 | 1 | 1 | 0.01% | 0.02% | 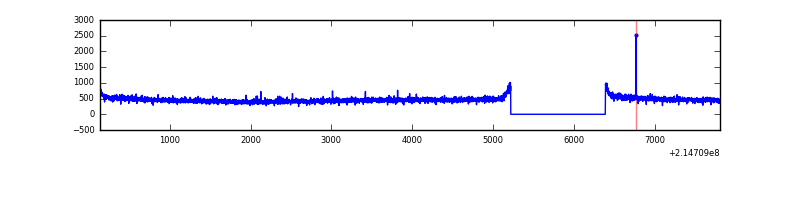 |
| D | 7668 | 6499 | 8 | 8 | 0.10% | 0.12% | 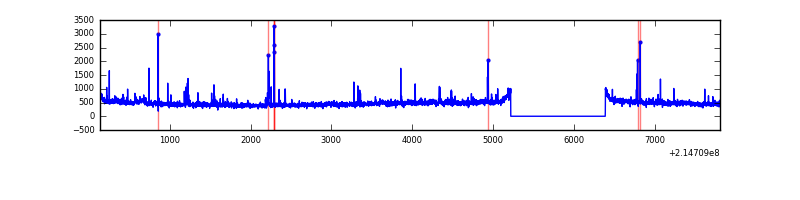 |
Top three noisy pixels from each quadrant. If the there are fewer than three noisy pixels in the level2.evt file, extra rows are filled as -1
| Pixel properties | Quadrant properties | ||||||
|---|---|---|---|---|---|---|---|
| Quadrant | DetID | PixID | Counts | Sigma | Mean | Median | Sigma |
| A | 0 | 50 | 116269 | 720.08 | 785 | 769 | 160.4 |
| A | 0 | 226 | 7546 | 42.25 | 785 | 769 | 160.4 |
| A | 12 | 194 | 7490 | 41.9 | 785 | 769 | 160.4 |
| B | 15 | 204 | 76431 | 497.85 | 798 | 780 | 152.0 |
| B | 4 | 81 | 40978 | 264.54 | 798 | 780 | 152.0 |
| B | 15 | 85 | 35019 | 225.32 | 798 | 780 | 152.0 |
| C | 8 | 79 | 7073 | 35.59 | 764 | 770 | 177.1 |
| C | 13 | 61 | 6326 | 31.37 | 764 | 770 | 177.1 |
| C | 3 | 202 | 1914 | 6.46 | 764 | 770 | 177.1 |
| D | 8 | 195 | 115281 | 619.68 | 755 | 733 | 184.8 |
| D | 12 | 233 | 36075 | 191.19 | 755 | 733 | 184.8 |
| D | 2 | 209 | 25987 | 136.62 | 755 | 733 | 184.8 |
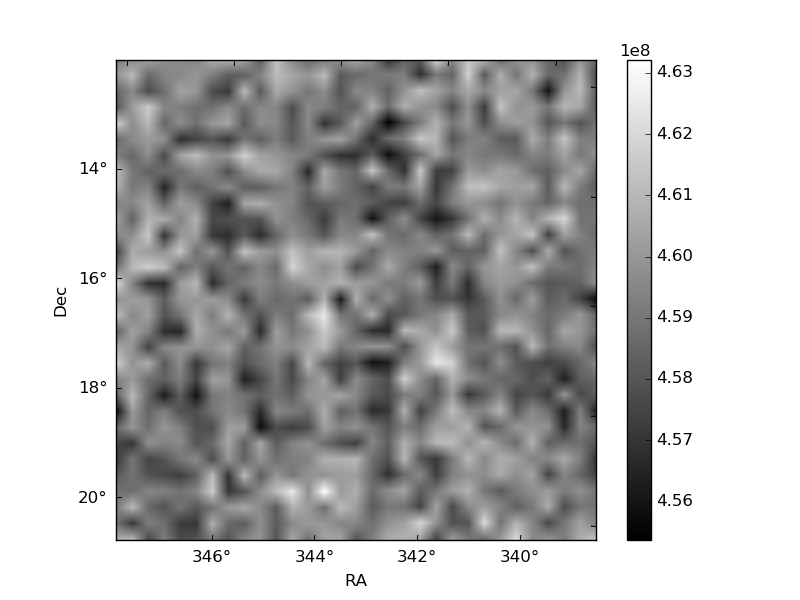
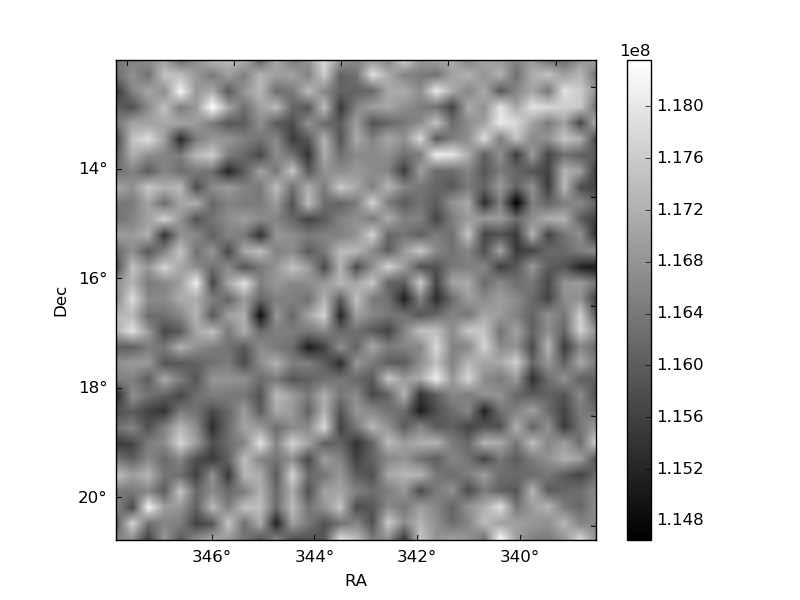
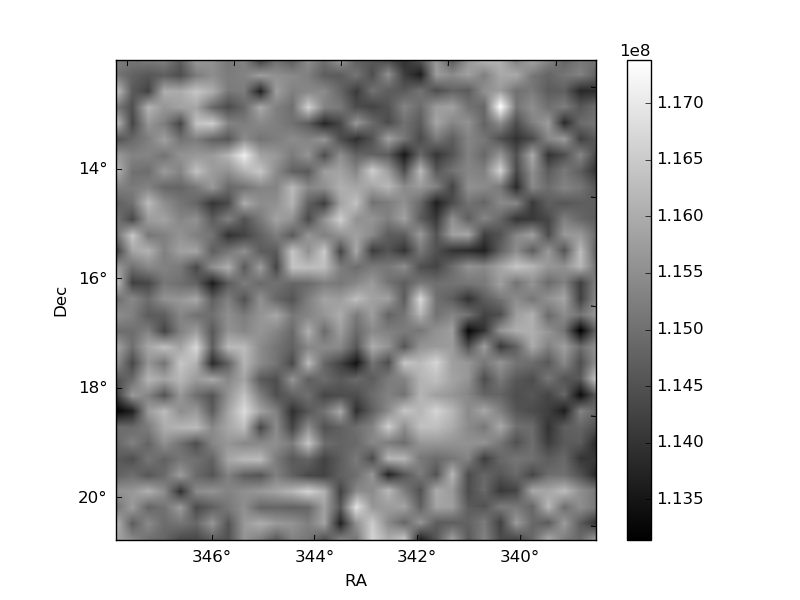
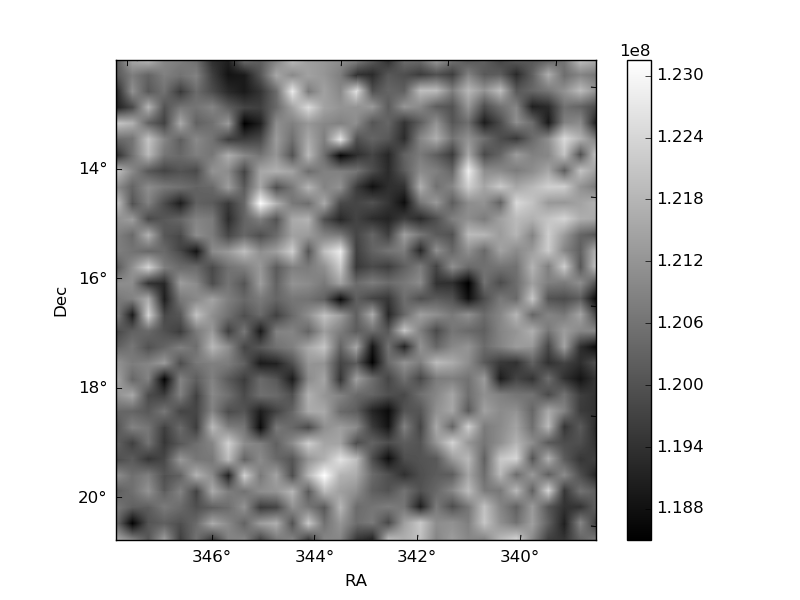
Histogram calculated using DETX and DETY for each event in the final _common_clean file
| Quadrant A | 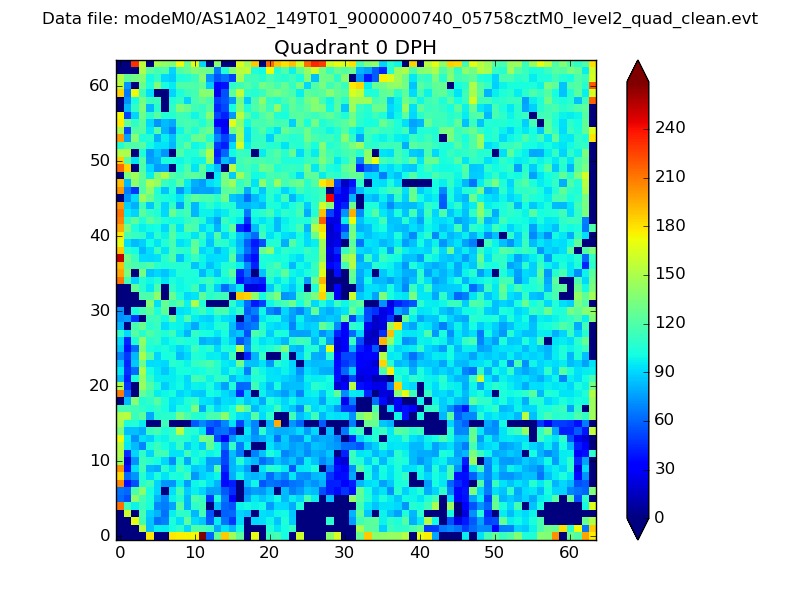 |
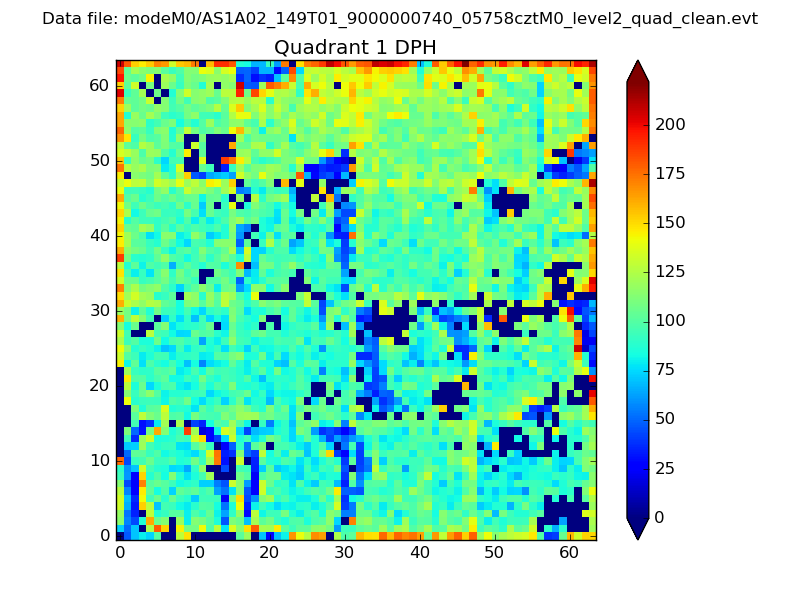 |
Quadrant B |
|---|---|---|---|
| Quadrant D | 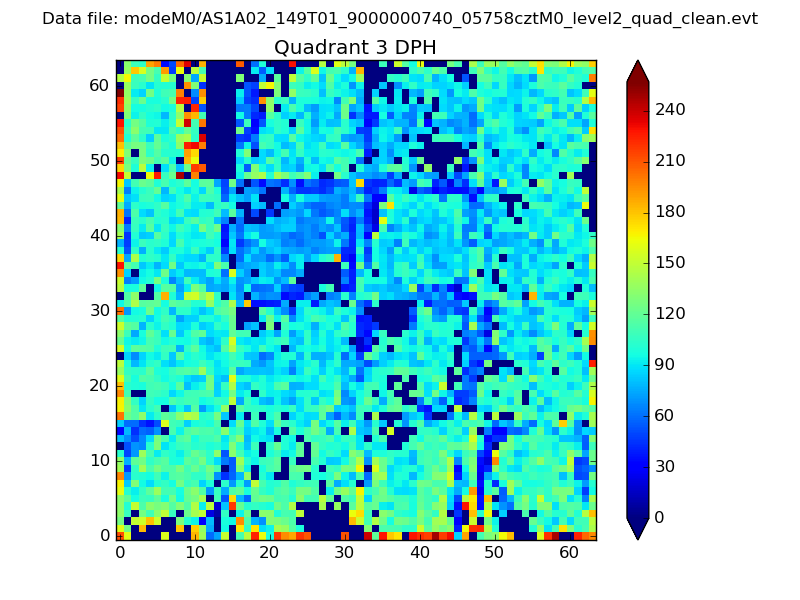 |
 |
Quadrant C |
| Plot type | Count rate plots | Images |
|---|---|---|
| Comparison with Poisson distribution Blue bars denote a histogram of data divided into 1 sec bins. Red curve is a Poisson curve with rate = median count rate of data. |
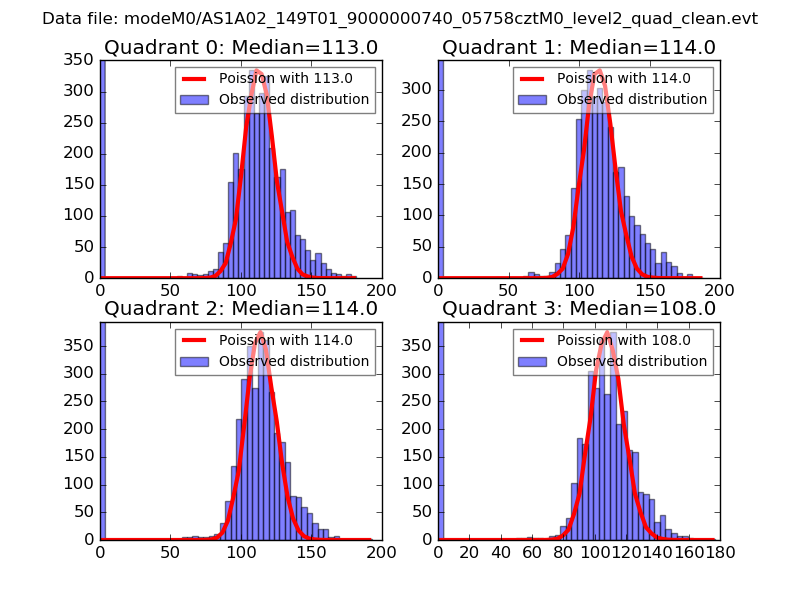 |
 |
| Quadrant-wise count rates Data is divided into 100 sec bins |
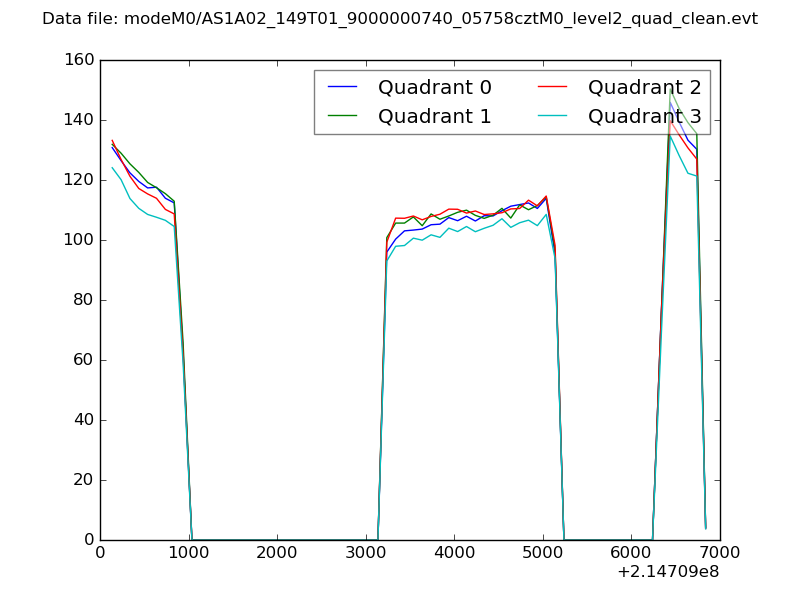 |
|
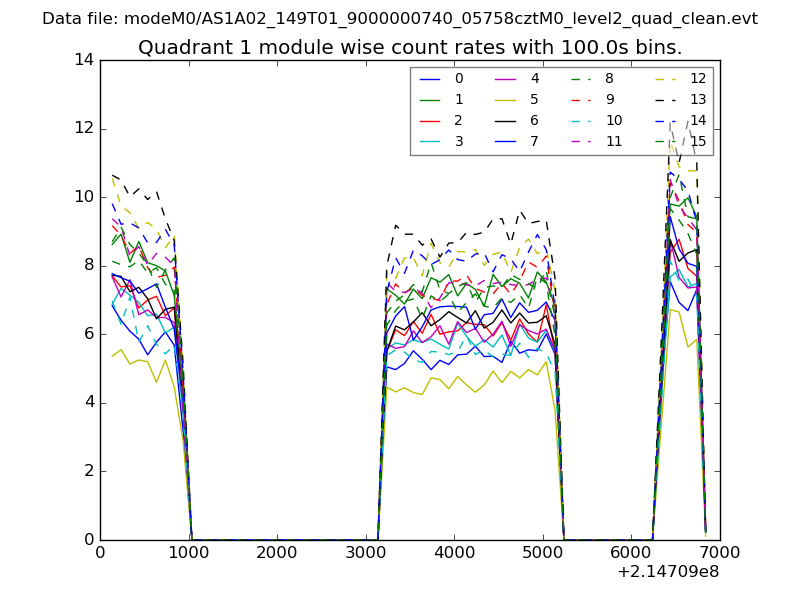
| Module-wise count rates for Quadrant A Data is divided into 100 sec bins |
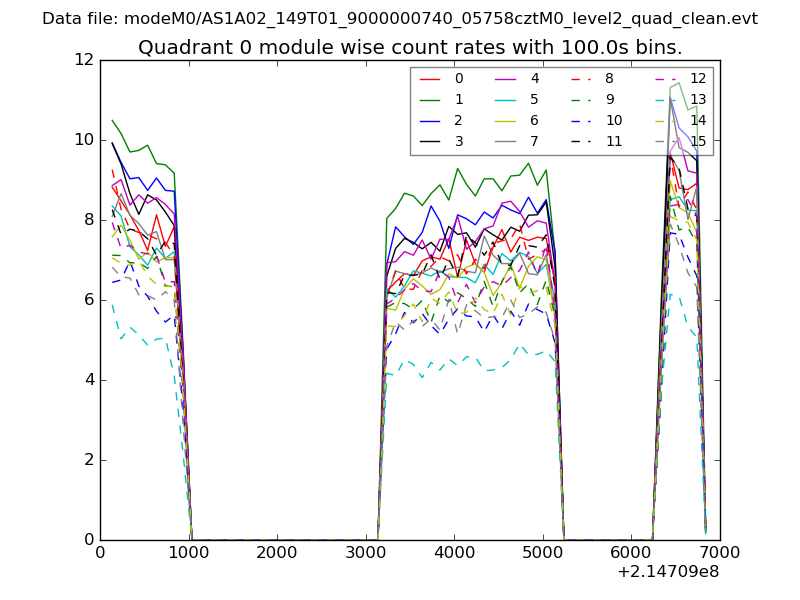 |
 |
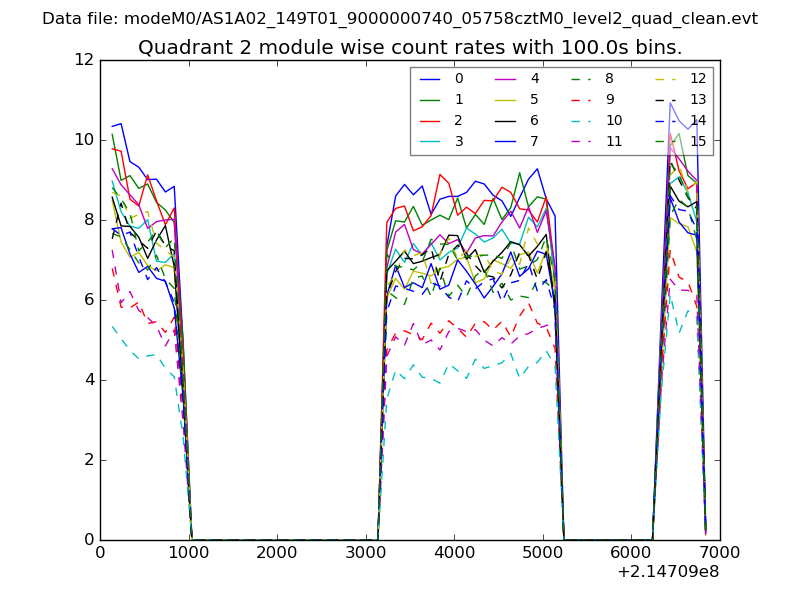
| Module-wise count rates for Quadrant B Data is divided into 100 sec bins |
 |
 |
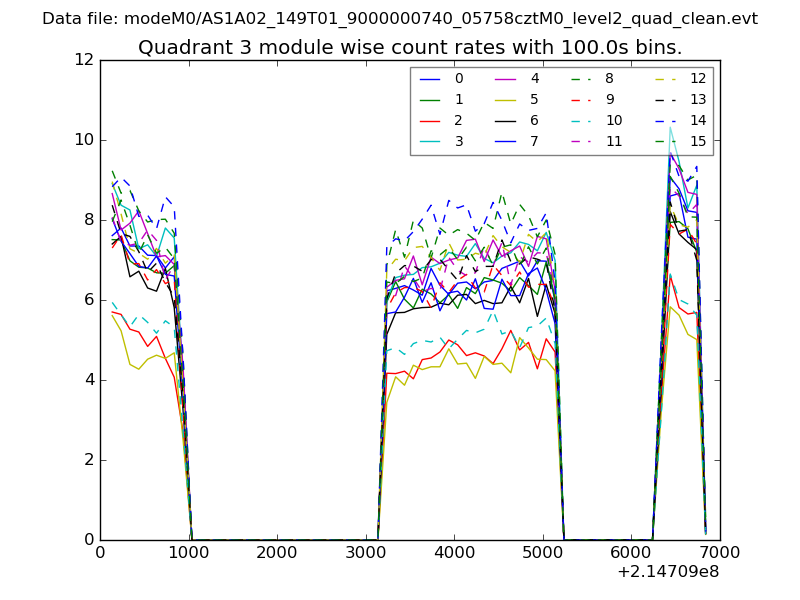
| Module-wise count rates for Quadrant C Data is divided into 100 sec bins |
 |
 |
| Module-wise count rates for Quadrant D Data is divided into 100 sec bins |
 |
 |
| Parameter | Plot |
|---|---|
| CZT HV Monitor | 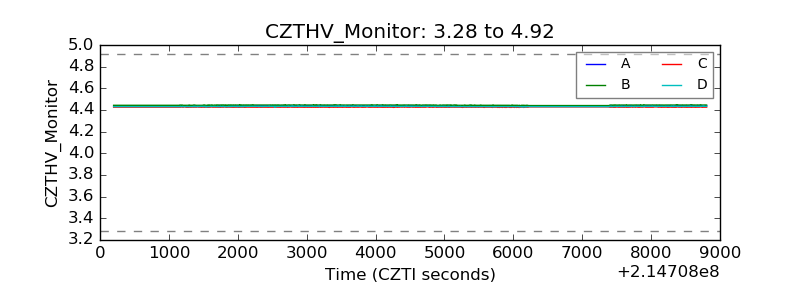 |
| D_VDD | 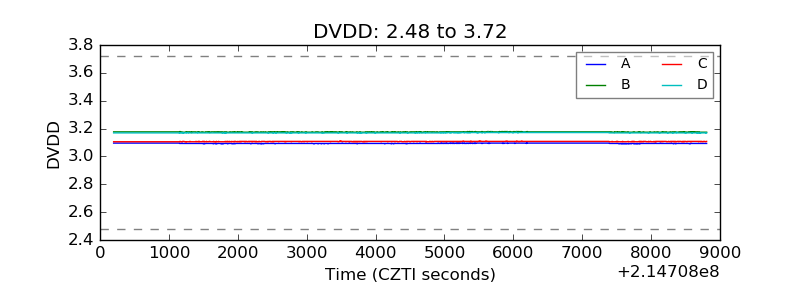 |
| Temperature 1 | 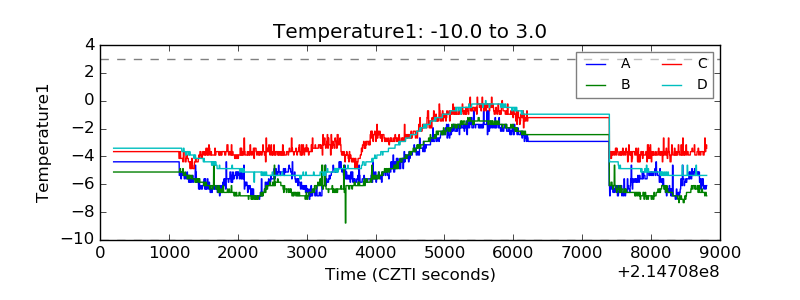 |
| Veto HV Monitor | 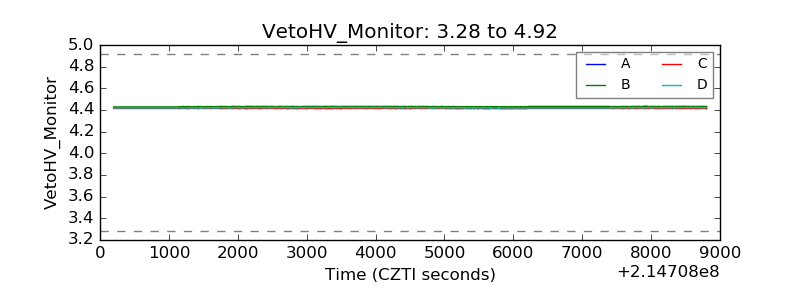 |
| Veto LLD | 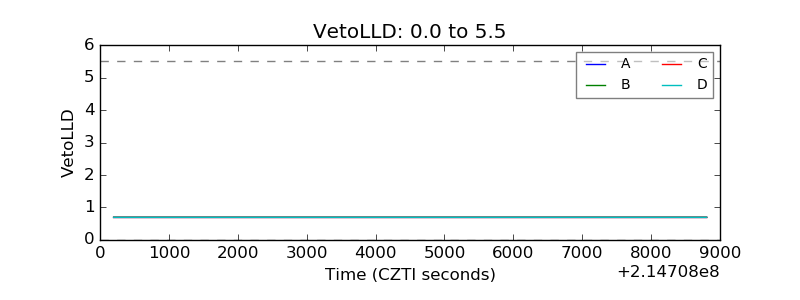 |
| Alpha Counter | 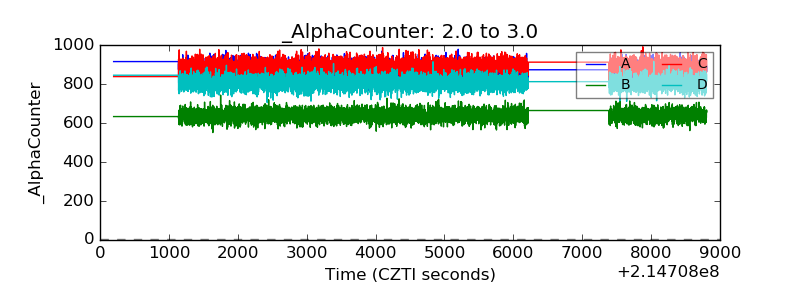 |
| _CPM_Rate | 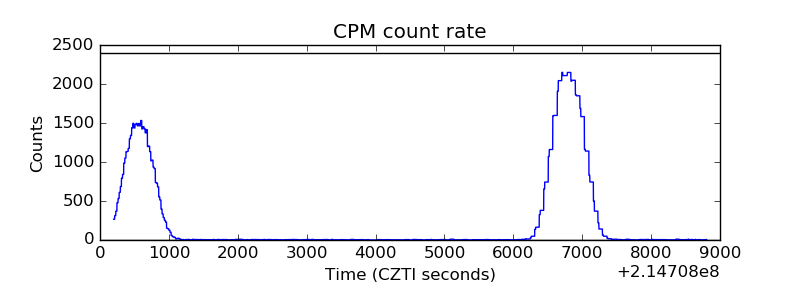 |
| CZT Counter |  |
| +2.5 Volts monitor |  |
| +5 Volts monitor |  |
| _ROLL_ROT | 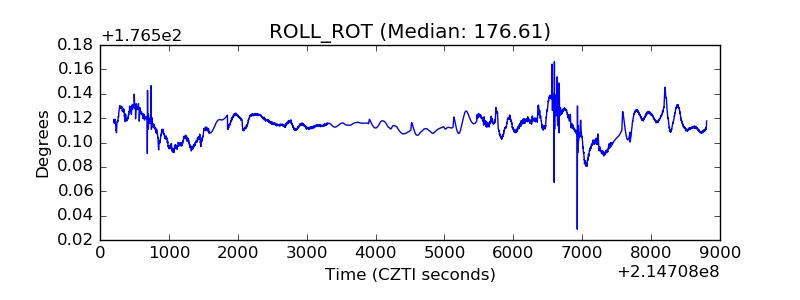 |
| _Roll_DEC | 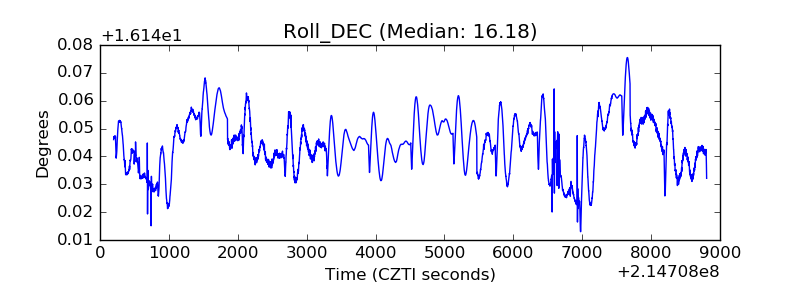 |
| _Roll_RA | 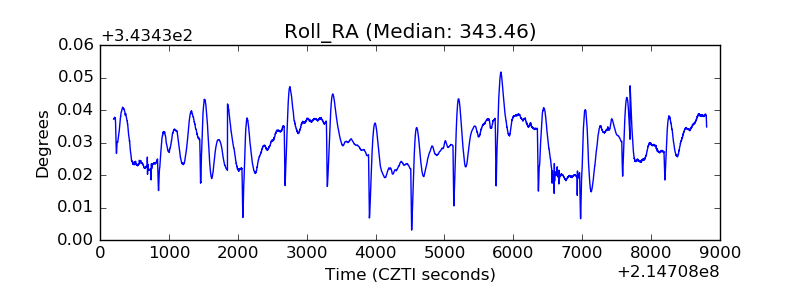 |
| Veto Counter | 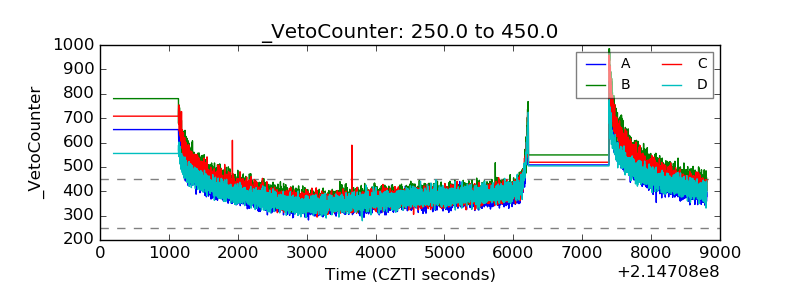 |