| Param | Original file | Final file |
|---|---|---|
| Filename | modeM0/AS1A02_149T01_9000000740_05761cztM0_level2.evt | modeM0/AS1A02_149T01_9000000740_05761cztM0_level2_quad_clean.evt |
| Size (bytes) | 431,069,760 | 60,451,200 |
| Size | 411.1 MB | 57.7 MB |
| Events in quadrant A | 3,173,949 | 348,563 |
| Events in quadrant B | 3,270,088 | 355,223 |
| Events in quadrant C | 3,105,890 | 351,064 |
| Events in quadrant D | 3,075,314 | 334,247 |
| Mode M9 | |||
|---|---|---|---|
| Quadrant | BADHDUFLAG | Total packets | Discarded packets |
| A | 0 | 20 | 0 |
| B | 0 | 20 | 0 |
| C | 0 | 20 | 0 |
| D | 0 | 21 | 0 |
| Mode SS | |||
|---|---|---|---|
| Quadrant | BADHDUFLAG | Total packets | Discarded packets |
| A | 0 | 128 | 0 |
| B | 0 | 128 | 0 |
| C | 0 | 128 | 0 |
| D | 0 | 128 | 0 |
| Mode M0 | |||
|---|---|---|---|
| Quadrant | BADHDUFLAG | Total packets | Discarded packets |
| A | 0 | 13234 | 3 |
| B | 0 | 13384 | 2 |
| C | 0 | 13156 | 2 |
| D | 0 | 13288 | 2 |
| Quadrant | Total seconds | Saturated seconds | Saturation percentage |
|---|---|---|---|
| A | 6321 | 83 | 1.313083% |
| B | 6321 | 92 | 1.455466% |
| C | 6321 | 57 | 0.901756% |
| D | 6321 | 49 | 0.775194% |
Noise dominated data is calculated using 1-second bins in cleaned event files. If a bin has >2000 counts, and if more than 50% of those come from <1% of pixels, then it is considered to be noise-dominated and hence unusable.
| Quadrant | # 1 sec bins | Bins with >0 counts | Bins with >2000 counts | High rate bins dominated by noise | Noise dominated (total time) | Noise dominated (detector-on time) | Marked lightcurve |
|---|---|---|---|---|---|---|---|
| A | 7616 | 6322 | 0 | 0 | 0.00% | 0.00% | 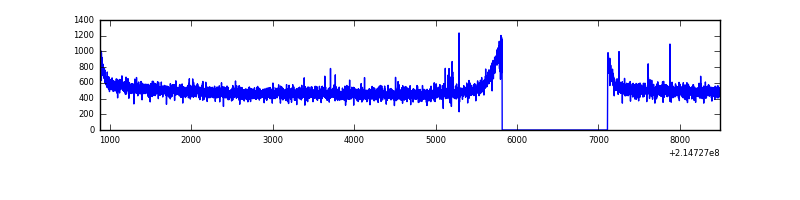 |
| B | 7616 | 6322 | 0 | 0 | 0.00% | 0.00% | 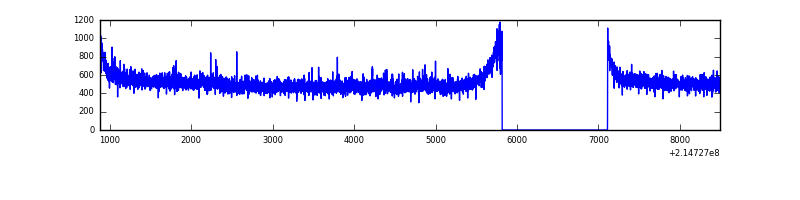 |
| C | 7616 | 6322 | 0 | 0 | 0.00% | 0.00% | 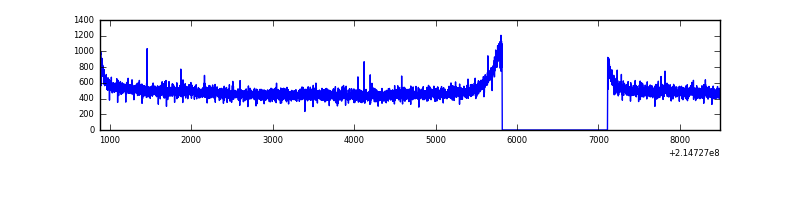 |
| D | 7616 | 6322 | 1 | 1 | 0.01% | 0.02% | 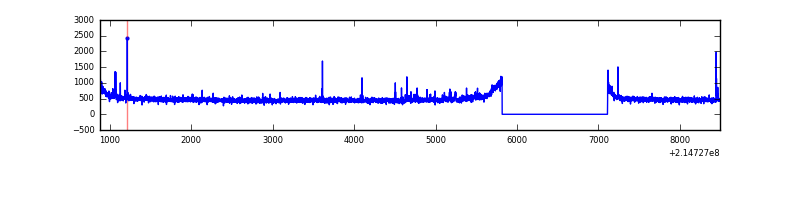 |
Top three noisy pixels from each quadrant. If the there are fewer than three noisy pixels in the level2.evt file, extra rows are filled as -1
| Pixel properties | Quadrant properties | ||||||
|---|---|---|---|---|---|---|---|
| Quadrant | DetID | PixID | Counts | Sigma | Mean | Median | Sigma |
| A | 0 | 226 | 8152 | 44.12 | 823 | 805 | 166.5 |
| A | 12 | 194 | 7993 | 43.17 | 823 | 805 | 166.5 |
| A | 14 | 111 | 6980 | 37.08 | 823 | 805 | 166.5 |
| B | 15 | 204 | 17233 | 104.38 | 831 | 814 | 157.3 |
| B | 12 | 111 | 14606 | 87.68 | 831 | 814 | 157.3 |
| B | 0 | 183 | 11570 | 68.38 | 831 | 814 | 157.3 |
| C | 9 | 16 | 9718 | 48.32 | 793 | 799 | 184.6 |
| C | 13 | 61 | 6221 | 29.37 | 793 | 799 | 184.6 |
| C | 14 | 67 | 2699 | 10.29 | 793 | 799 | 184.6 |
| D | 12 | 110 | 24542 | 122.47 | 790 | 768 | 194.1 |
| D | 12 | 221 | 18789 | 92.84 | 790 | 768 | 194.1 |
| D | 10 | 15 | 15372 | 75.23 | 790 | 768 | 194.1 |
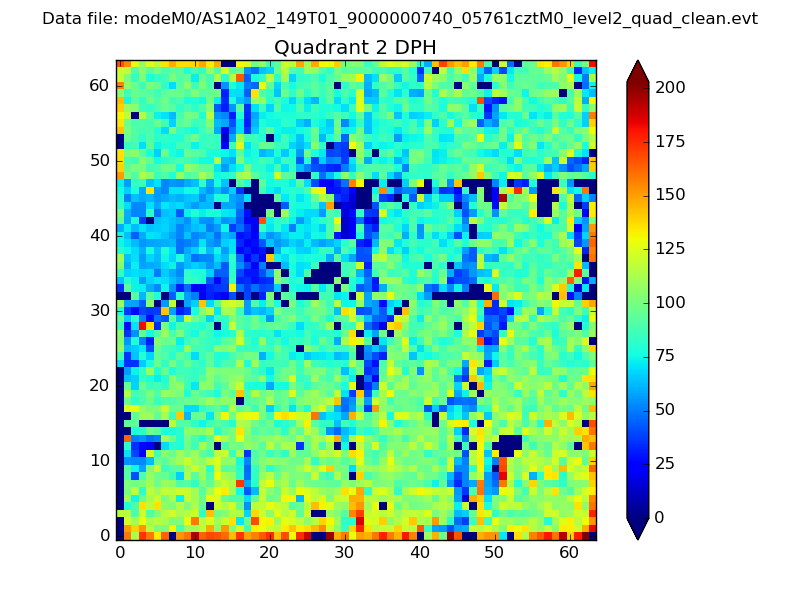
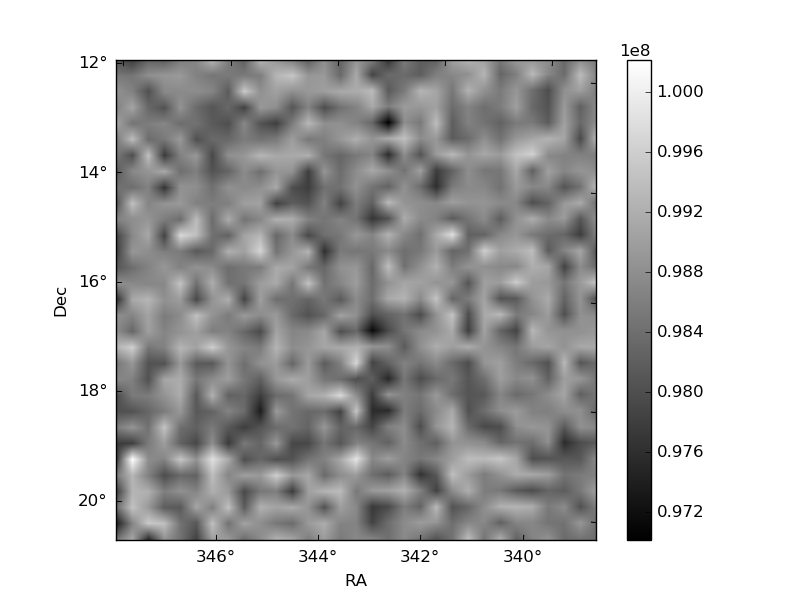
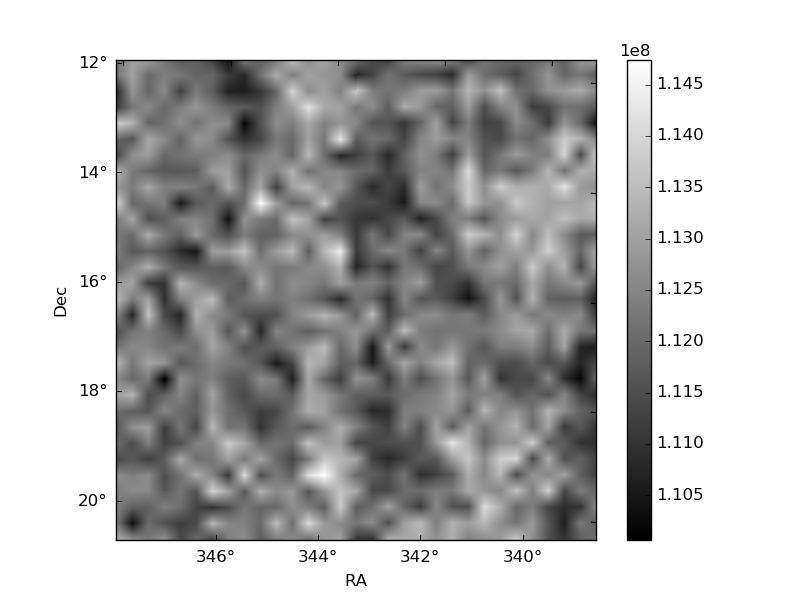
Histogram calculated using DETX and DETY for each event in the final _common_clean file
| Quadrant A | 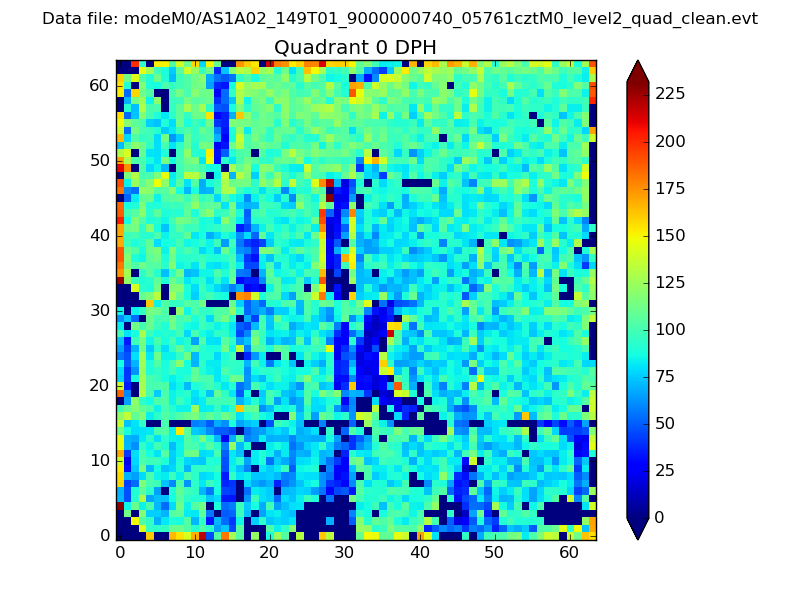 |
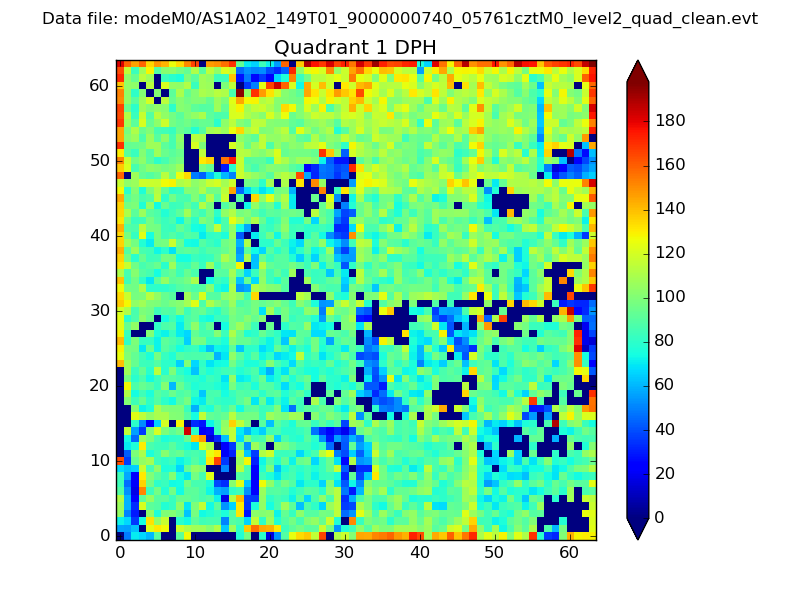 |
Quadrant B |
|---|---|---|---|
| Quadrant D | 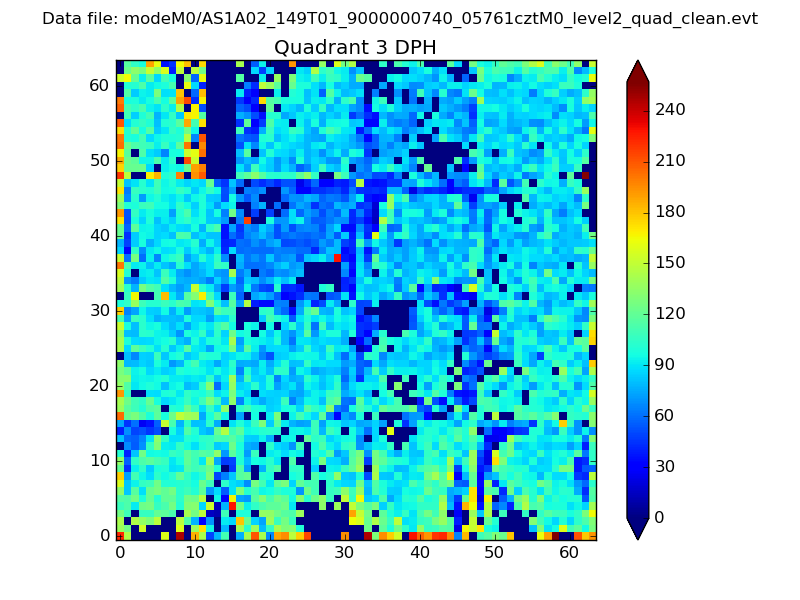 |
 |
Quadrant C |
| Plot type | Count rate plots | Images |
|---|---|---|
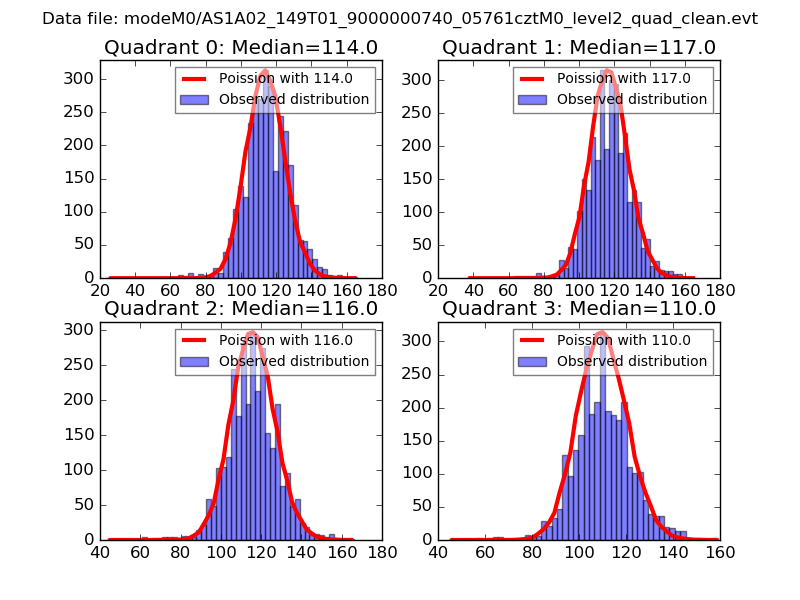
| Comparison with Poisson distribution Blue bars denote a histogram of data divided into 1 sec bins. Red curve is a Poisson curve with rate = median count rate of data. |
 |
 |
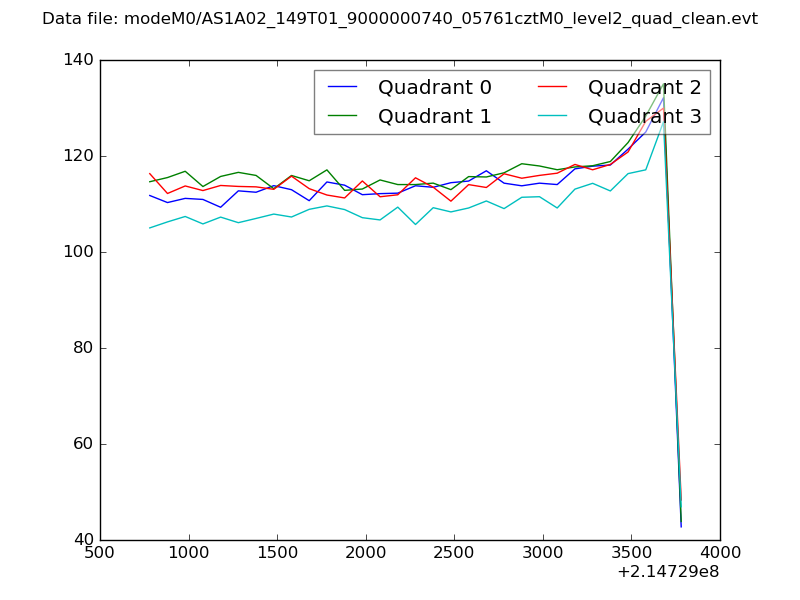
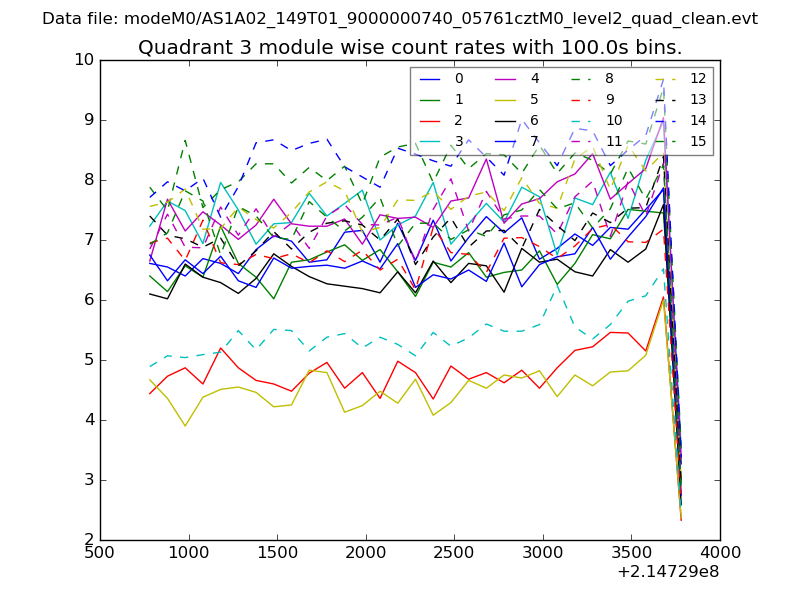
| Quadrant-wise count rates Data is divided into 100 sec bins |
 |
|
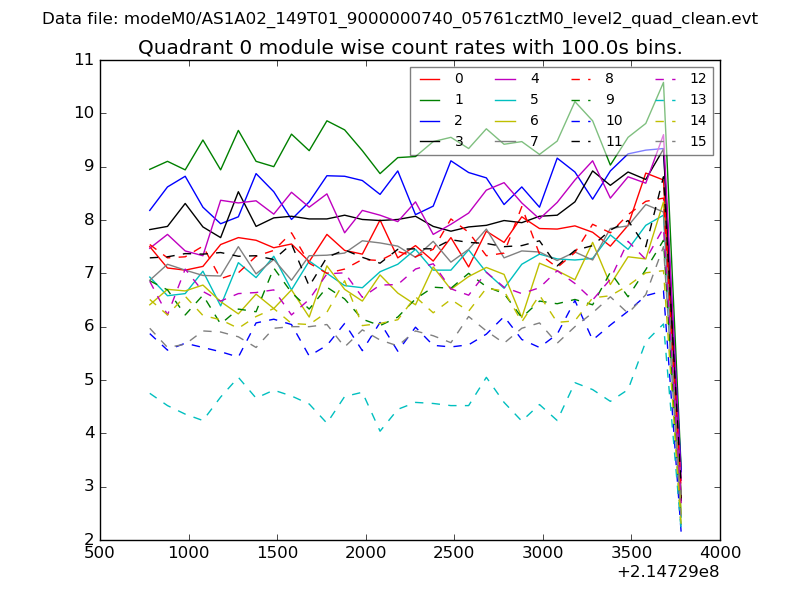
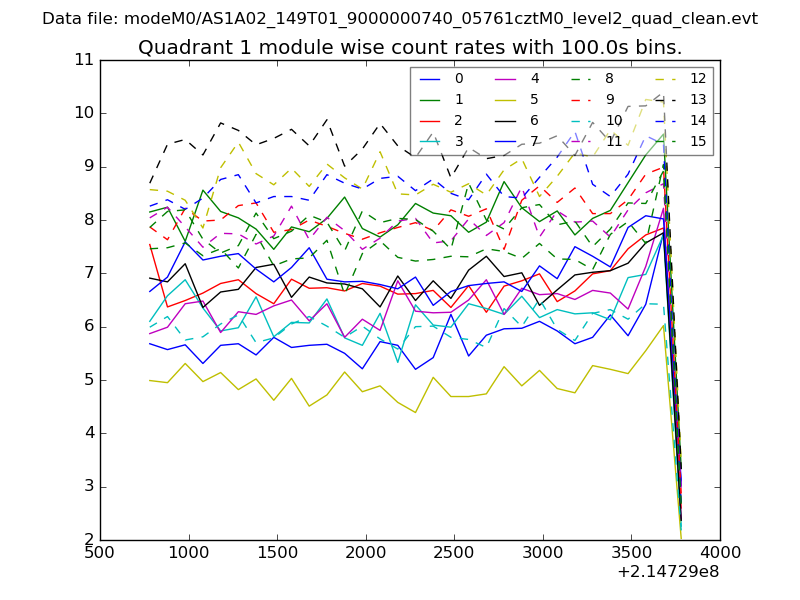
| Module-wise count rates for Quadrant A Data is divided into 100 sec bins |
 |
 |
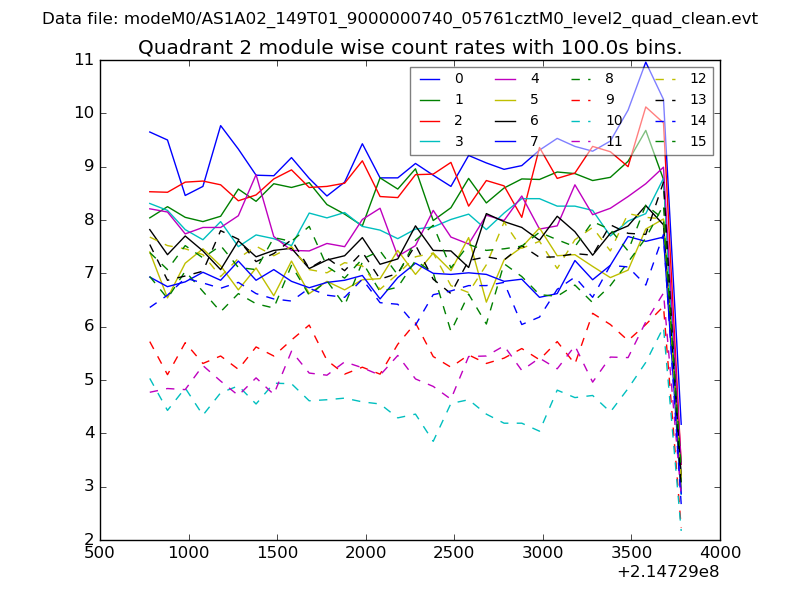
| Module-wise count rates for Quadrant B Data is divided into 100 sec bins |
 |
 |
| Module-wise count rates for Quadrant C Data is divided into 100 sec bins |
 |
 |
| Module-wise count rates for Quadrant D Data is divided into 100 sec bins |
 |
 |
| Parameter | Plot |
|---|---|
| CZT HV Monitor | 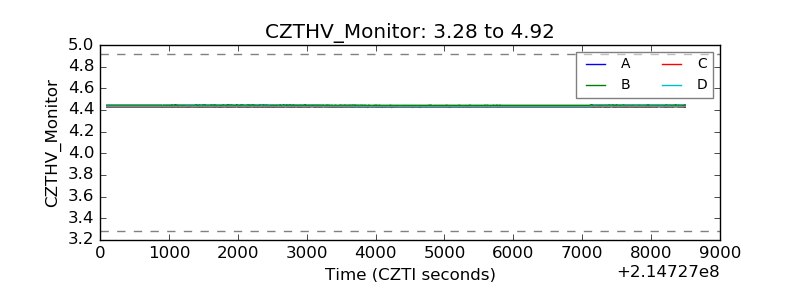 |
| D_VDD | 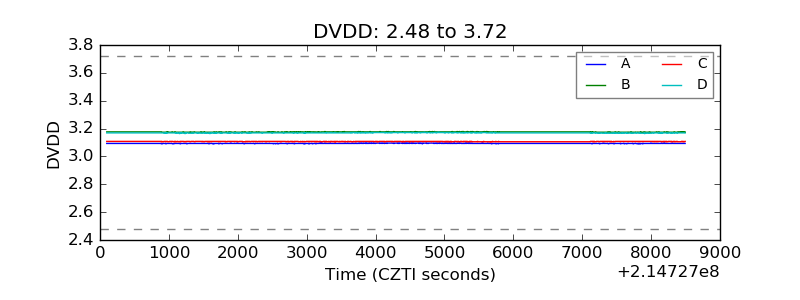 |
| Temperature 1 | 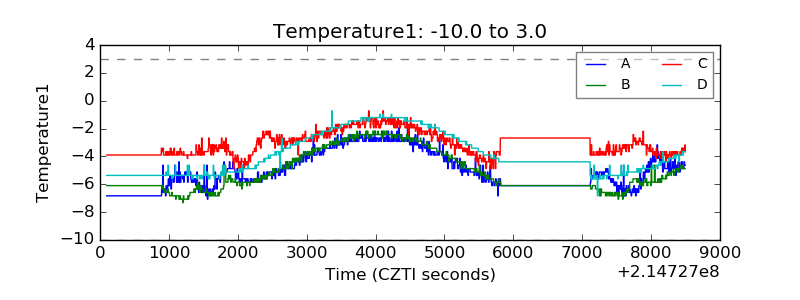 |
| Veto HV Monitor | 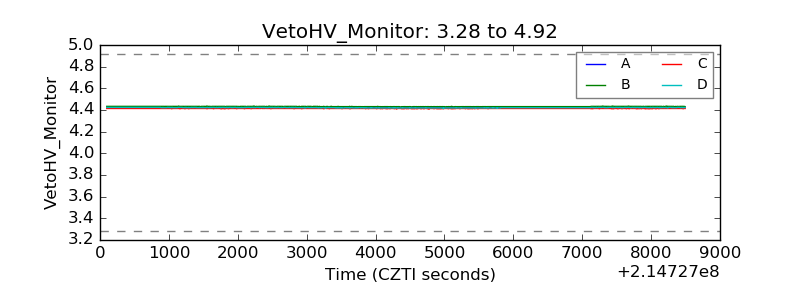 |
| Veto LLD | 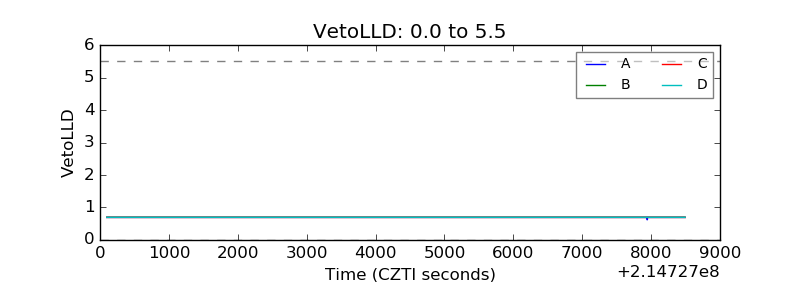 |
| Alpha Counter | 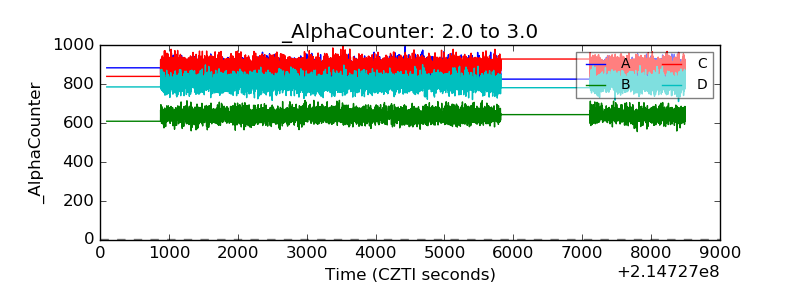 |
| _CPM_Rate | 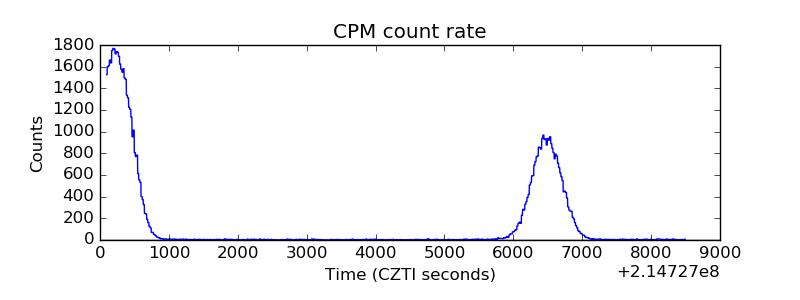 |
| CZT Counter | 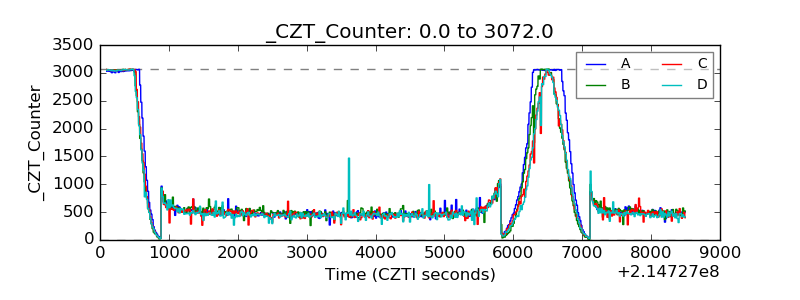 |
| +2.5 Volts monitor |  |
| +5 Volts monitor |  |
| _ROLL_ROT | 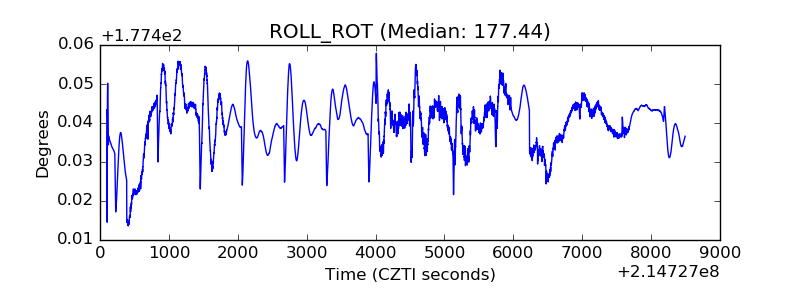 |
| _Roll_DEC | 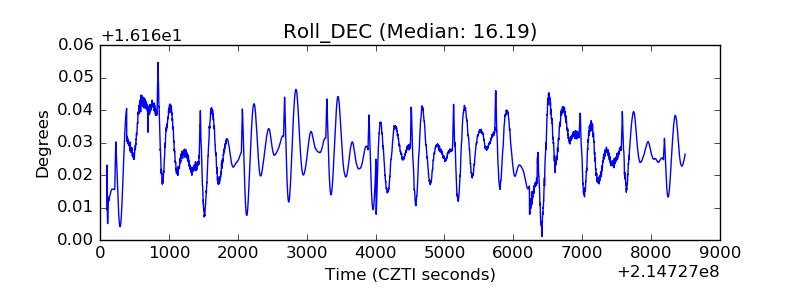 |
| _Roll_RA | 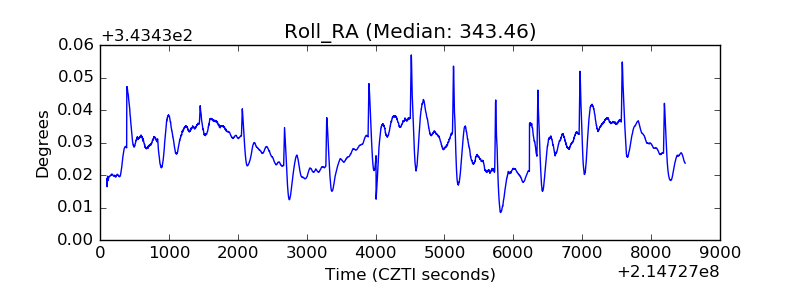 |
| Veto Counter | 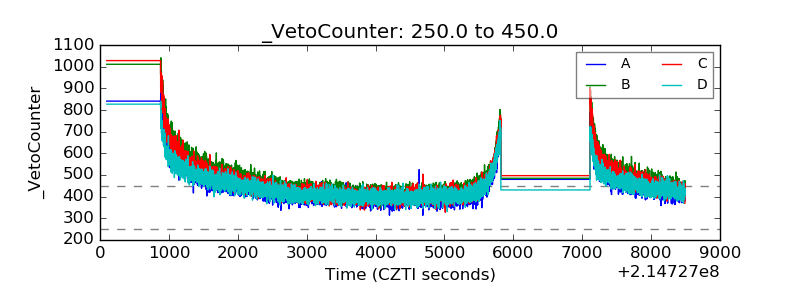 |