| Param | Original file | Final file |
|---|---|---|
| Filename | modeM0/AS1A02_149T01_9000000740_05763cztM0_level2.evt | modeM0/AS1A02_149T01_9000000740_05763cztM0_level2_quad_clean.evt |
| Size (bytes) | 454,878,720 | 75,761,280 |
| Size | 433.8 MB | 72.3 MB |
| Events in quadrant A | 3,284,208 | 453,419 |
| Events in quadrant B | 3,483,839 | 458,006 |
| Events in quadrant C | 3,230,327 | 456,553 |
| Events in quadrant D | 3,303,268 | 440,271 |
| Mode M9 | |||
|---|---|---|---|
| Quadrant | BADHDUFLAG | Total packets | Discarded packets |
| A | 0 | 15 | 0 |
| B | 0 | 15 | 0 |
| C | 0 | 15 | 0 |
| D | 0 | 16 | 0 |
| Mode SS | |||
|---|---|---|---|
| Quadrant | BADHDUFLAG | Total packets | Discarded packets |
| A | 0 | 142 | 0 |
| B | 0 | 142 | 0 |
| C | 0 | 142 | 0 |
| D | 0 | 142 | 0 |
| Mode M0 | |||
|---|---|---|---|
| Quadrant | BADHDUFLAG | Total packets | Discarded packets |
| A | 0 | 14404 | 3 |
| B | 0 | 14564 | 2 |
| C | 0 | 14374 | 2 |
| D | 0 | 14598 | 2 |
| Quadrant | Total seconds | Saturated seconds | Saturation percentage |
|---|---|---|---|
| A | 6972 | 196 | 2.811245% |
| B | 6972 | 198 | 2.839931% |
| C | 6972 | 139 | 1.993689% |
| D | 6972 | 143 | 2.051061% |
Noise dominated data is calculated using 1-second bins in cleaned event files. If a bin has >2000 counts, and if more than 50% of those come from <1% of pixels, then it is considered to be noise-dominated and hence unusable.
| Quadrant | # 1 sec bins | Bins with >0 counts | Bins with >2000 counts | High rate bins dominated by noise | Noise dominated (total time) | Noise dominated (detector-on time) | Marked lightcurve |
|---|---|---|---|---|---|---|---|
| A | 7697 | 6972 | 0 | 0 | 0.00% | 0.00% | 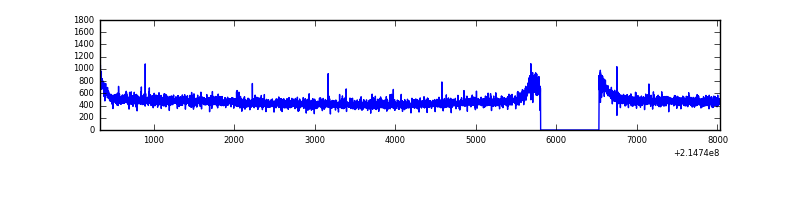 |
| B | 7697 | 6973 | 1 | 1 | 0.01% | 0.01% | 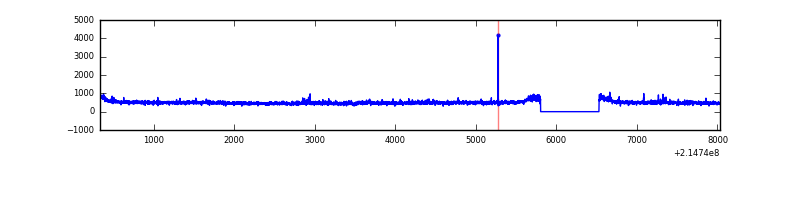 |
| C | 7697 | 6973 | 0 | 0 | 0.00% | 0.00% |  |
| D | 7697 | 6973 | 2 | 2 | 0.03% | 0.03% | 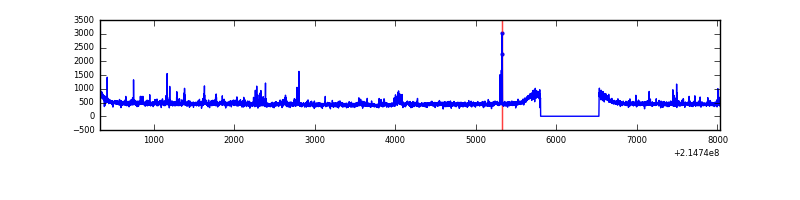 |
Top three noisy pixels from each quadrant. If the there are fewer than three noisy pixels in the level2.evt file, extra rows are filled as -1
| Pixel properties | Quadrant properties | ||||||
|---|---|---|---|---|---|---|---|
| Quadrant | DetID | PixID | Counts | Sigma | Mean | Median | Sigma |
| A | 12 | 194 | 8339 | 42.79 | 851 | 831 | 175.4 |
| A | 0 | 226 | 8172 | 41.84 | 851 | 831 | 175.4 |
| A | 13 | 254 | 3760 | 16.69 | 851 | 831 | 175.4 |
| B | 15 | 204 | 54158 | 321.65 | 857 | 837 | 165.8 |
| B | 0 | 219 | 51065 | 302.99 | 857 | 837 | 165.8 |
| B | 0 | 229 | 20087 | 116.12 | 857 | 837 | 165.8 |
| C | 13 | 61 | 6696 | 30.43 | 827 | 832 | 192.7 |
| C | 14 | 67 | 3323 | 12.93 | 827 | 832 | 192.7 |
| C | 3 | 202 | 1991 | 6.01 | 827 | 832 | 192.7 |
| D | 8 | 195 | 57827 | 280.54 | 830 | 803 | 203.3 |
| D | 12 | 110 | 49901 | 241.55 | 830 | 803 | 203.3 |
| D | 2 | 206 | 25172 | 119.89 | 830 | 803 | 203.3 |
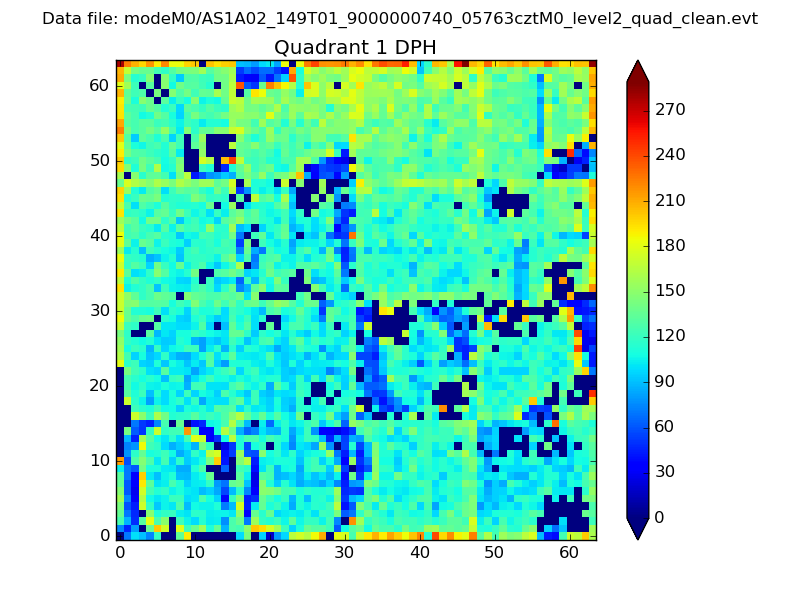
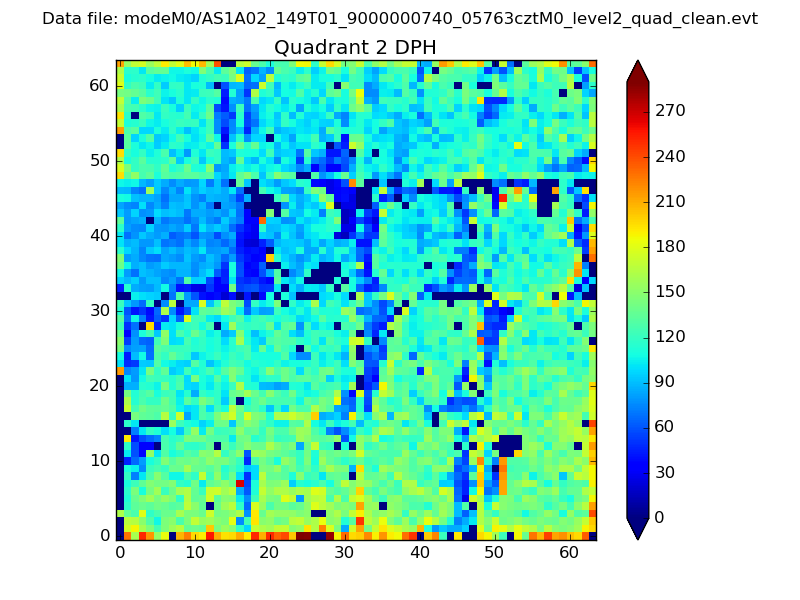
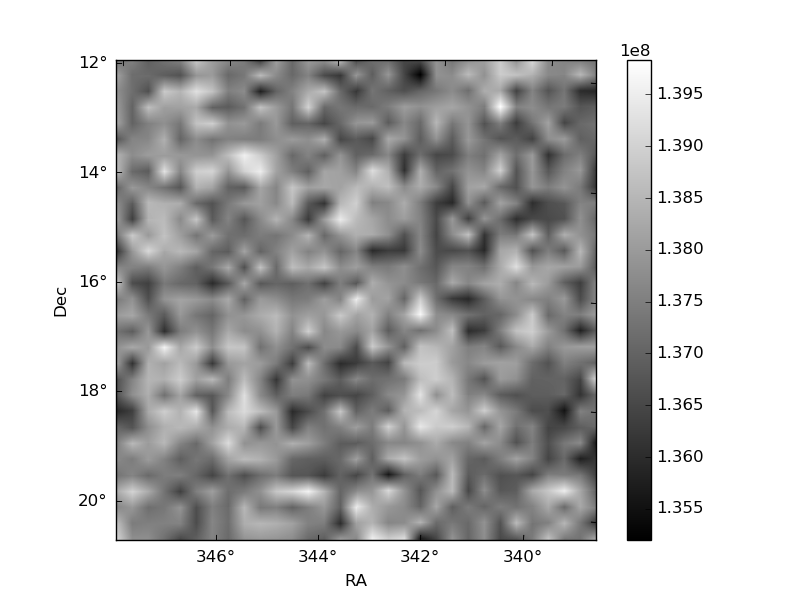
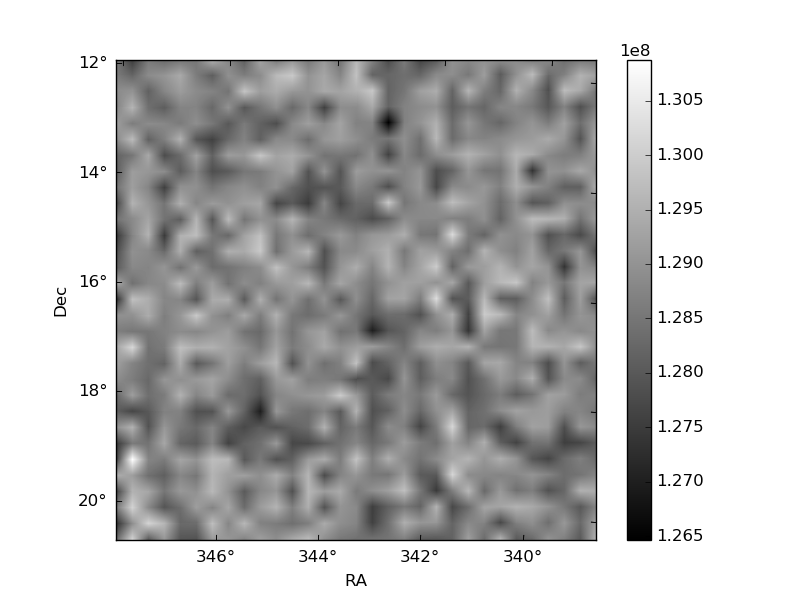
Histogram calculated using DETX and DETY for each event in the final _common_clean file
| Quadrant A | 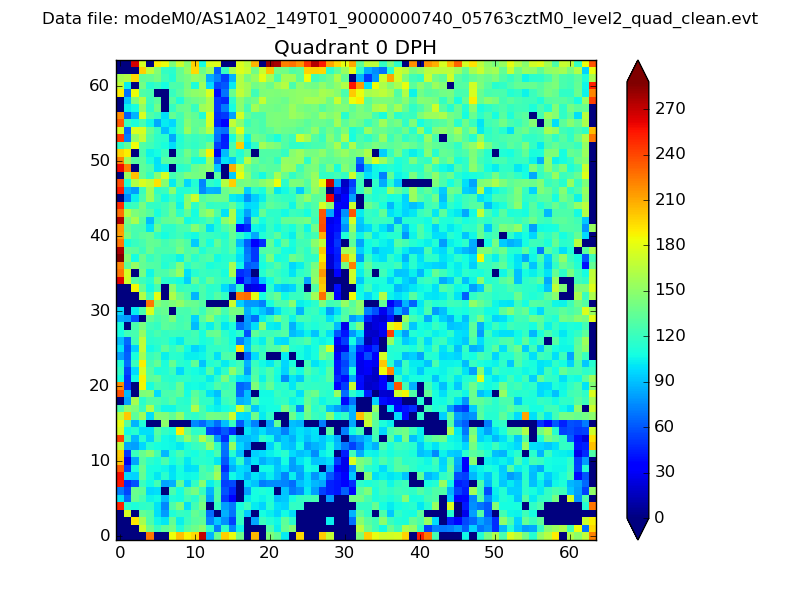 |
 |
Quadrant B |
|---|---|---|---|
| Quadrant D |  |
 |
Quadrant C |
| Plot type | Count rate plots | Images |
|---|---|---|
| Comparison with Poisson distribution Blue bars denote a histogram of data divided into 1 sec bins. Red curve is a Poisson curve with rate = median count rate of data. |
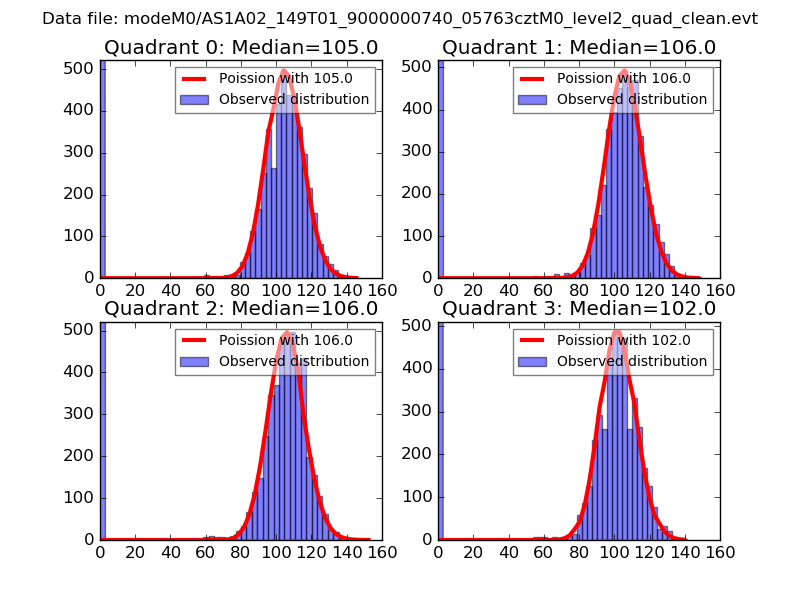 |
 |
| Quadrant-wise count rates Data is divided into 100 sec bins |
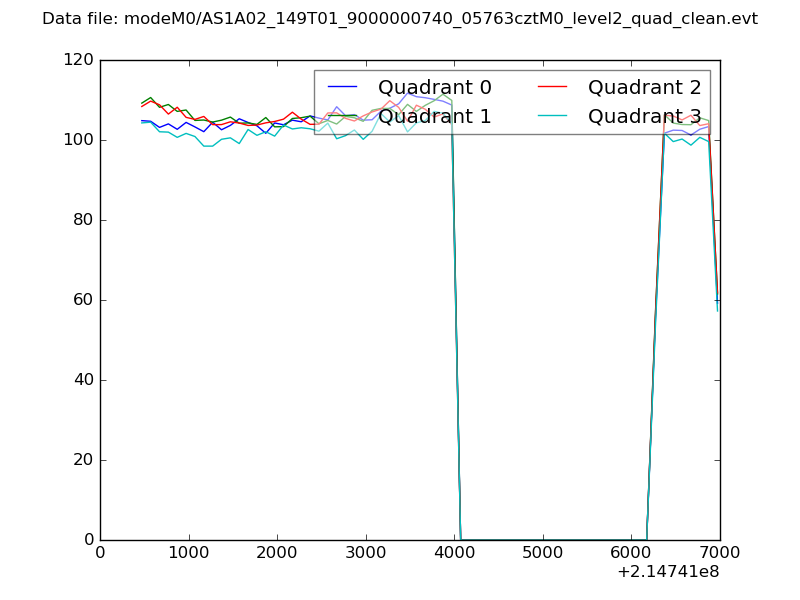 |
|
| Module-wise count rates for Quadrant A Data is divided into 100 sec bins |
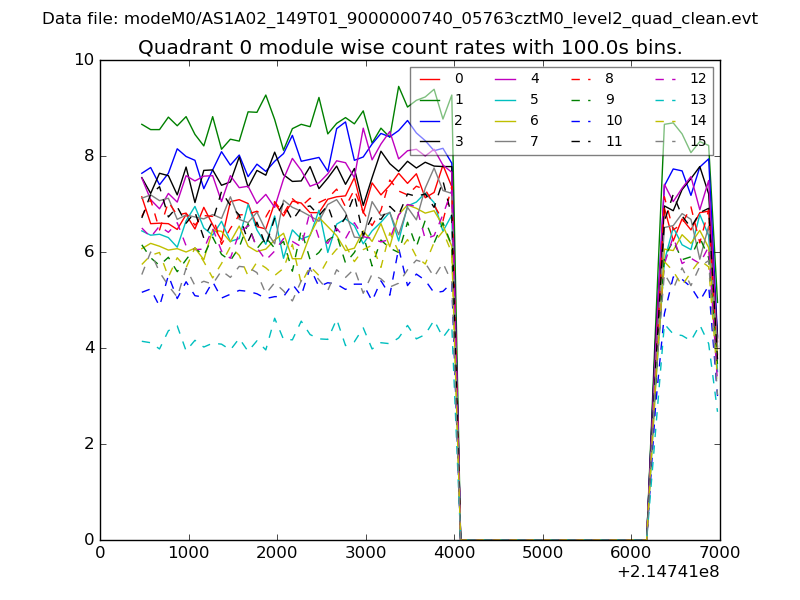 |
 |
| Module-wise count rates for Quadrant B Data is divided into 100 sec bins |
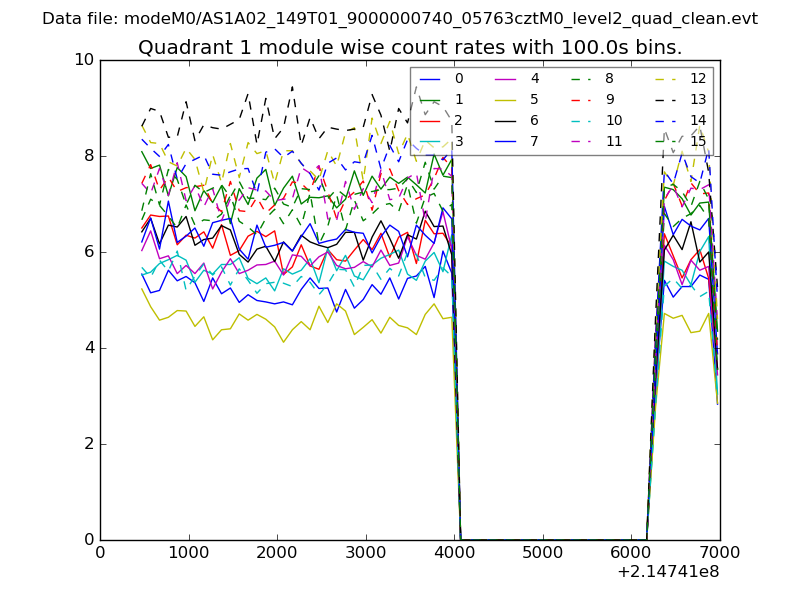 |
 |
| Module-wise count rates for Quadrant C Data is divided into 100 sec bins |
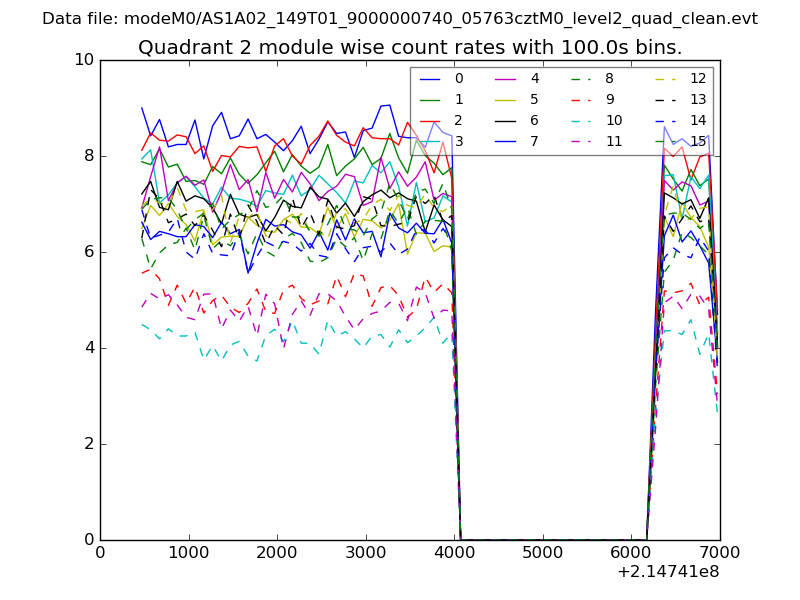 |
 |
| Module-wise count rates for Quadrant D Data is divided into 100 sec bins |
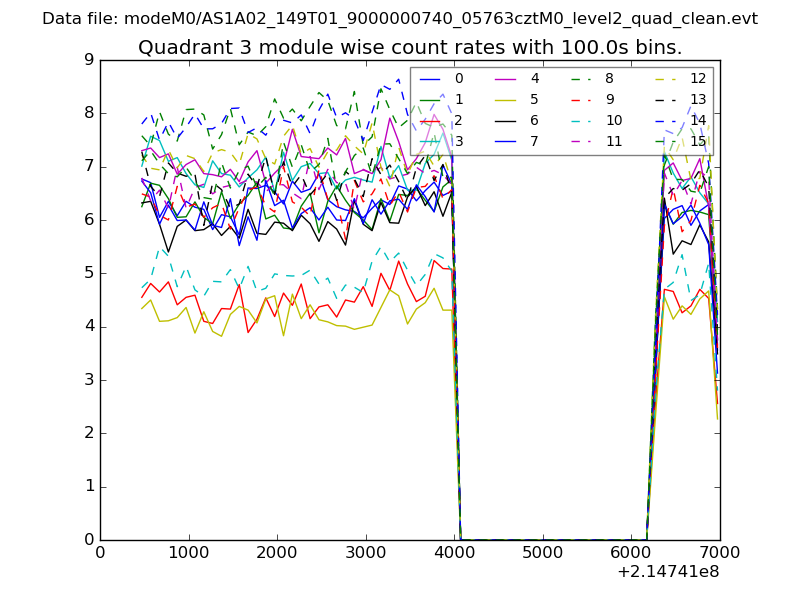 |
 |
| Parameter | Plot |
|---|---|
| CZT HV Monitor | 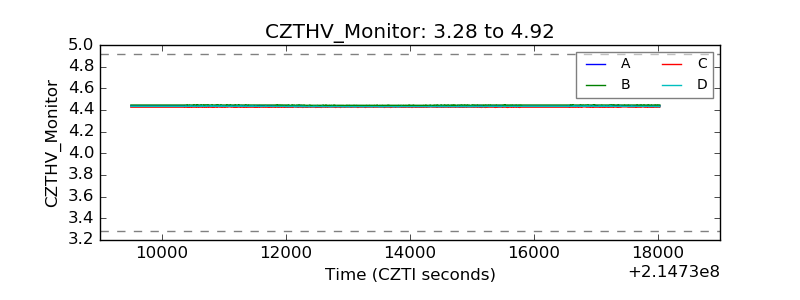 |
| D_VDD | 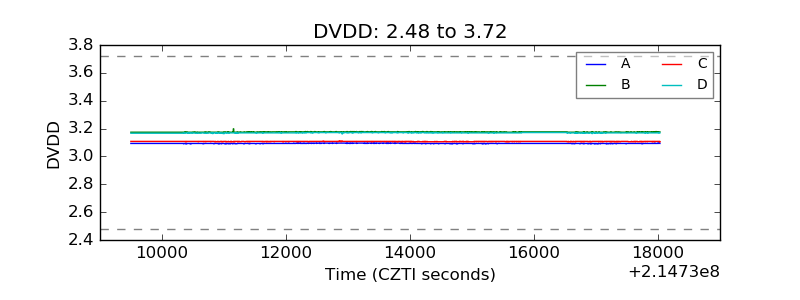 |
| Temperature 1 | 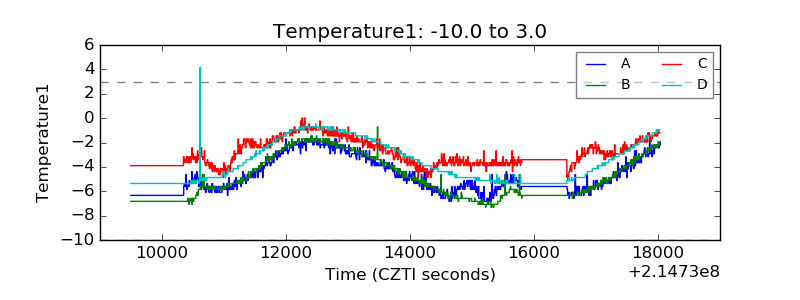 |
| Veto HV Monitor | 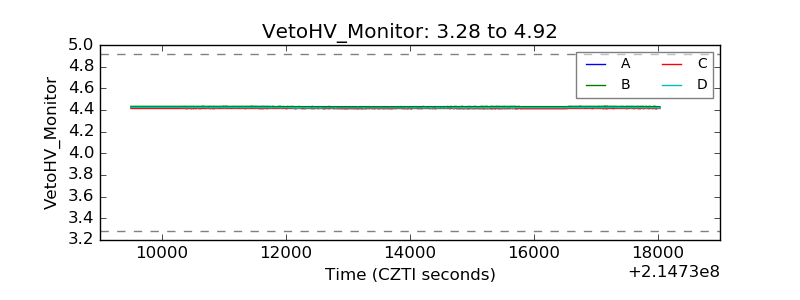 |
| Veto LLD | 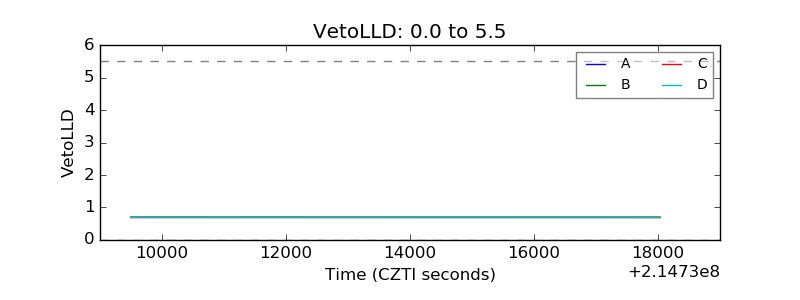 |
| Alpha Counter | 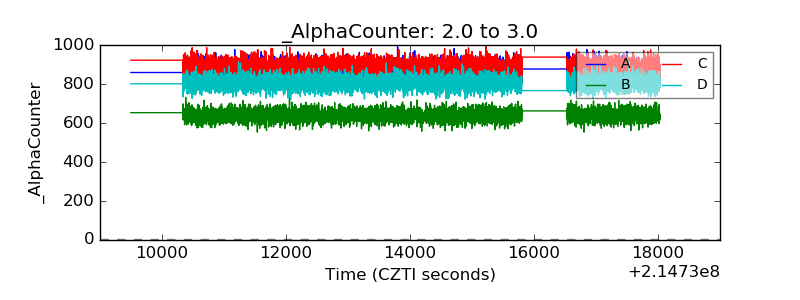 |
| _CPM_Rate | 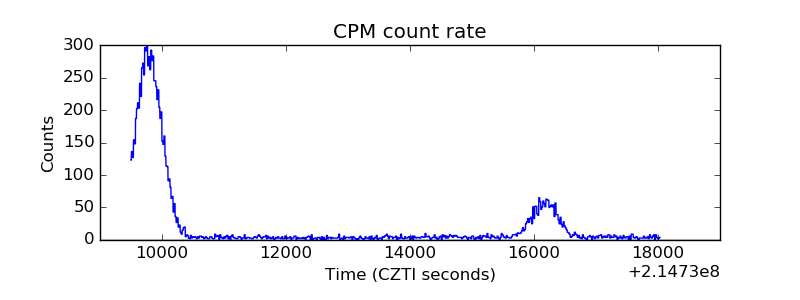 |
| CZT Counter |  |
| +2.5 Volts monitor |  |
| +5 Volts monitor |  |
| _ROLL_ROT | 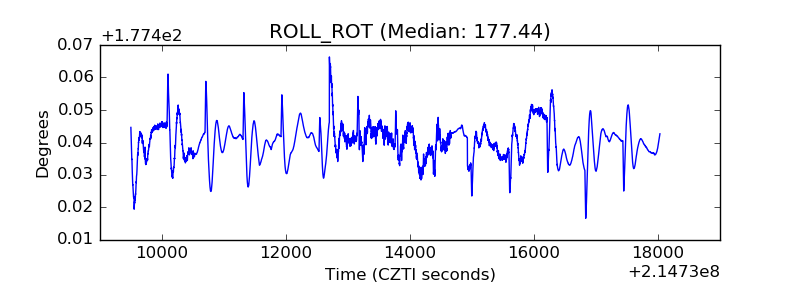 |
| _Roll_DEC | 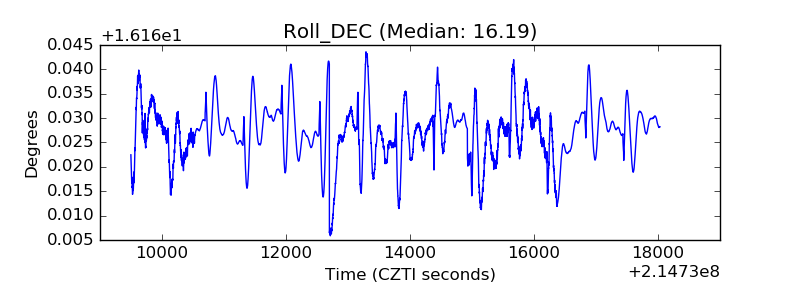 |
| _Roll_RA | 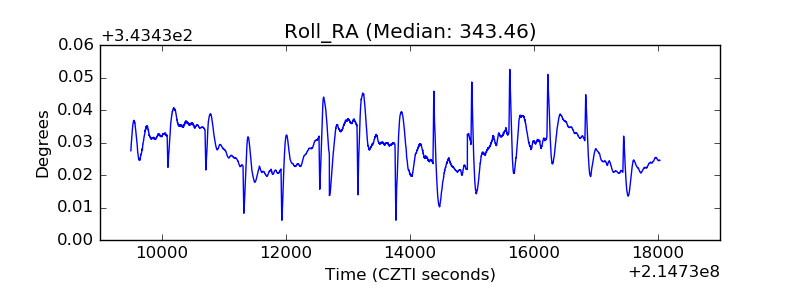 |
| Veto Counter | 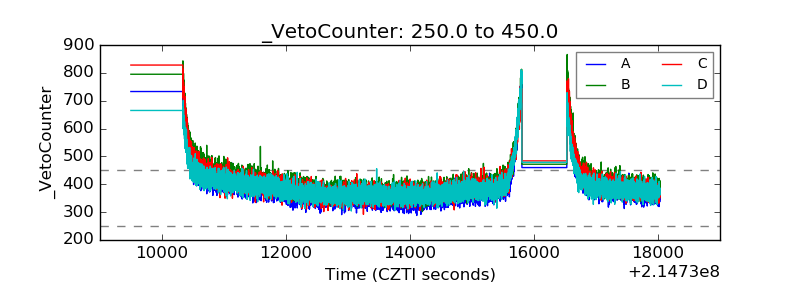 |