| Param | Original file | Final file |
|---|---|---|
| Filename | modeM0/AS1A02_149T01_9000000740_05764cztM0_level2.evt | modeM0/AS1A02_149T01_9000000740_05764cztM0_level2_quad_clean.evt |
| Size (bytes) | 96,451,200 | 22,472,640 |
| Size | 92.0 MB | 21.4 MB |
| Events in quadrant A | 678,039 | 143,235 |
| Events in quadrant B | 703,073 | 144,503 |
| Events in quadrant C | 649,991 | 145,367 |
| Events in quadrant D | 785,127 | 136,094 |
| Mode SS | |||
|---|---|---|---|
| Quadrant | BADHDUFLAG | Total packets | Discarded packets |
| A | 0 | 30 | 0 |
| B | 0 | 30 | 4 |
| C | 0 | 30 | 2 |
| D | 0 | 30 | 0 |
| Mode M0 | |||
|---|---|---|---|
| Quadrant | BADHDUFLAG | Total packets | Discarded packets |
| A | 0 | 3133 | 113 |
| B | 0 | 3181 | 149 |
| C | 0 | 3127 | 131 |
| D | 0 | 3569 | 163 |
| Quadrant | Total seconds | Saturated seconds | Saturation percentage |
|---|---|---|---|
| A | 1507 | 3 | 0.199071% |
| B | 1493 | 3 | 0.200938% |
| C | 1498 | 1 | 0.066756% |
| D | 1498 | 55 | 3.671562% |
Noise dominated data is calculated using 1-second bins in cleaned event files. If a bin has >2000 counts, and if more than 50% of those come from <1% of pixels, then it is considered to be noise-dominated and hence unusable.
| Quadrant | # 1 sec bins | Bins with >0 counts | Bins with >2000 counts | High rate bins dominated by noise | Noise dominated (total time) | Noise dominated (detector-on time) | Marked lightcurve |
|---|---|---|---|---|---|---|---|
| A | 1564 | 1557 | 0 | 0 | 0.00% | 0.00% | 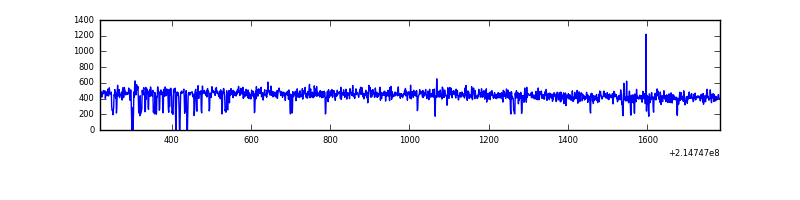 |
| B | 1564 | 1557 | 1 | 1 | 0.06% | 0.06% | 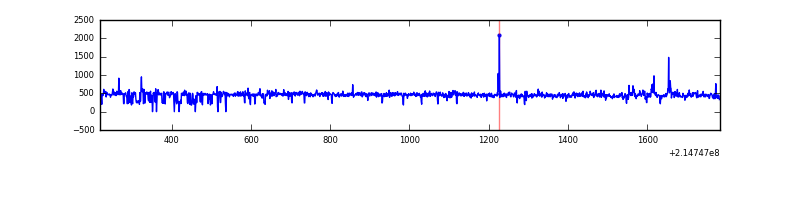 |
| C | 1564 | 1560 | 0 | 0 | 0.00% | 0.00% | 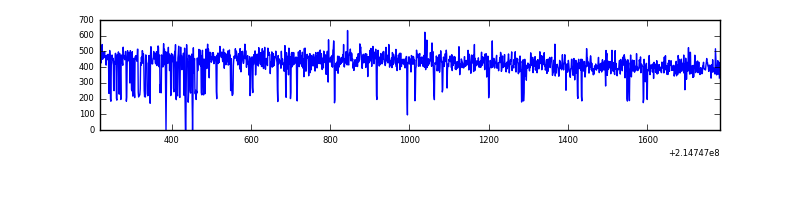 |
| D | 1564 | 1550 | 44 | 44 | 2.81% | 2.84% | 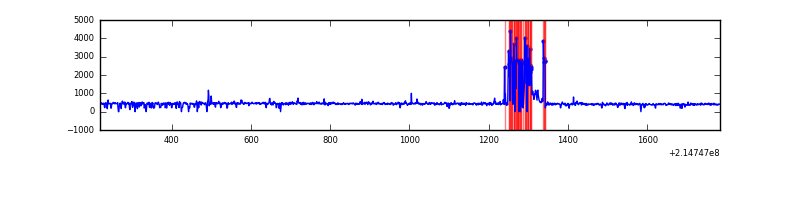 |
Top three noisy pixels from each quadrant. If the there are fewer than three noisy pixels in the level2.evt file, extra rows are filled as -1
| Pixel properties | Quadrant properties | ||||||
|---|---|---|---|---|---|---|---|
| Quadrant | DetID | PixID | Counts | Sigma | Mean | Median | Sigma |
| A | 0 | 226 | 1641 | 38.47 | 176 | 171 | 38.2 |
| A | 12 | 194 | 1640 | 38.45 | 176 | 171 | 38.2 |
| A | 4 | 2 | 795 | 16.33 | 176 | 171 | 38.2 |
| B | 15 | 204 | 10490 | 287.4 | 173 | 169 | 35.9 |
| B | 0 | 214 | 9046 | 247.19 | 173 | 169 | 35.9 |
| B | 4 | 200 | 3957 | 105.48 | 173 | 169 | 35.9 |
| C | 13 | 61 | 1318 | 28.34 | 166 | 166 | 40.7 |
| C | 3 | 202 | 463 | 7.31 | 166 | 166 | 40.7 |
| C | 14 | 67 | 380 | 5.26 | 166 | 166 | 40.7 |
| D | 10 | 15 | 148027 | 3497.97 | 166 | 161 | 42.3 |
| D | 2 | 14 | 4998 | 114.43 | 166 | 161 | 42.3 |
| D | 2 | 206 | 4005 | 90.94 | 166 | 161 | 42.3 |
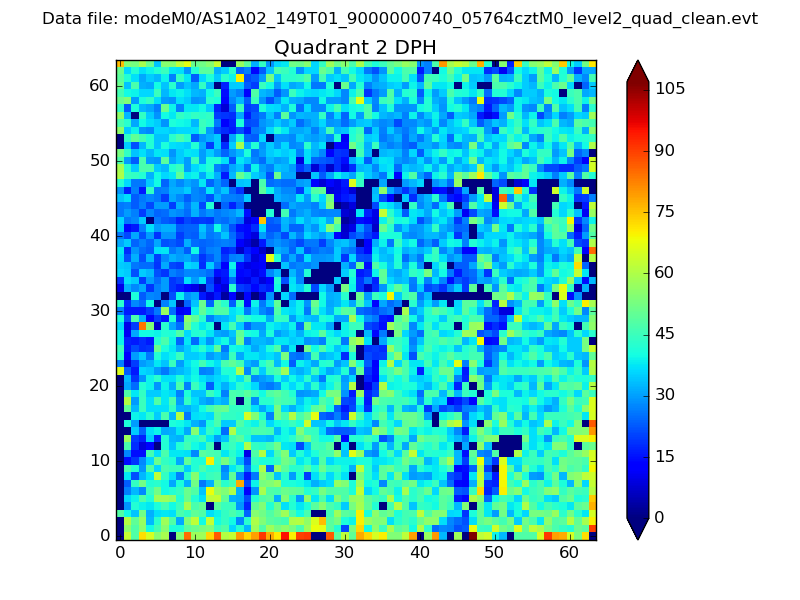
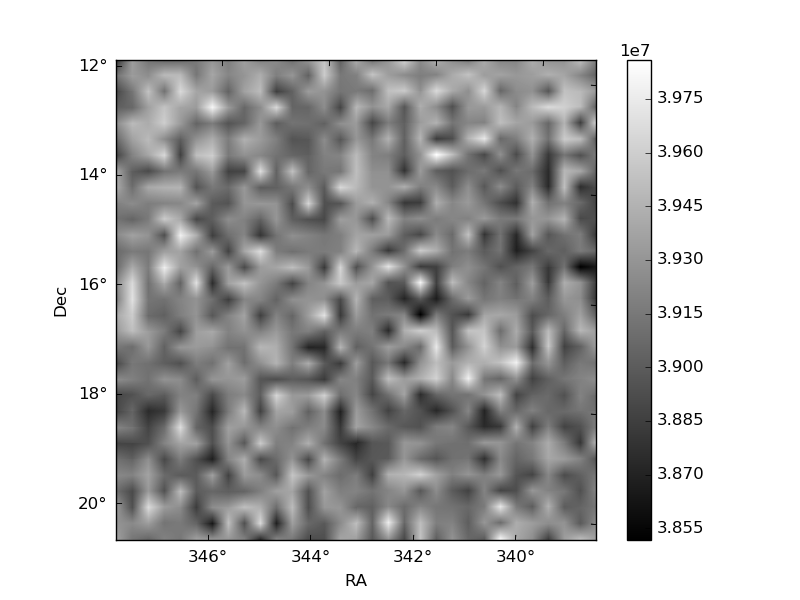
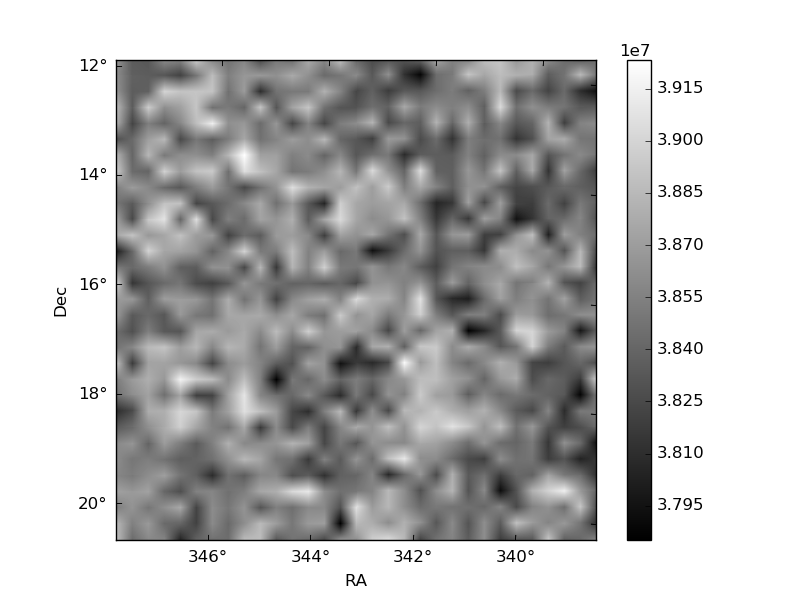
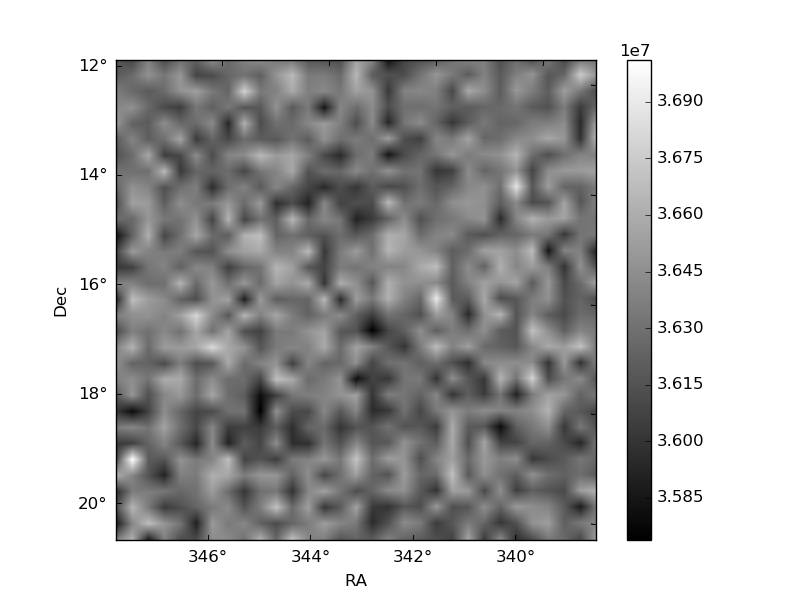
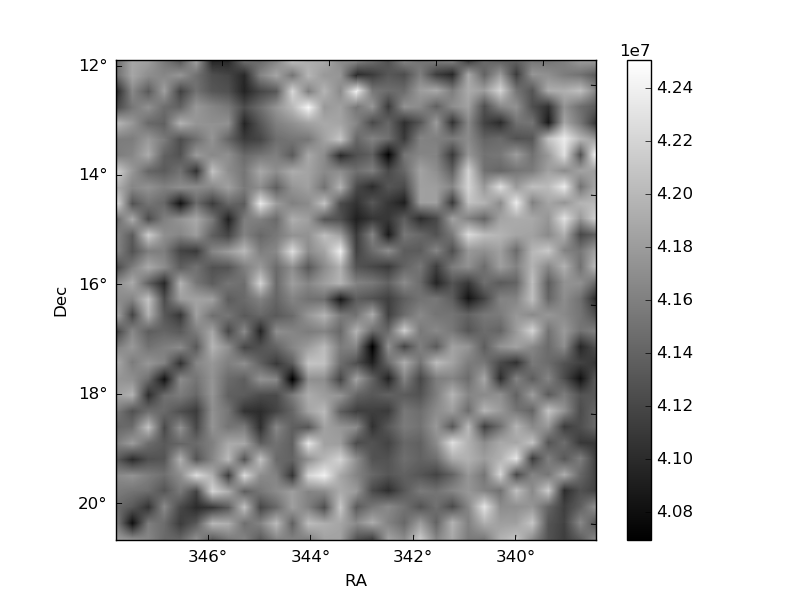
Histogram calculated using DETX and DETY for each event in the final _common_clean file
| Quadrant A | 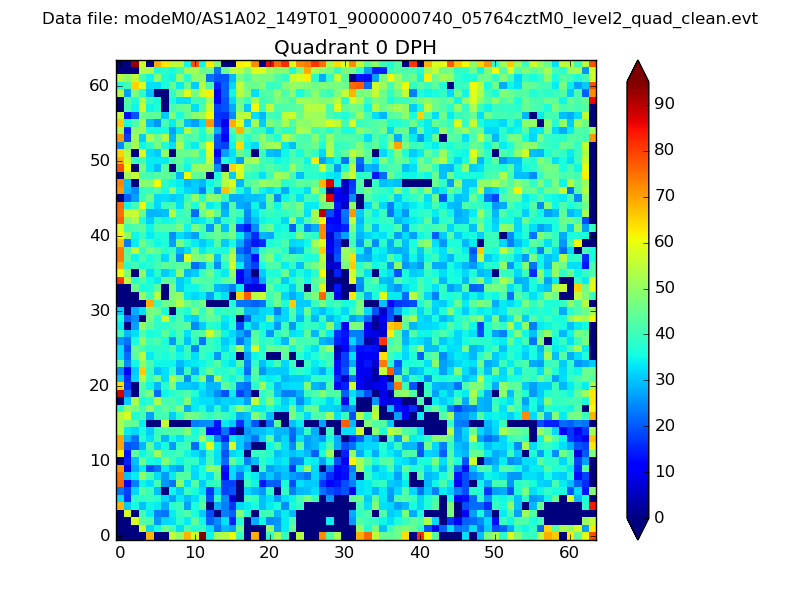 |
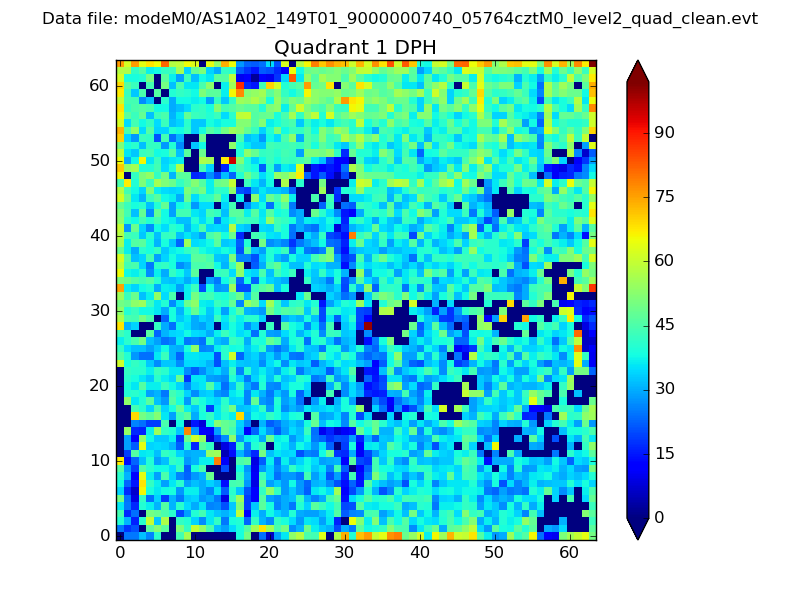 |
Quadrant B |
|---|---|---|---|
| Quadrant D | 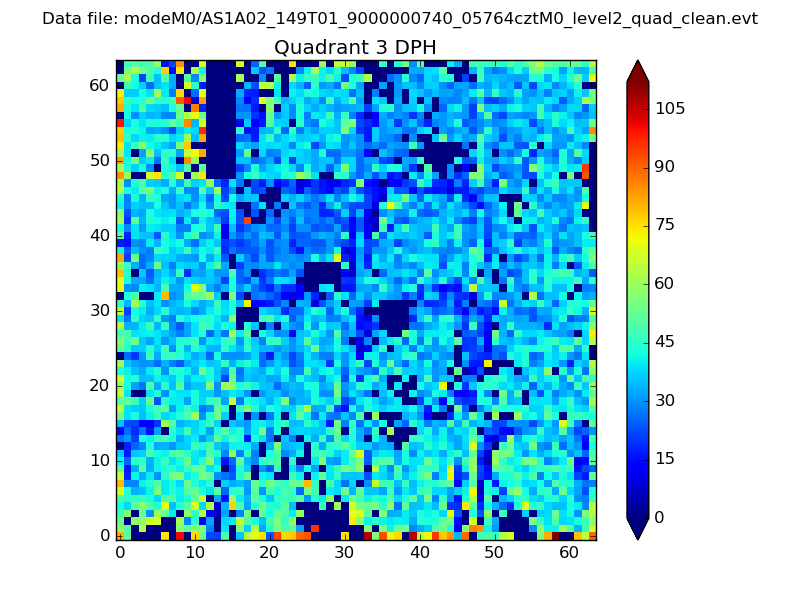 |
 |
Quadrant C |
| Plot type | Count rate plots | Images |
|---|---|---|
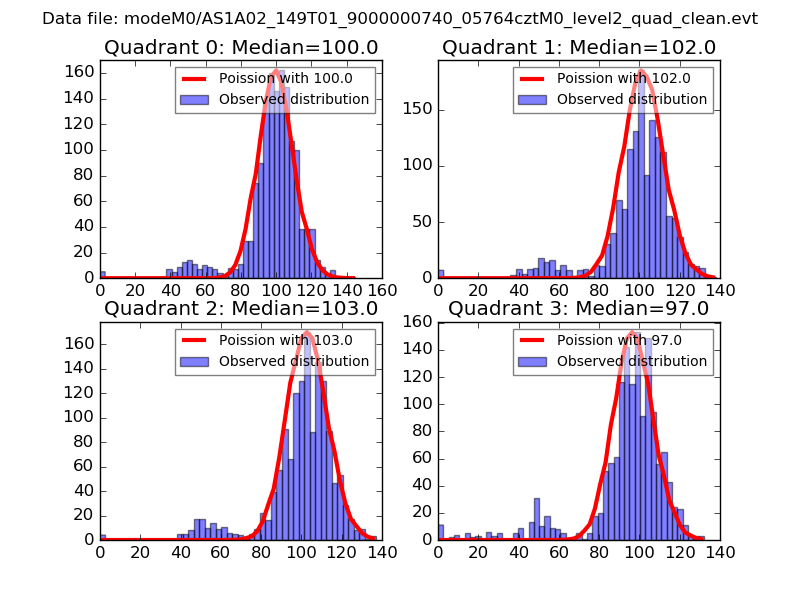
| Comparison with Poisson distribution Blue bars denote a histogram of data divided into 1 sec bins. Red curve is a Poisson curve with rate = median count rate of data. |
 |
 |
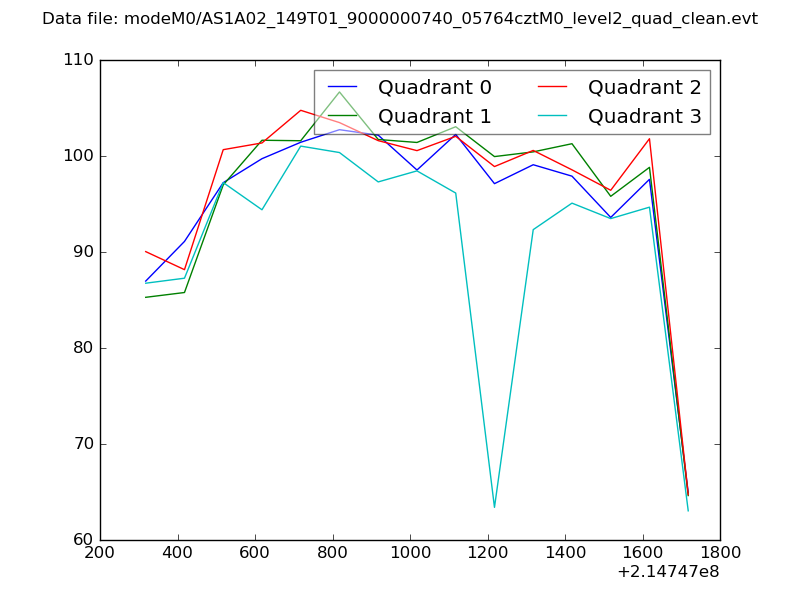
| Quadrant-wise count rates Data is divided into 100 sec bins |
 |
|
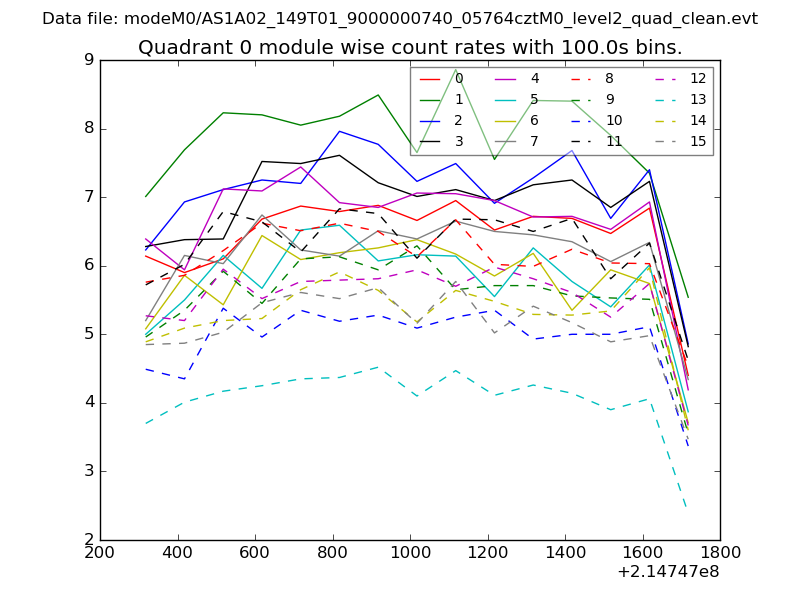
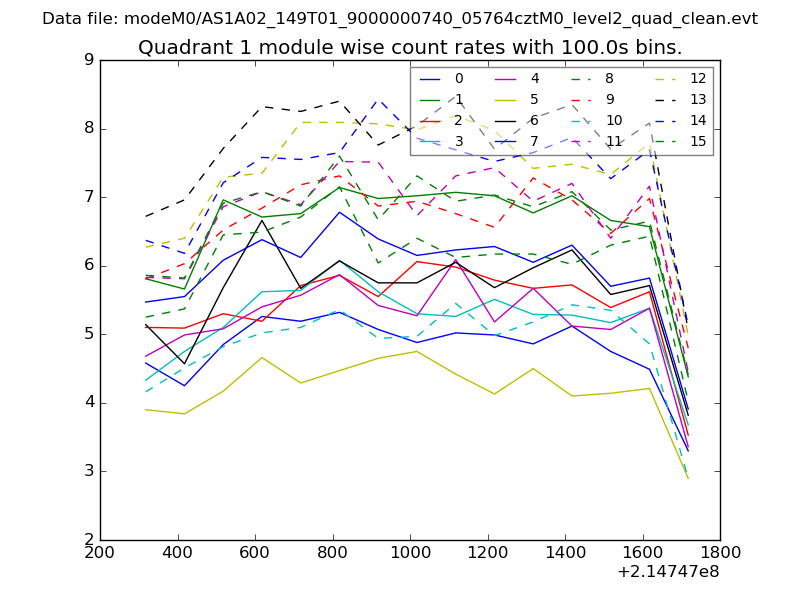
| Module-wise count rates for Quadrant A Data is divided into 100 sec bins |
 |
 |
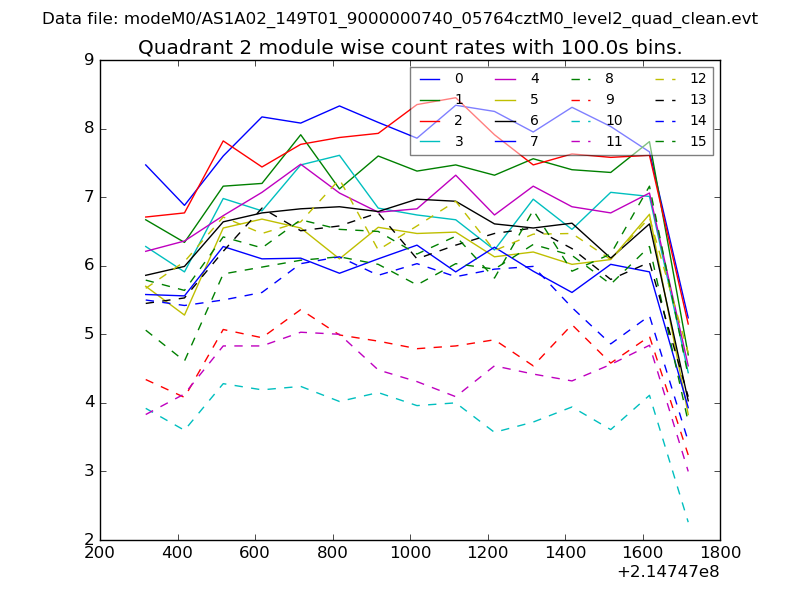
| Module-wise count rates for Quadrant B Data is divided into 100 sec bins |
 |
 |
| Module-wise count rates for Quadrant C Data is divided into 100 sec bins |
 |
 |
| Module-wise count rates for Quadrant D Data is divided into 100 sec bins |
 |
 |
| Parameter | Plot |
|---|---|
| CZT HV Monitor | 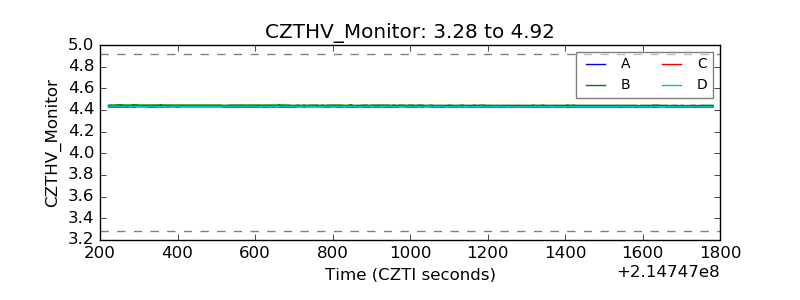 |
| D_VDD | 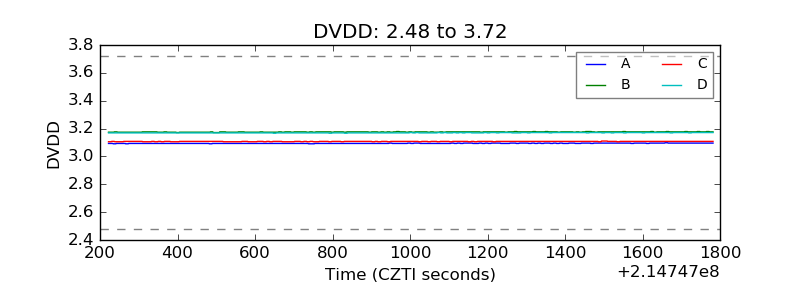 |
| Temperature 1 | 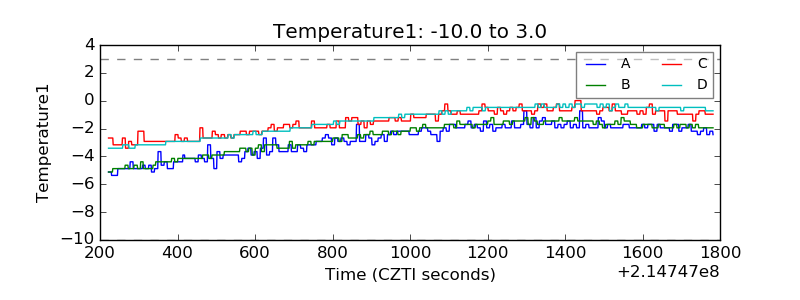 |
| Veto HV Monitor | 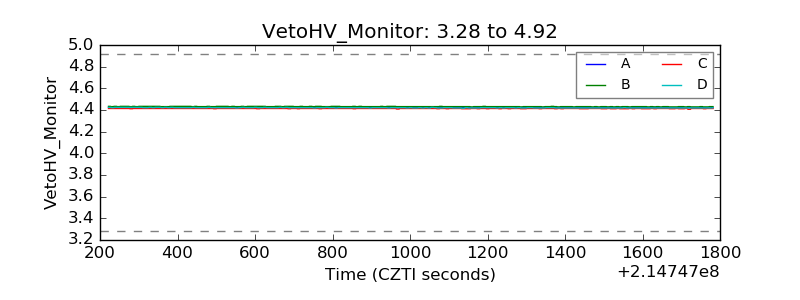 |
| Veto LLD | 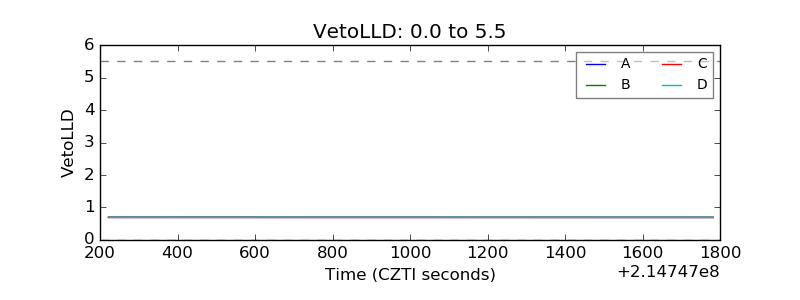 |
| Alpha Counter | 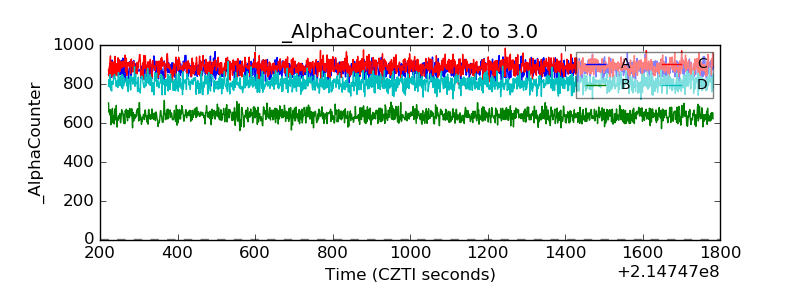 |
| _CPM_Rate | 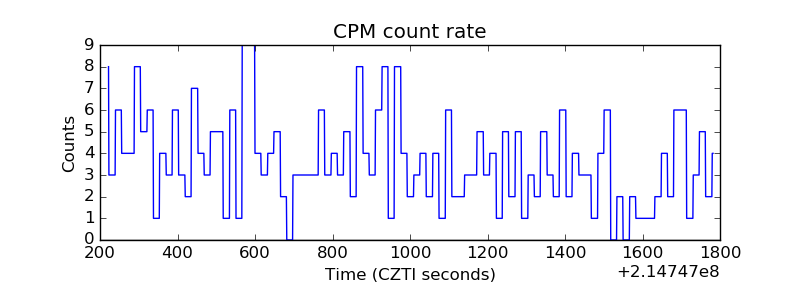 |
| CZT Counter | 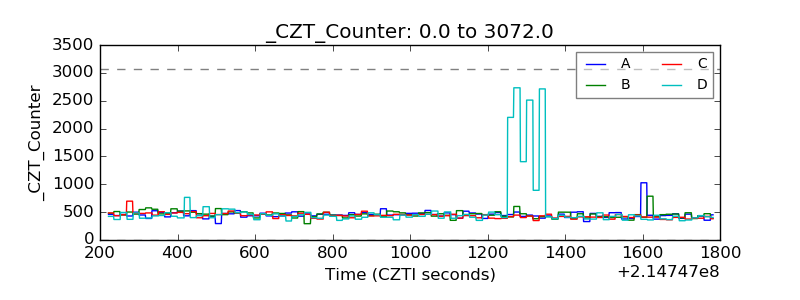 |
| +2.5 Volts monitor |  |
| +5 Volts monitor |  |
| _ROLL_ROT | 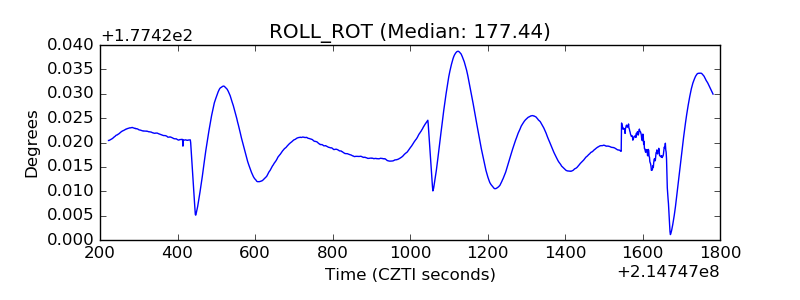 |
| _Roll_DEC | 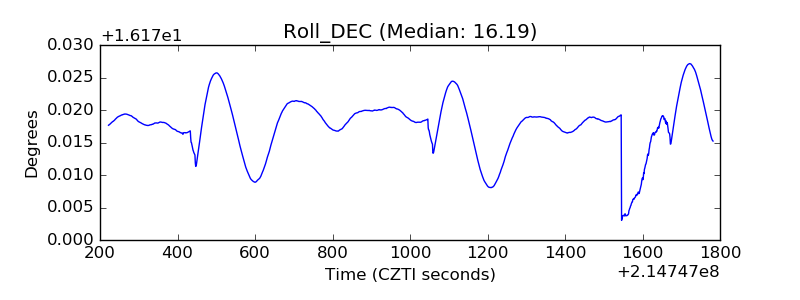 |
| _Roll_RA | 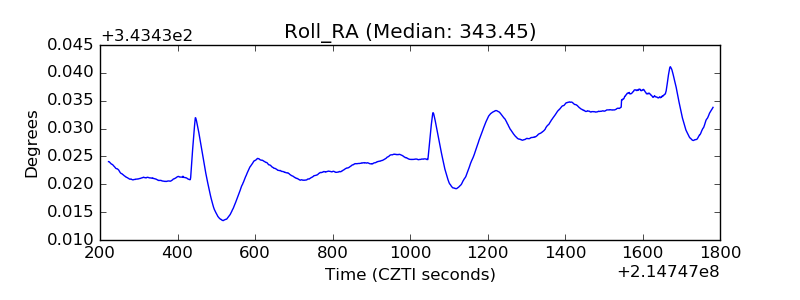 |
| Veto Counter | 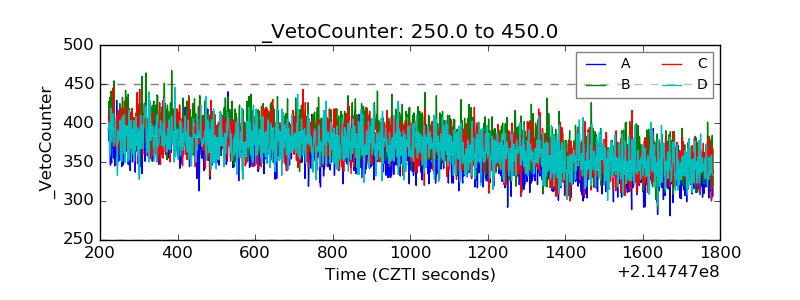 |