| Param | Original file | Final file |
|---|---|---|
| Filename | modeM0/AS1G06_002T01_9000000742cztM0_level2.fits | modeM0/AS1G06_002T01_9000000742cztM0_level2_quad_clean.evt |
| Size (bytes) | 740,897,280 | 697,809,600 |
| Size | 706.6 MB | 665.5 MB |
| Events in quadrant A | 4,440,550 | 4,060,137 |
| Events in quadrant B | 4,336,744 | 4,080,341 |
| Events in quadrant C | 4,413,002 | 3,929,852 |
| Events in quadrant D | 3,808,258 | 3,625,807 |
| Mode M0 | |||
|---|---|---|---|
| Quadrant | BADHDUFLAG | Total packets | Discarded packets |
| A | 0 | 163396 | 0 |
| B | 0 | 166836 | 0 |
| C | 0 | 162688 | 0 |
| D | 0 | 166123 | 0 |
| Mode M9 | |||
|---|---|---|---|
| Quadrant | BADHDUFLAG | Total packets | Discarded packets |
| A | 0 | 117 | 0 |
| B | 0 | 116 | 0 |
| C | 0 | 117 | 0 |
| D | 0 | 117 | 0 |
| Mode SS | |||
|---|---|---|---|
| Quadrant | BADHDUFLAG | Total packets | Discarded packets |
| A | 0 | 1608 | 0 |
| B | 0 | 1620 | 0 |
| C | 0 | 1624 | 0 |
| D | 0 | 1618 | 0 |
| Quadrant | Total seconds | Saturated seconds | Saturation percentage |
|---|---|---|---|
| A | 79287 | 947 | 1.194395% |
| B | 79249 | 1087 | 1.371626% |
| C | 79326 | 674 | 0.849658% |
| D | 79248 | 809 | 1.020846% |
Noise dominated data is calculated using 1-second bins in cleaned event files. If a bin has >2000 counts, and if more than 50% of those come from <1% of pixels, then it is considered to be noise-dominated and hence unusable.
| Quadrant | # 1 sec bins | Bins with >0 counts | Bins with >2000 counts | High rate bins dominated by noise | Noise dominated (total time) | Noise dominated (detector-on time) | Marked lightcurve |
|---|---|---|---|---|---|---|---|
| A | 93919 | 81201 | 0 | 0 | 0.00% | 0.00% |  |
| B | 93919 | 81203 | 0 | 0 | 0.00% | 0.00% | 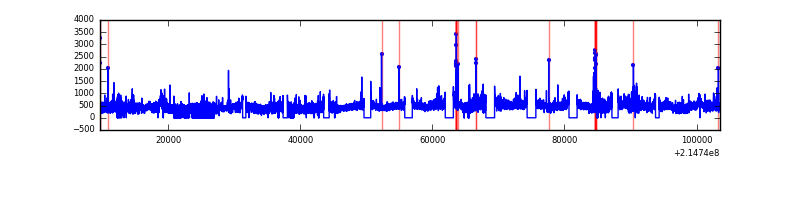 |
| C | 93919 | 81258 | 0 | 0 | 0.00% | 0.00% |  |
| D | 93919 | 81242 | 0 | 0 | 0.00% | 0.00% |  |
Top three noisy pixels from each quadrant. If the there are fewer than three noisy pixels in the level2.evt file, extra rows are filled as -1
| Pixel properties | Quadrant properties | ||||||
|---|---|---|---|---|---|---|---|
| Quadrant | DetID | PixID | Counts | Sigma | Mean | Median | Sigma |
| A | 0 | 29 | 4188 | 10.54 | 1155 | 1075 | 295.4 |
| A | 7 | 110 | 3815 | 9.28 | 1155 | 1075 | 295.4 |
| A | 0 | 30 | 3343 | 7.68 | 1155 | 1075 | 295.4 |
| B | 2 | 9 | 3745 | 11.76 | 1141 | 1084 | 226.3 |
| B | 12 | 226 | 3042 | 8.65 | 1141 | 1084 | 226.3 |
| B | 3 | 17 | 2902 | 8.03 | 1141 | 1084 | 226.3 |
| C | 1 | 80 | 3207 | 6.87 | 1166 | 1079 | 309.6 |
| C | 1 | 81 | 3060 | 6.4 | 1166 | 1079 | 309.6 |
| C | 9 | 188 | 3043 | 6.34 | 1166 | 1079 | 309.6 |
| D | 3 | 14 | 2926 | 6.77 | 1085 | 986 | 286.7 |
| D | 11 | 82 | 2871 | 6.57 | 1085 | 986 | 286.7 |
| D | 6 | 231 | 2829 | 6.43 | 1085 | 986 | 286.7 |
Histogram calculated using DETX and DETY for each event in the final _common_clean file
| Quadrant A | 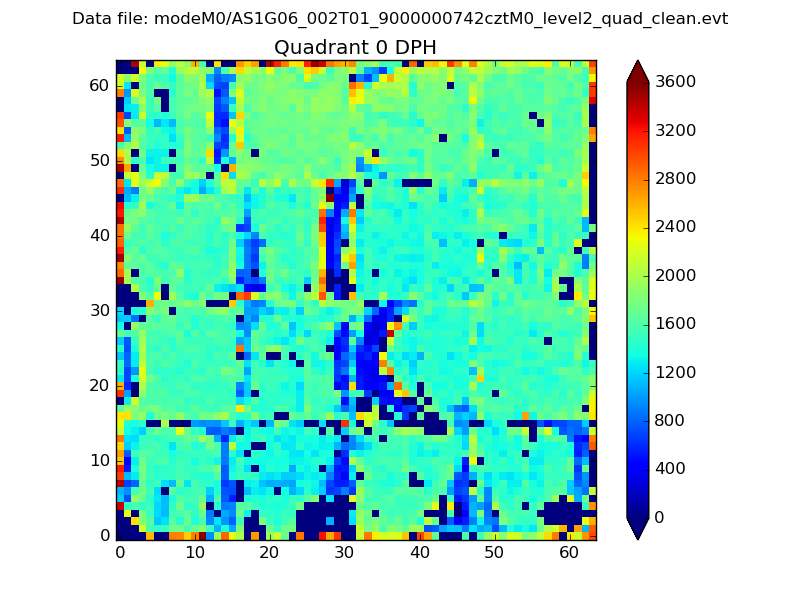 |
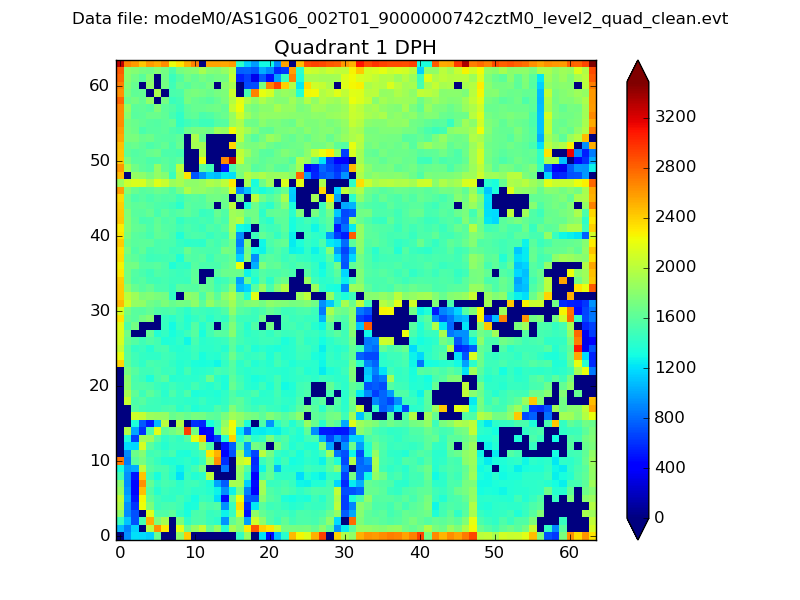 |
Quadrant B |
|---|---|---|---|
| Quadrant D | 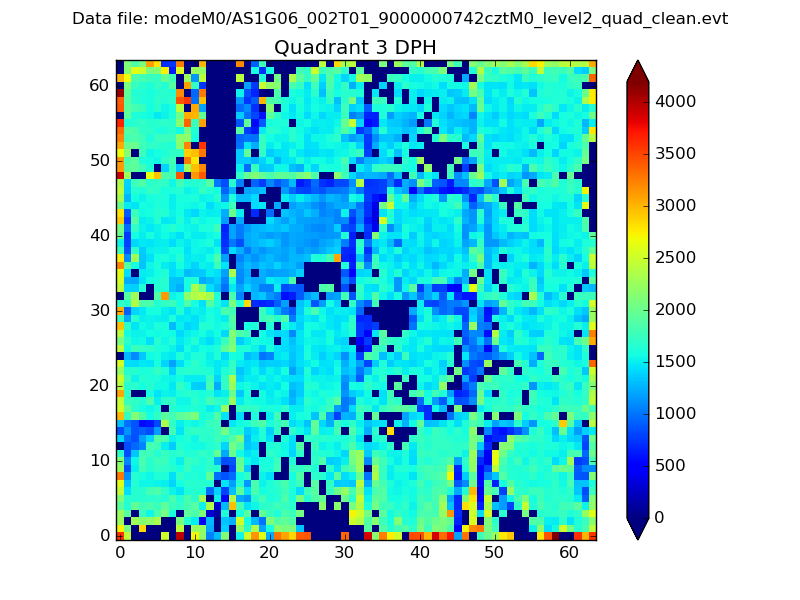 |
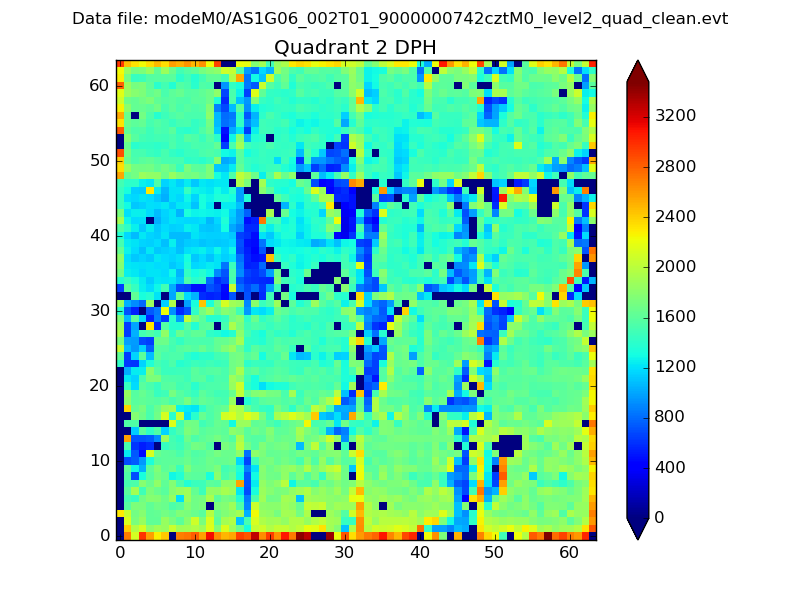 |
Quadrant C |
| Plot type | Count rate plots | Images |
|---|---|---|
| Comparison with Poisson distribution Blue bars denote a histogram of data divided into 1 sec bins. Red curve is a Poisson curve with rate = median count rate of data. |
 |
 |
| Quadrant-wise count rates Data is divided into 100 sec bins |
 |
|
| Module-wise count rates for Quadrant A Data is divided into 100 sec bins |
 |
 |
| Module-wise count rates for Quadrant B Data is divided into 100 sec bins |
 |
 |
| Module-wise count rates for Quadrant C Data is divided into 100 sec bins |
 |
 |
| Module-wise count rates for Quadrant D Data is divided into 100 sec bins |
 |
 |
| Parameter | Plot |
|---|---|
| CZT HV Monitor |  |
| D_VDD | 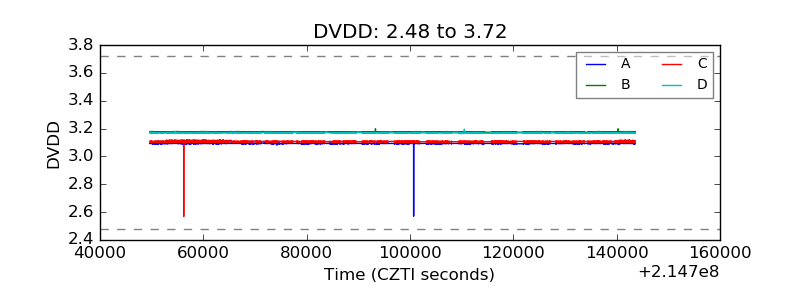 |
| Temperature 1 |  |
| Veto HV Monitor |  |
| Veto LLD |  |
| Alpha Counter |  |
| _CPM_Rate |  |
| CZT Counter |  |
| +2.5 Volts monitor | 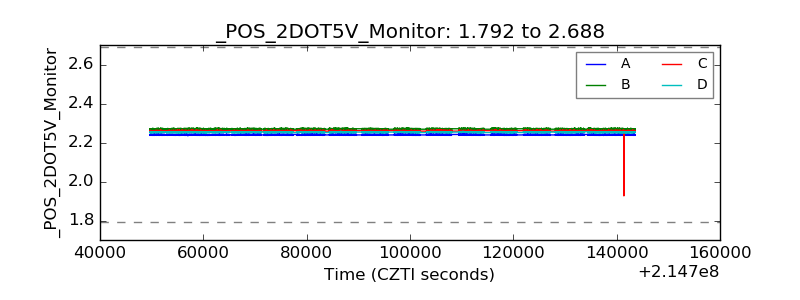 |
| +5 Volts monitor |  |
| _ROLL_ROT | 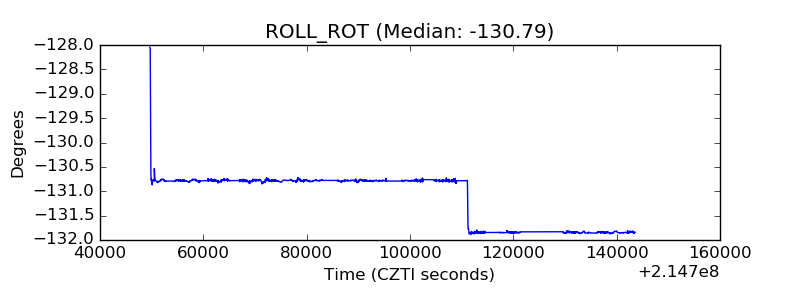 |
| _Roll_DEC | 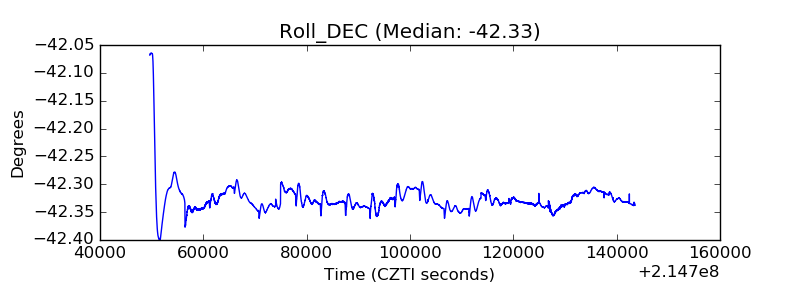 |
| _Roll_RA | 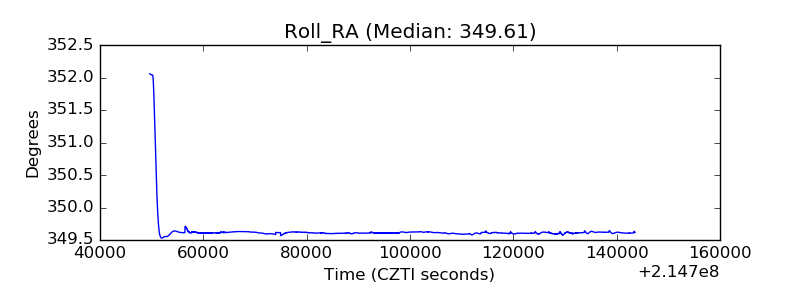 |
| Veto Counter | 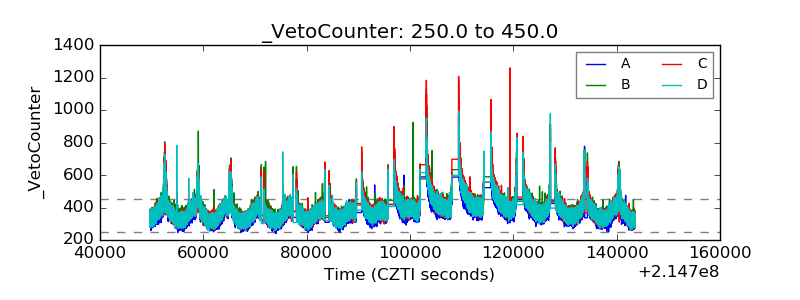 |