| Param | Original file | Final file |
|---|---|---|
| Filename | modeM0/AS1G06_002T01_9000000742_05764cztM0_level2.evt | modeM0/AS1G06_002T01_9000000742_05764cztM0_level2_quad_clean.evt |
| Size (bytes) | 283,020,480 | 40,855,680 |
| Size | 269.9 MB | 39.0 MB |
| Events in quadrant A | 2,104,036 | 237,477 |
| Events in quadrant B | 2,144,398 | 240,004 |
| Events in quadrant C | 1,969,576 | 234,266 |
| Events in quadrant D | 2,063,956 | 227,157 |
| Mode M0 | |||
|---|---|---|---|
| Quadrant | BADHDUFLAG | Total packets | Discarded packets |
| A | 0 | 9598 | 426 |
| B | 0 | 9341 | 397 |
| C | 0 | 9184 | 382 |
| D | 0 | 9491 | 360 |
| Mode M9 | |||
|---|---|---|---|
| Quadrant | BADHDUFLAG | Total packets | Discarded packets |
| A | 0 | 3 | 0 |
| B | 0 | 3 | 0 |
| C | 0 | 3 | 0 |
| D | 0 | 3 | 0 |
| Mode SS | |||
|---|---|---|---|
| Quadrant | BADHDUFLAG | Total packets | Discarded packets |
| A | 0 | 90 | 4 |
| B | 0 | 90 | 2 |
| C | 0 | 90 | 0 |
| D | 0 | 90 | 6 |
| Quadrant | Total seconds | Saturated seconds | Saturation percentage |
|---|---|---|---|
| A | 4216 | 176 | 4.174573% |
| B | 4232 | 155 | 3.662571% |
| C | 4232 | 108 | 2.551985% |
| D | 4243 | 127 | 2.993165% |
Noise dominated data is calculated using 1-second bins in cleaned event files. If a bin has >2000 counts, and if more than 50% of those come from <1% of pixels, then it is considered to be noise-dominated and hence unusable.
| Quadrant | # 1 sec bins | Bins with >0 counts | Bins with >2000 counts | High rate bins dominated by noise | Noise dominated (total time) | Noise dominated (detector-on time) | Marked lightcurve |
|---|---|---|---|---|---|---|---|
| A | 4653 | 4380 | 19 | 19 | 0.41% | 0.43% | 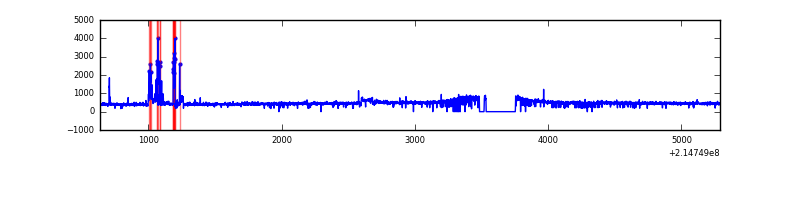 |
| B | 4653 | 4383 | 3 | 3 | 0.06% | 0.07% | 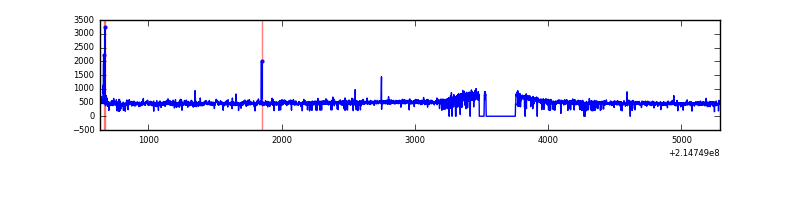 |
| C | 4653 | 4386 | 0 | 0 | 0.00% | 0.00% | 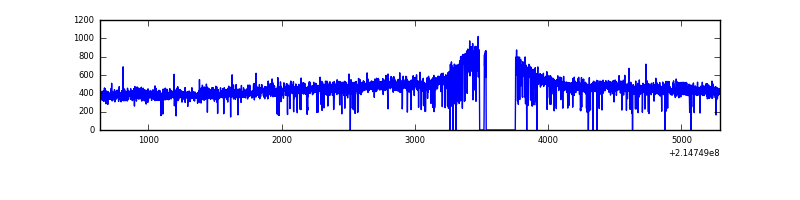 |
| D | 4653 | 4383 | 17 | 17 | 0.37% | 0.39% | 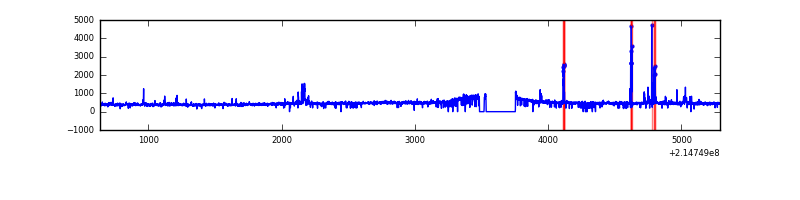 |
Top three noisy pixels from each quadrant. If the there are fewer than three noisy pixels in the level2.evt file, extra rows are filled as -1
| Pixel properties | Quadrant properties | ||||||
|---|---|---|---|---|---|---|---|
| Quadrant | DetID | PixID | Counts | Sigma | Mean | Median | Sigma |
| A | 15 | 236 | 143866 | 1346.58 | 509 | 497 | 106.5 |
| A | 0 | 226 | 4873 | 41.1 | 509 | 497 | 106.5 |
| A | 12 | 194 | 4769 | 40.12 | 509 | 497 | 106.5 |
| B | 15 | 204 | 58090 | 572.38 | 518 | 504 | 100.6 |
| B | 0 | 219 | 44487 | 437.17 | 518 | 504 | 100.6 |
| B | 15 | 54 | 15185 | 145.92 | 518 | 504 | 100.6 |
| C | 8 | 128 | 5007 | 38.12 | 502 | 503 | 118.2 |
| C | 13 | 61 | 4012 | 29.7 | 502 | 503 | 118.2 |
| C | 8 | 112 | 2444 | 16.43 | 502 | 503 | 118.2 |
| D | 2 | 14 | 50983 | 406.17 | 503 | 486 | 124.3 |
| D | 12 | 110 | 40297 | 320.22 | 503 | 486 | 124.3 |
| D | 12 | 233 | 21643 | 170.17 | 503 | 486 | 124.3 |
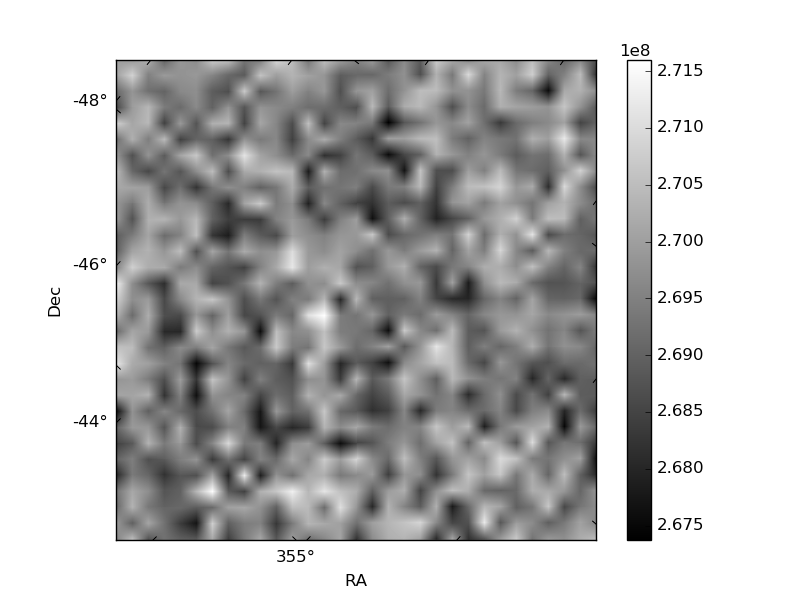
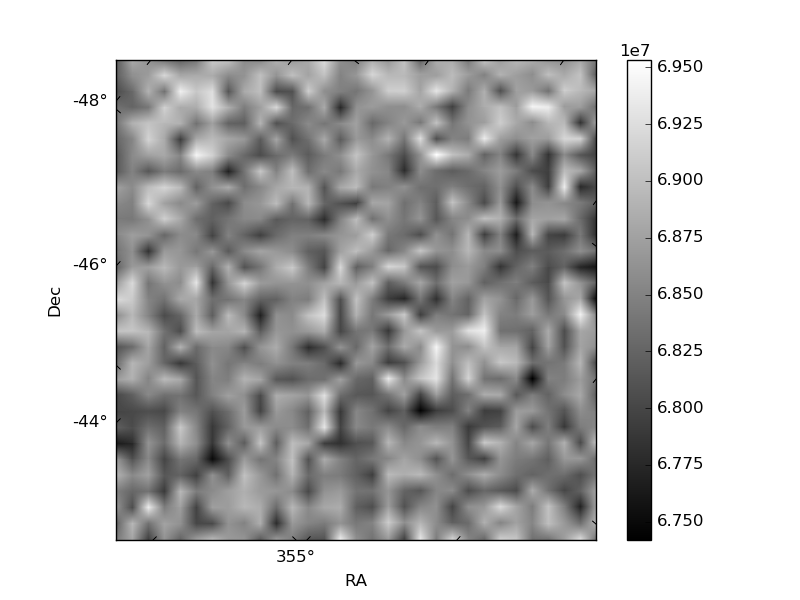
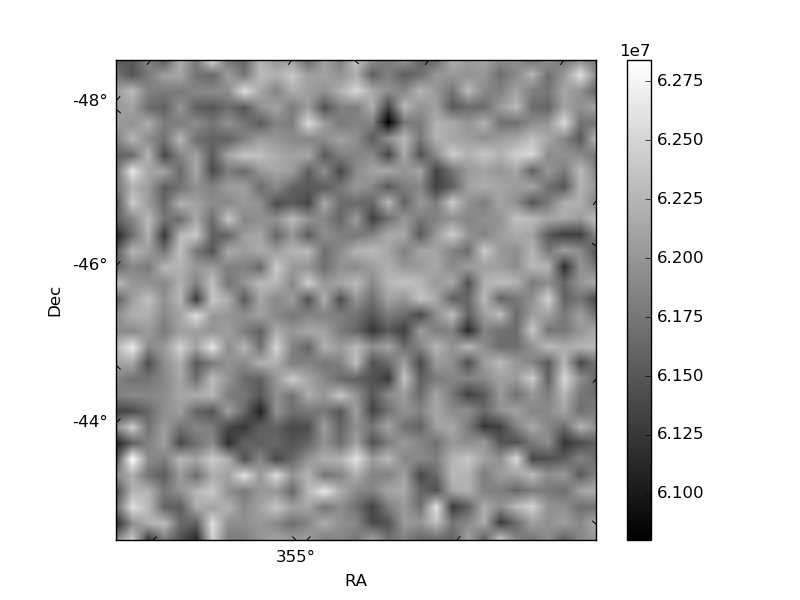
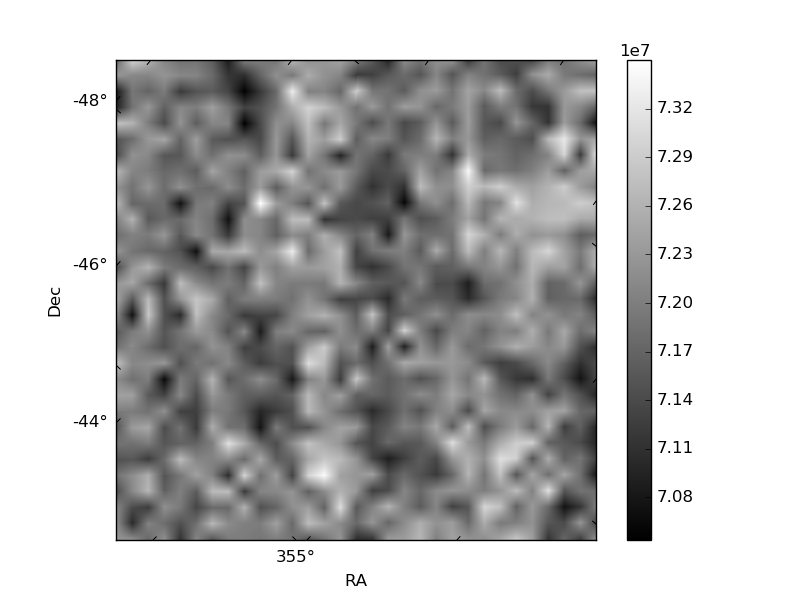
Histogram calculated using DETX and DETY for each event in the final _common_clean file
| Quadrant A | 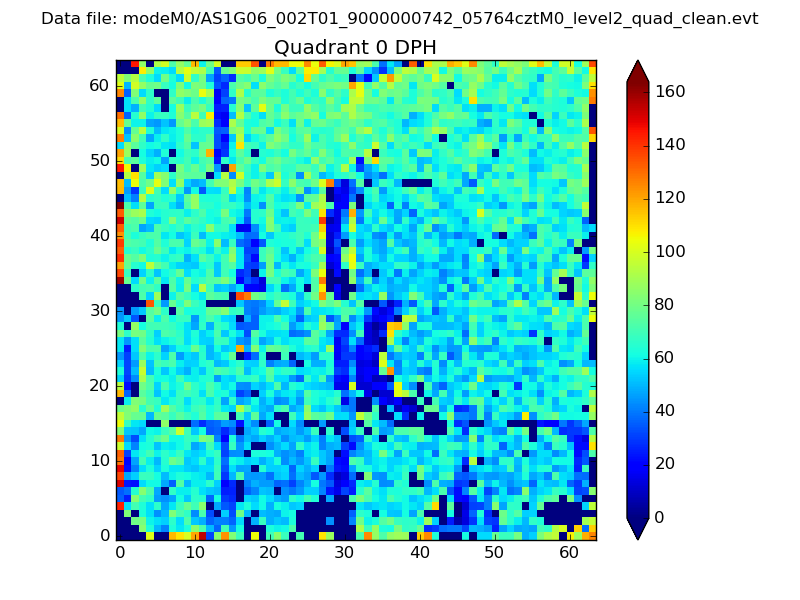 |
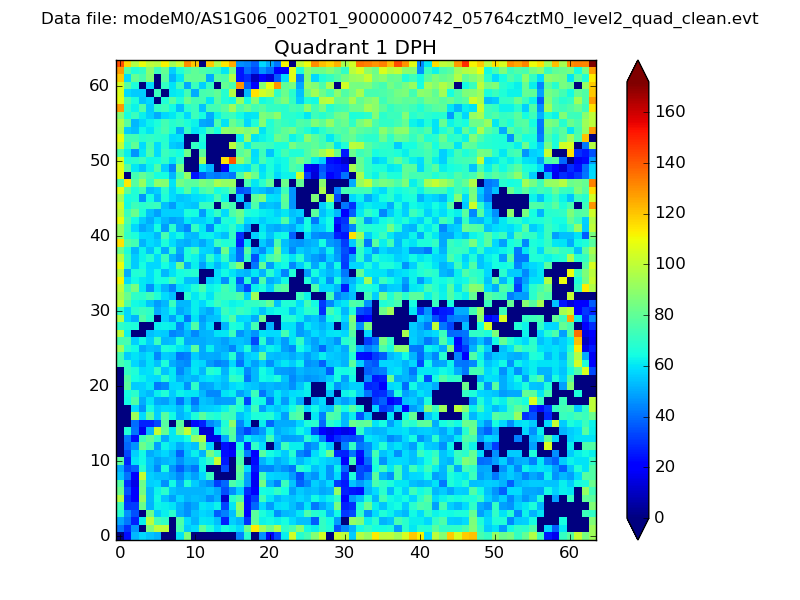 |
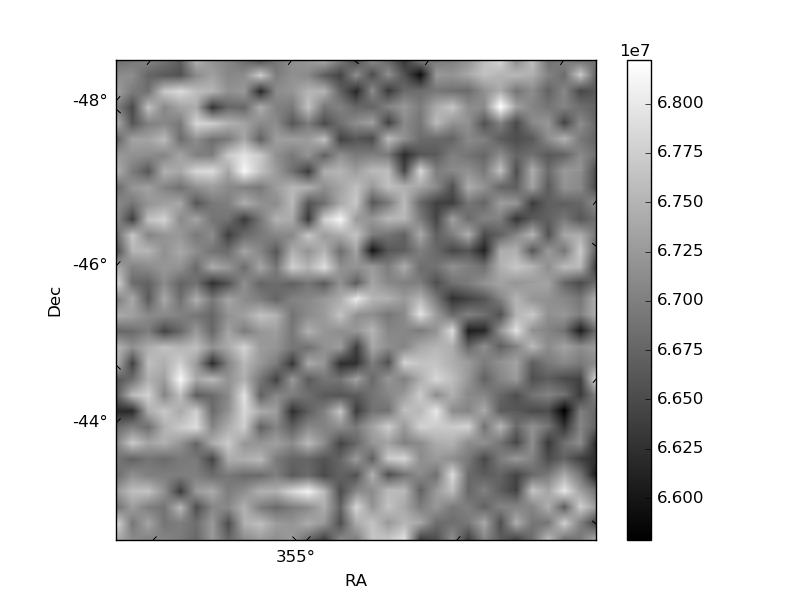
Quadrant B |
|---|---|---|---|
| Quadrant D | 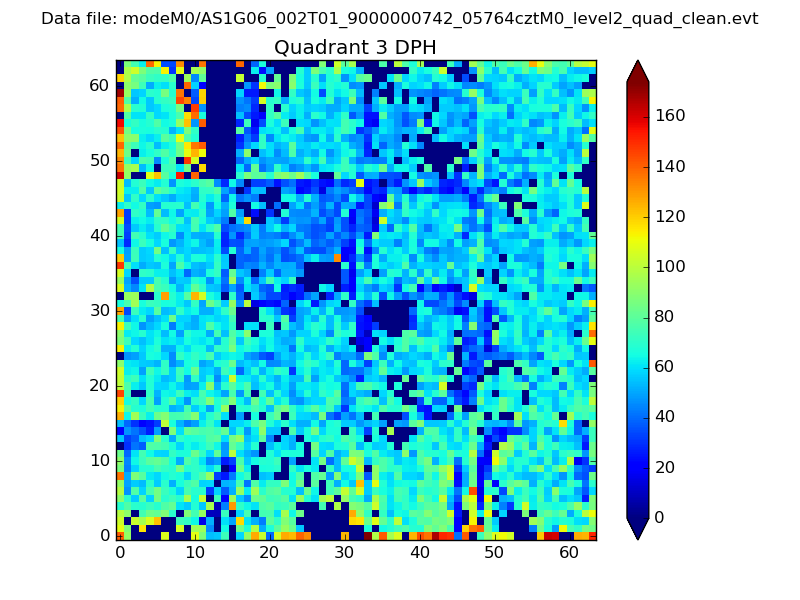 |
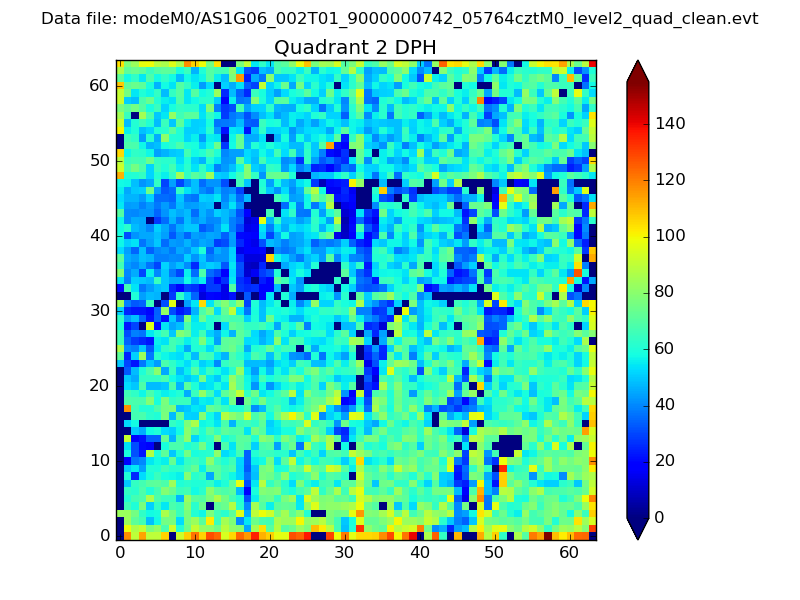 |
Quadrant C |
| Plot type | Count rate plots | Images |
|---|---|---|
| Comparison with Poisson distribution Blue bars denote a histogram of data divided into 1 sec bins. Red curve is a Poisson curve with rate = median count rate of data. |
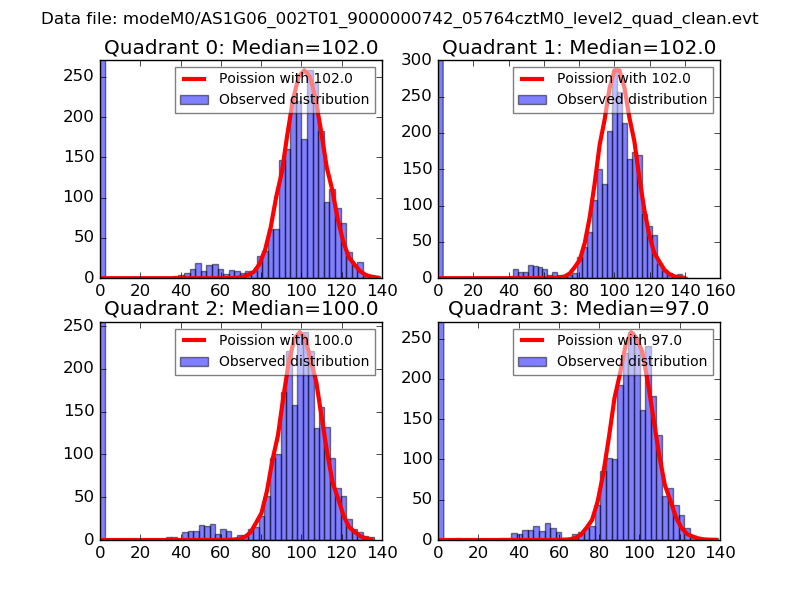 |
 |
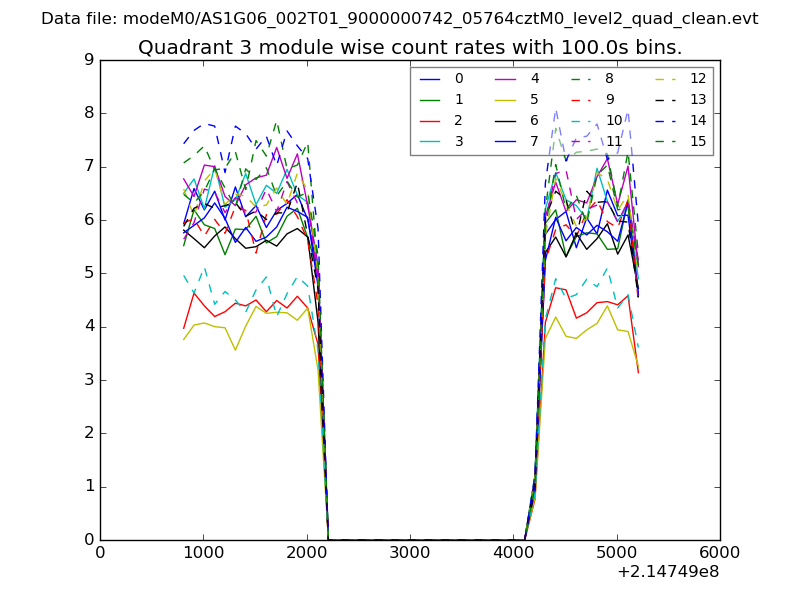
| Quadrant-wise count rates Data is divided into 100 sec bins |
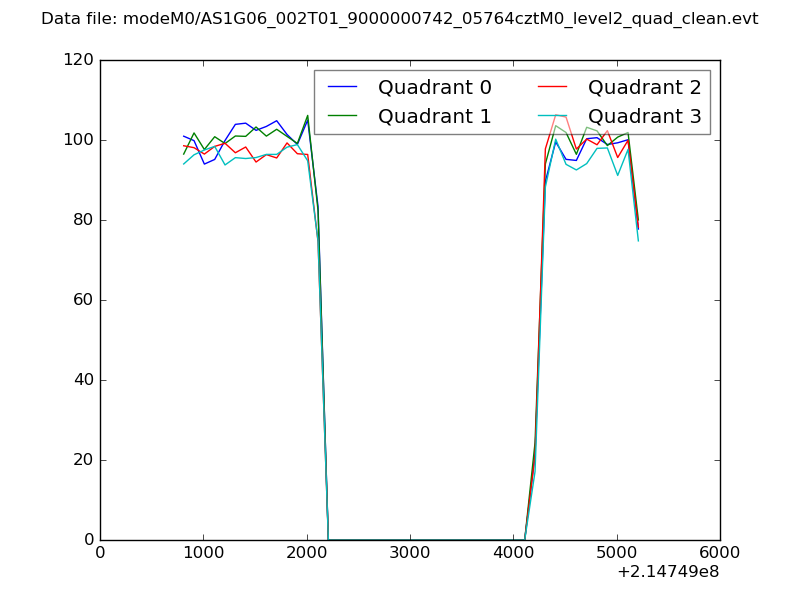 |
|
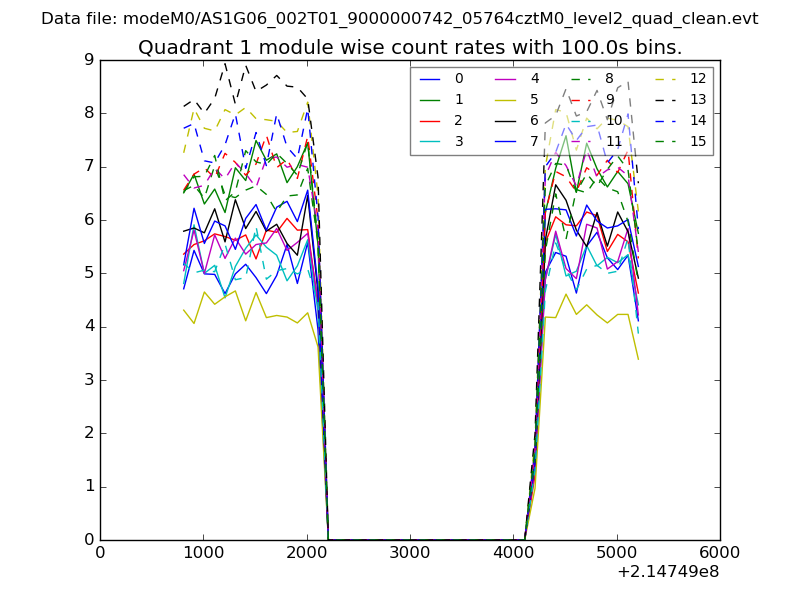
| Module-wise count rates for Quadrant A Data is divided into 100 sec bins |
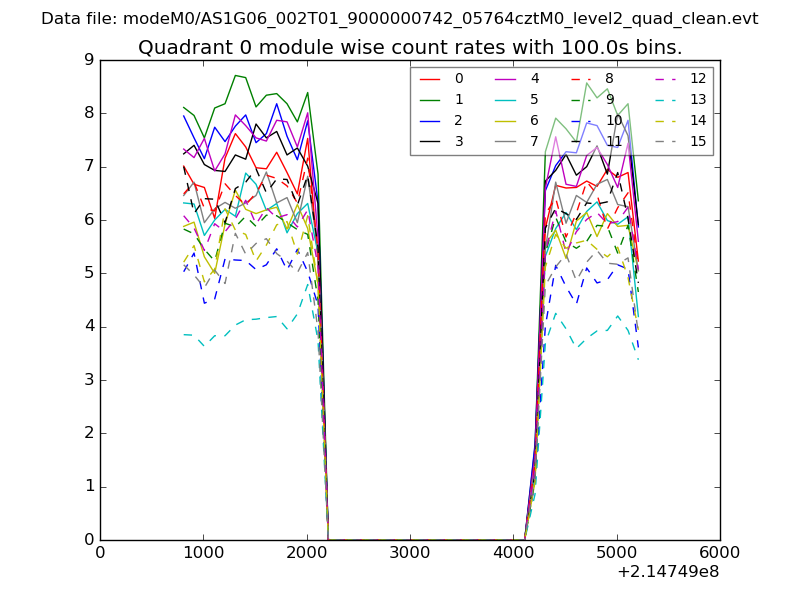 |
 |
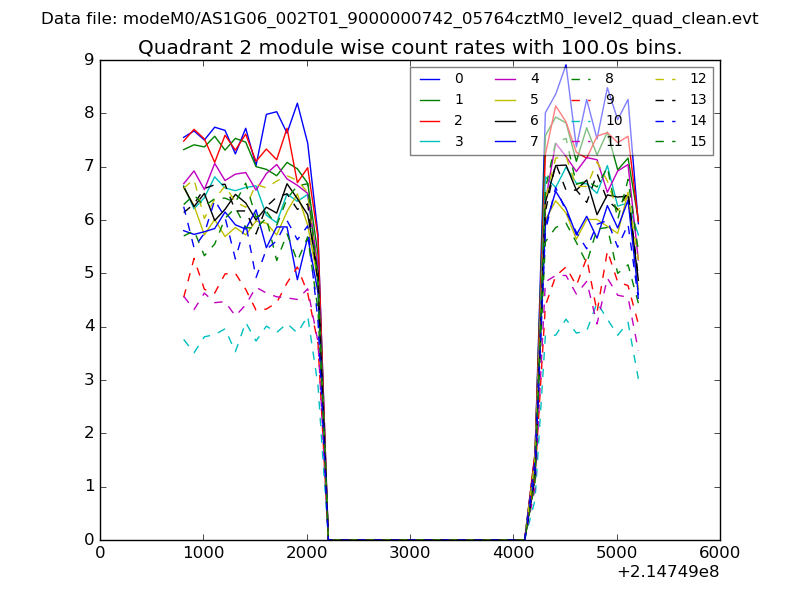
| Module-wise count rates for Quadrant B Data is divided into 100 sec bins |
 |
 |
| Module-wise count rates for Quadrant C Data is divided into 100 sec bins |
 |
 |
| Module-wise count rates for Quadrant D Data is divided into 100 sec bins |
 |
 |
| Parameter | Plot |
|---|---|
| CZT HV Monitor | 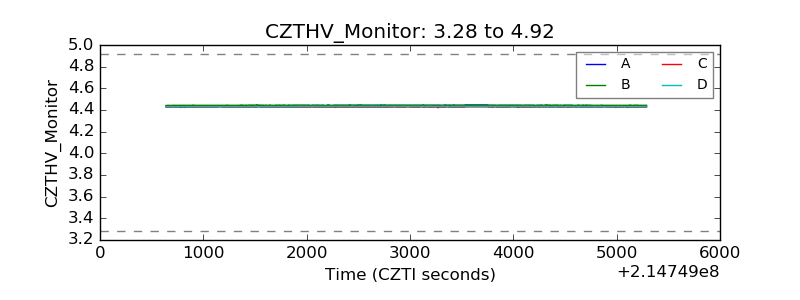 |
| D_VDD | 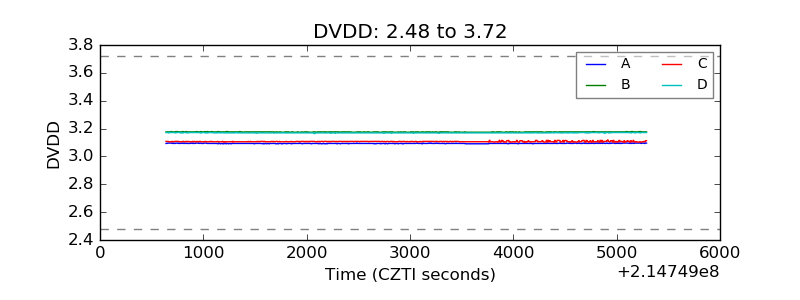 |
| Temperature 1 | 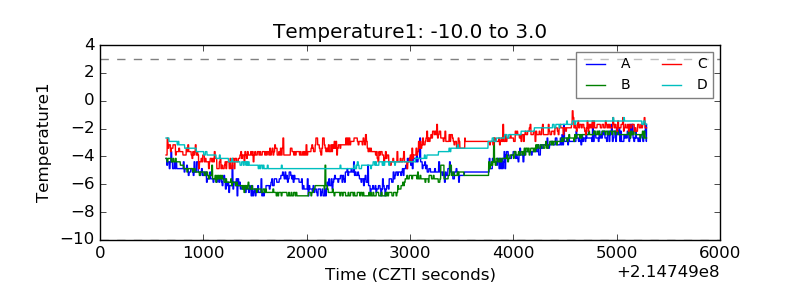 |
| Veto HV Monitor | 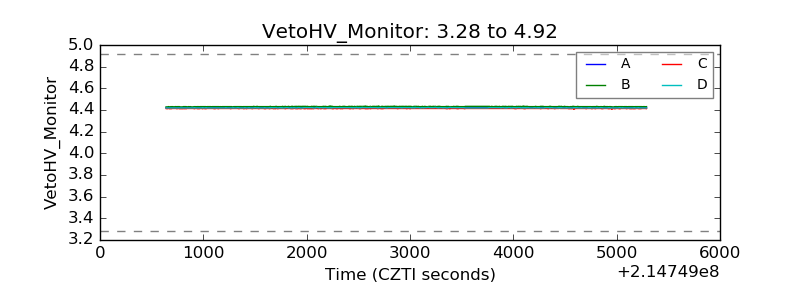 |
| Veto LLD | 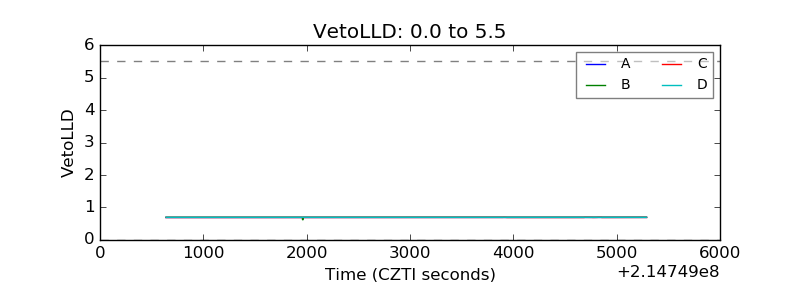 |
| Alpha Counter | 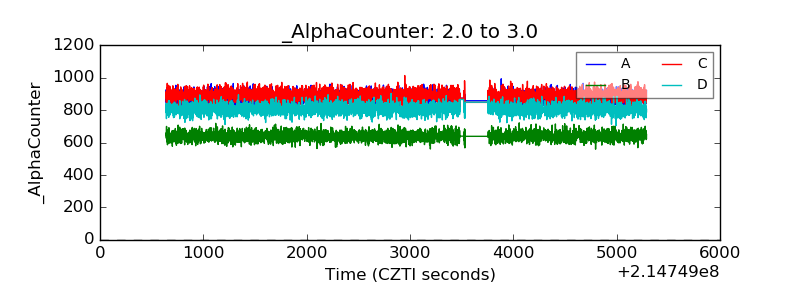 |
| _CPM_Rate | 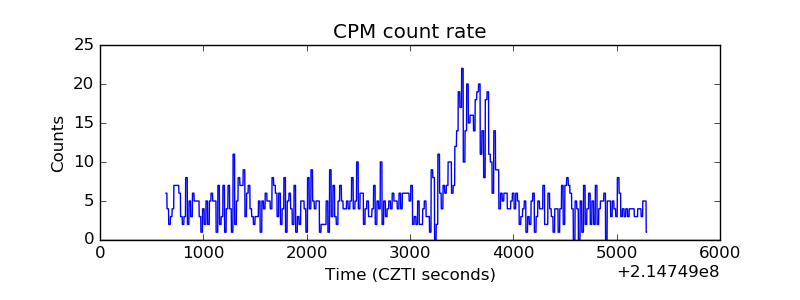 |
| CZT Counter | 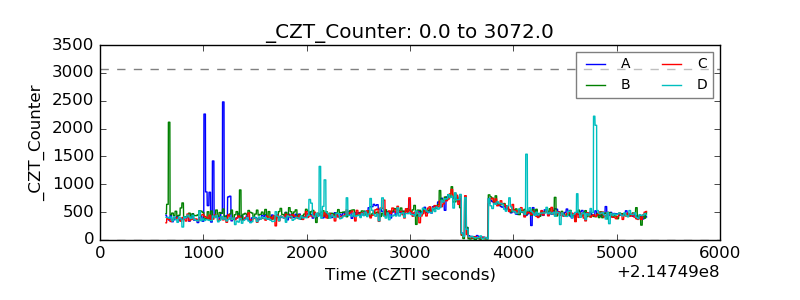 |
| +2.5 Volts monitor |  |
| +5 Volts monitor |  |
| _ROLL_ROT | 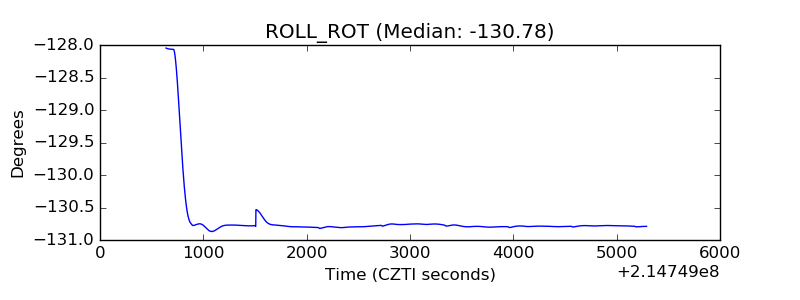 |
| _Roll_DEC | 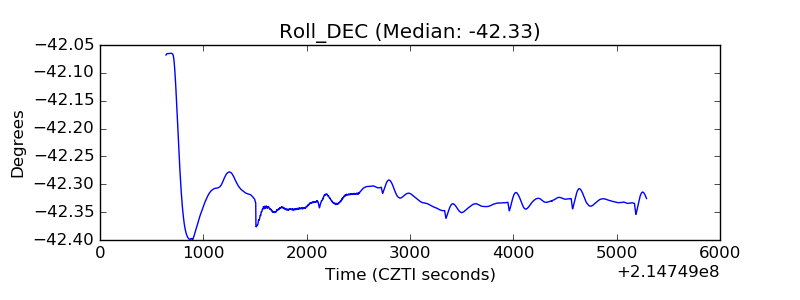 |
| _Roll_RA |  |
| Veto Counter | 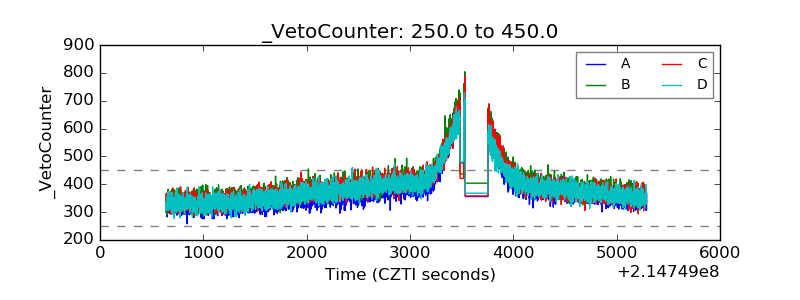 |