| Param | Original file | Final file |
|---|---|---|
| Filename | modeM0/AS1G06_002T01_9000000742_05765cztM0_level2.evt | modeM0/AS1G06_002T01_9000000742_05765cztM0_level2_quad_clean.evt |
| Size (bytes) | 510,966,720 | 88,528,320 |
| Size | 487.3 MB | 84.4 MB |
| Events in quadrant A | 3,639,706 | 537,670 |
| Events in quadrant B | 3,843,872 | 541,443 |
| Events in quadrant C | 3,606,679 | 533,672 |
| Events in quadrant D | 3,844,592 | 516,028 |
| Mode M0 | |||
|---|---|---|---|
| Quadrant | BADHDUFLAG | Total packets | Discarded packets |
| A | 0 | 16726 | 239 |
| B | 0 | 16979 | 242 |
| C | 0 | 16731 | 229 |
| D | 0 | 17465 | 314 |
| Mode SS | |||
|---|---|---|---|
| Quadrant | BADHDUFLAG | Total packets | Discarded packets |
| A | 0 | 162 | 2 |
| B | 0 | 162 | 0 |
| C | 0 | 162 | 0 |
| D | 0 | 162 | 2 |
| Quadrant | Total seconds | Saturated seconds | Saturation percentage |
|---|---|---|---|
| A | 7933 | 104 | 1.310979% |
| B | 7933 | 108 | 1.361402% |
| C | 7937 | 23 | 0.289782% |
| D | 7921 | 101 | 1.275092% |
Noise dominated data is calculated using 1-second bins in cleaned event files. If a bin has >2000 counts, and if more than 50% of those come from <1% of pixels, then it is considered to be noise-dominated and hence unusable.
| Quadrant | # 1 sec bins | Bins with >0 counts | Bins with >2000 counts | High rate bins dominated by noise | Noise dominated (total time) | Noise dominated (detector-on time) | Marked lightcurve |
|---|---|---|---|---|---|---|---|
| A | 8051 | 8043 | 0 | 0 | 0.00% | 0.00% | 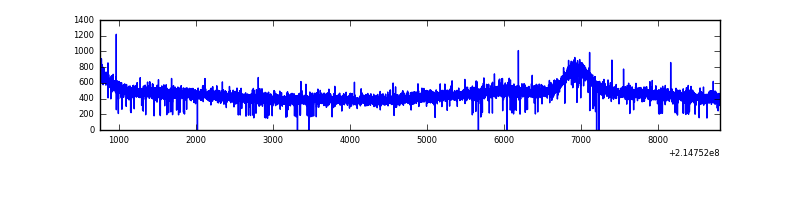 |
| B | 8051 | 8048 | 0 | 0 | 0.00% | 0.00% | 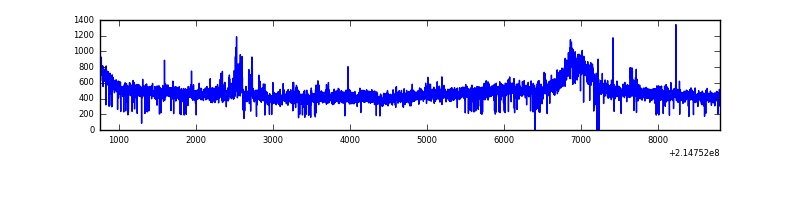 |
| C | 8051 | 8043 | 0 | 0 | 0.00% | 0.00% |  |
| D | 8052 | 8045 | 61 | 61 | 0.76% | 0.76% | 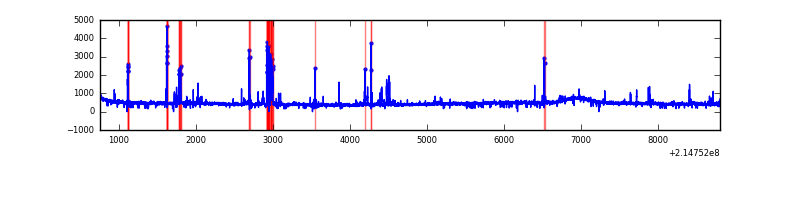 |
Top three noisy pixels from each quadrant. If the there are fewer than three noisy pixels in the level2.evt file, extra rows are filled as -1
| Pixel properties | Quadrant properties | ||||||
|---|---|---|---|---|---|---|---|
| Quadrant | DetID | PixID | Counts | Sigma | Mean | Median | Sigma |
| A | 0 | 226 | 9227 | 42.99 | 944 | 923 | 193.2 |
| A | 12 | 194 | 9201 | 42.86 | 944 | 923 | 193.2 |
| A | 15 | 236 | 5187 | 22.08 | 944 | 923 | 193.2 |
| B | 15 | 204 | 131525 | 716.48 | 951 | 927 | 182.3 |
| B | 12 | 111 | 17510 | 90.98 | 951 | 927 | 182.3 |
| B | 11 | 111 | 14119 | 72.37 | 951 | 927 | 182.3 |
| C | 8 | 128 | 21639 | 97.74 | 912 | 916 | 212.0 |
| C | 8 | 112 | 10104 | 43.34 | 912 | 916 | 212.0 |
| C | 9 | 16 | 8117 | 33.96 | 912 | 916 | 212.0 |
| D | 12 | 110 | 182186 | 813.93 | 911 | 882 | 222.8 |
| D | 2 | 14 | 84077 | 373.49 | 911 | 882 | 222.8 |
| D | 11 | 241 | 47143 | 207.68 | 911 | 882 | 222.8 |
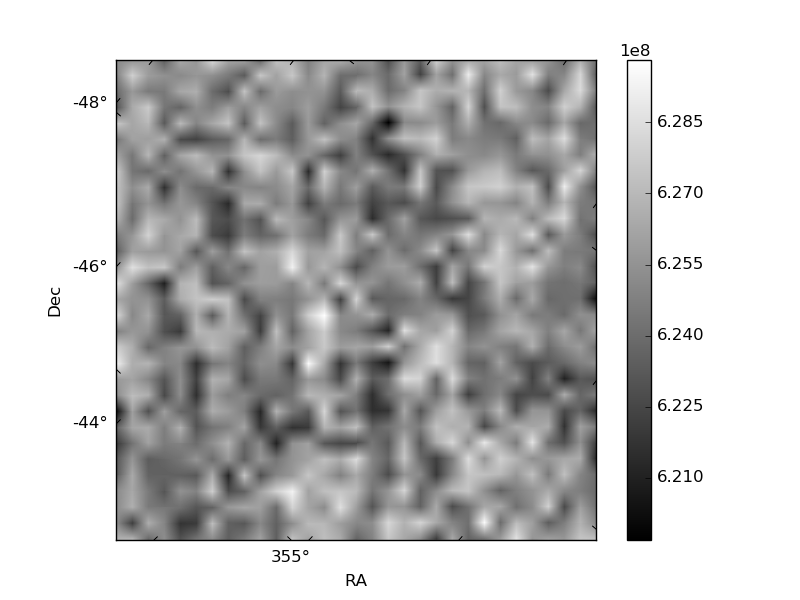
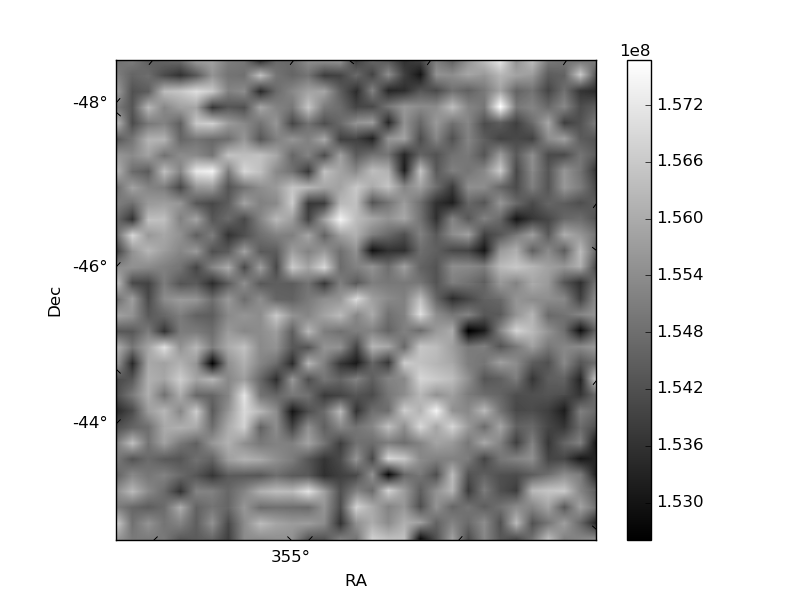
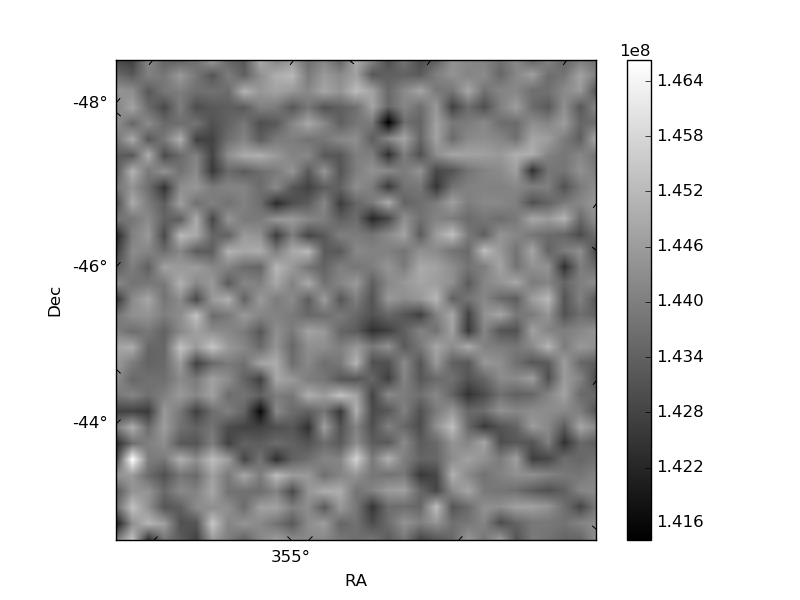
Histogram calculated using DETX and DETY for each event in the final _common_clean file
| Quadrant A | 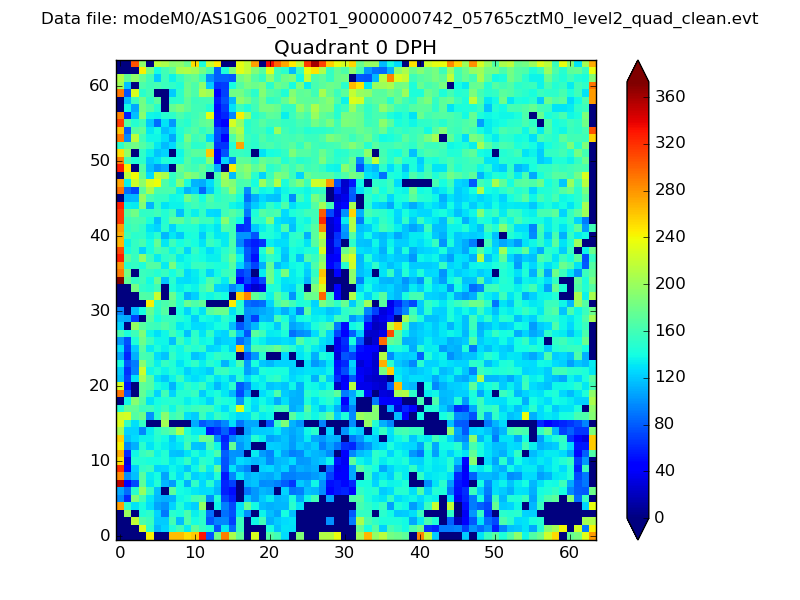 |
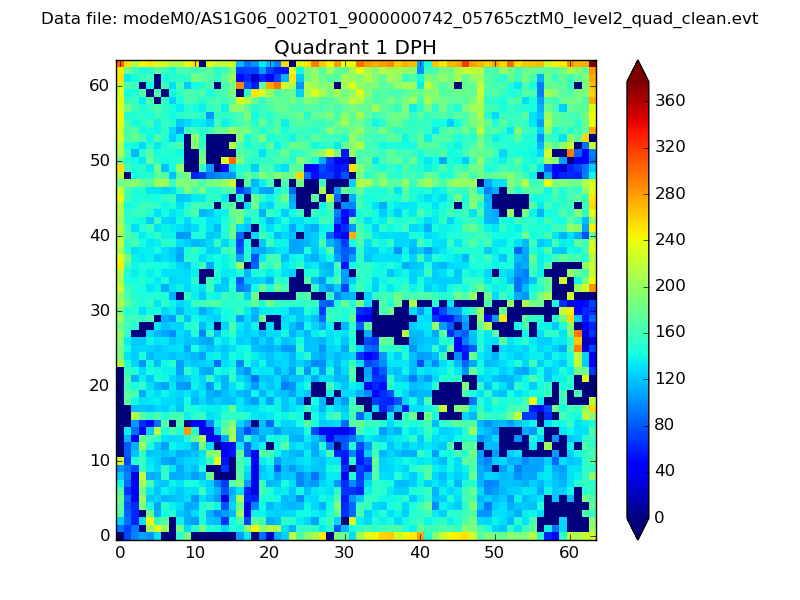 |
Quadrant B |
|---|---|---|---|
| Quadrant D | 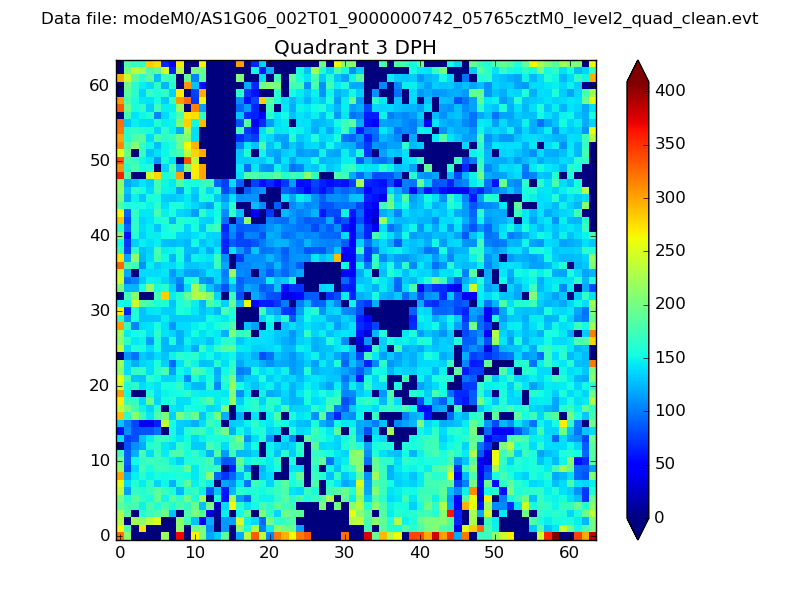 |
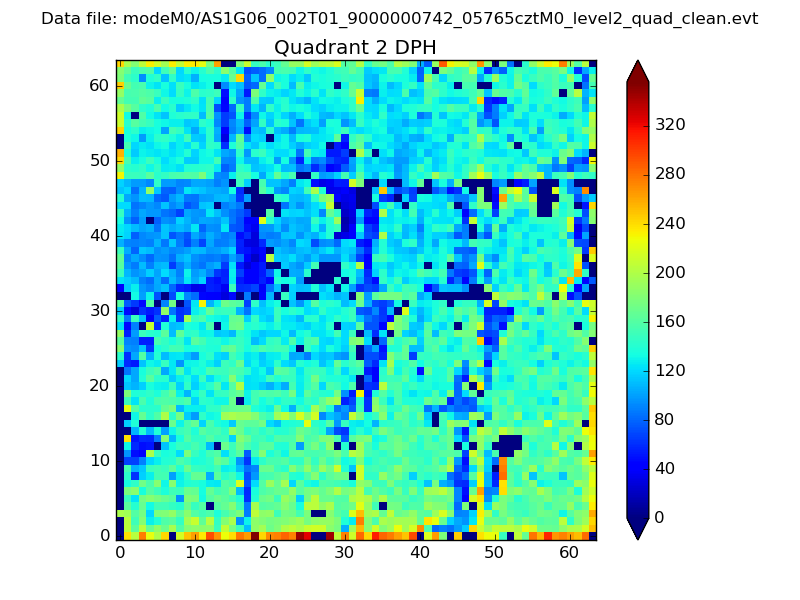 |
Quadrant C |
| Plot type | Count rate plots | Images |
|---|---|---|
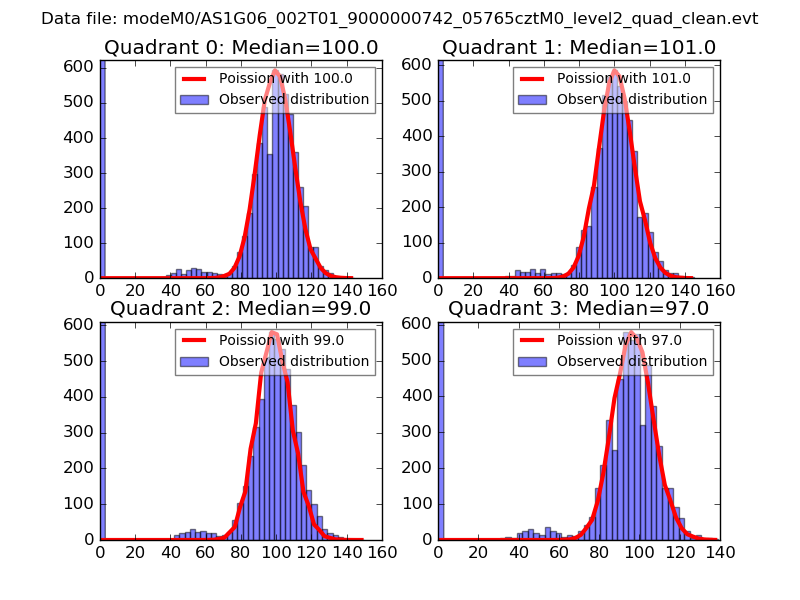
| Comparison with Poisson distribution Blue bars denote a histogram of data divided into 1 sec bins. Red curve is a Poisson curve with rate = median count rate of data. |
 |
 |
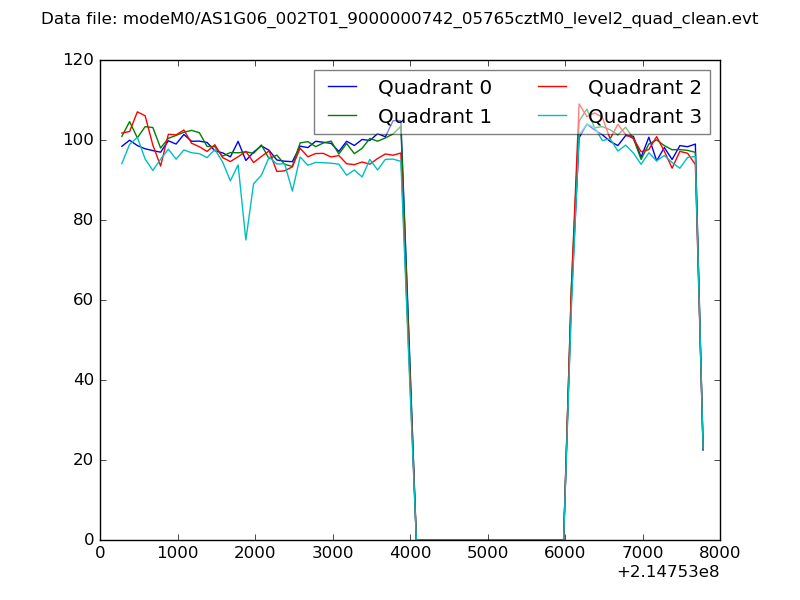
| Quadrant-wise count rates Data is divided into 100 sec bins |
 |
|
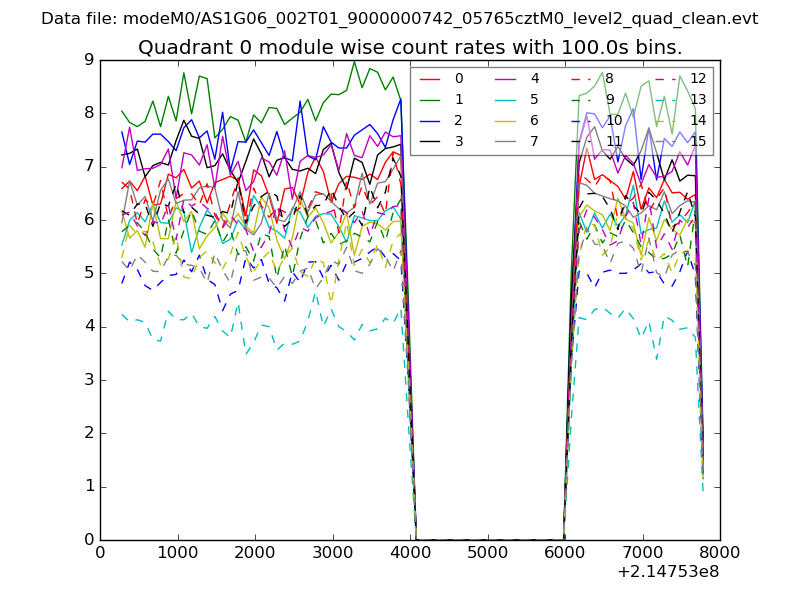
| Module-wise count rates for Quadrant A Data is divided into 100 sec bins |
 |
 |
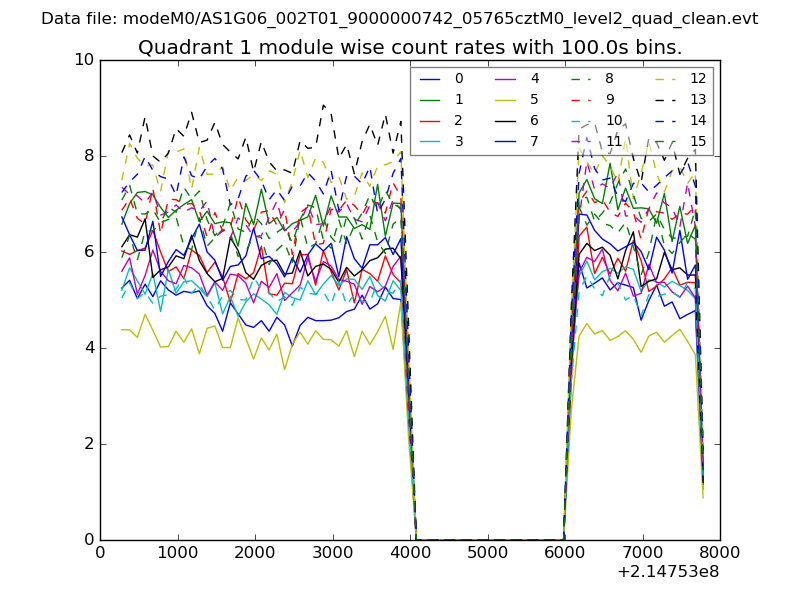
| Module-wise count rates for Quadrant B Data is divided into 100 sec bins |
 |
 |
| Module-wise count rates for Quadrant C Data is divided into 100 sec bins |
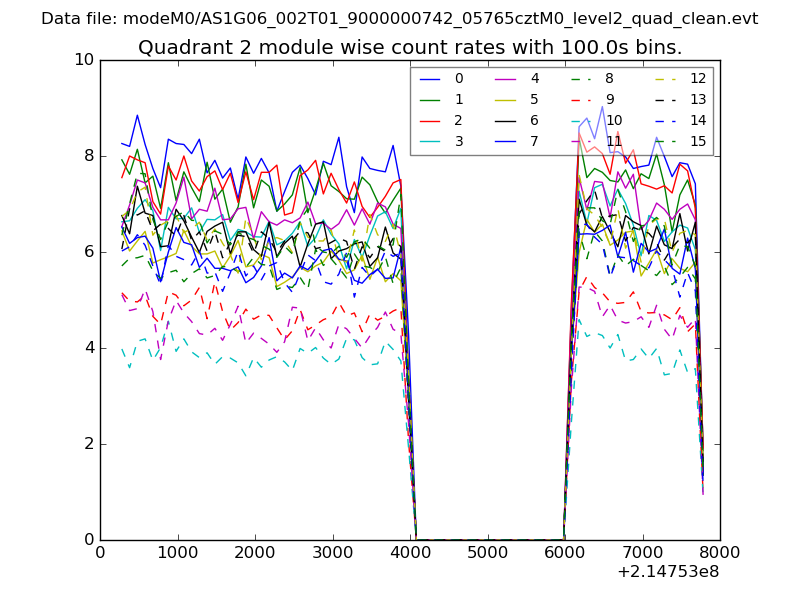 |
 |
| Module-wise count rates for Quadrant D Data is divided into 100 sec bins |
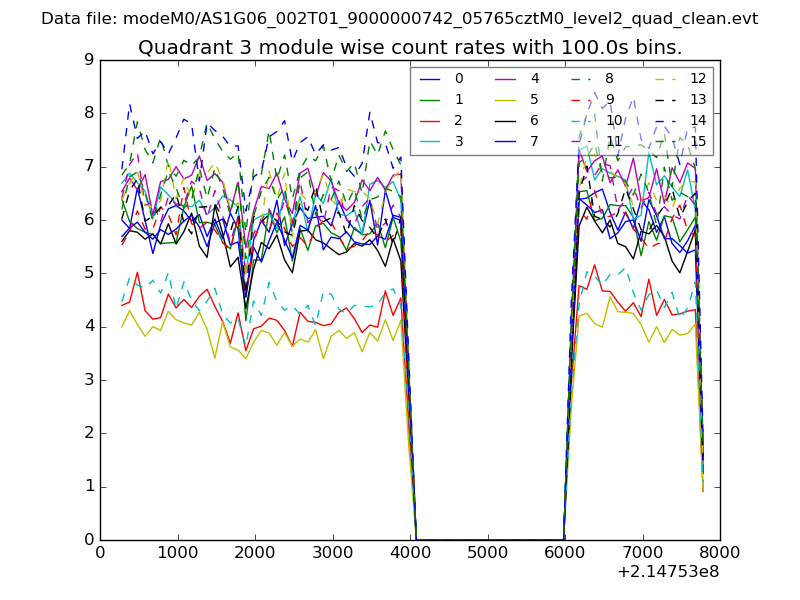 |
 |
| Parameter | Plot |
|---|---|
| CZT HV Monitor | 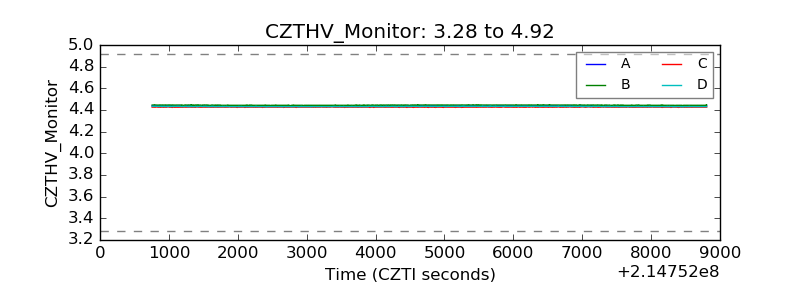 |
| D_VDD | 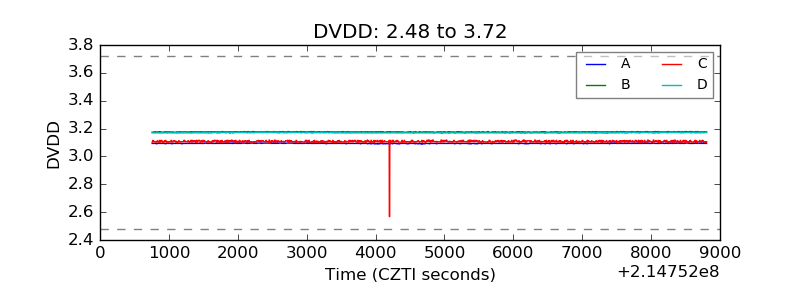 |
| Temperature 1 | 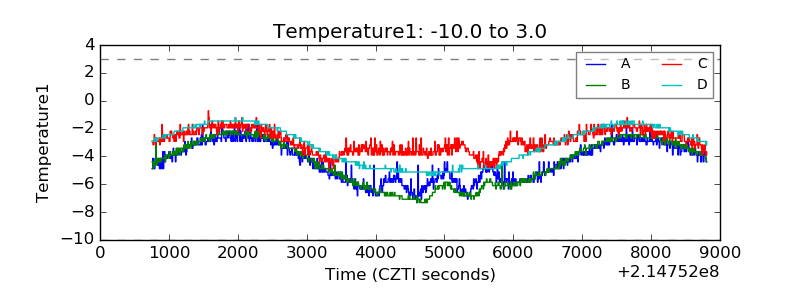 |
| Veto HV Monitor |  |
| Veto LLD | 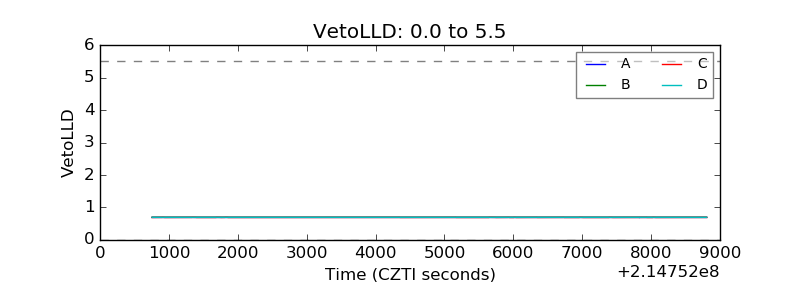 |
| Alpha Counter | 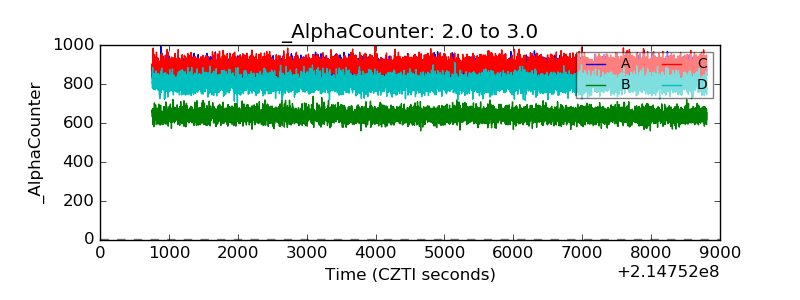 |
| _CPM_Rate | 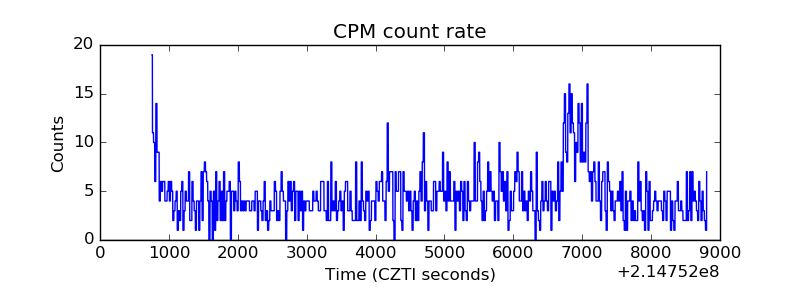 |
| CZT Counter | 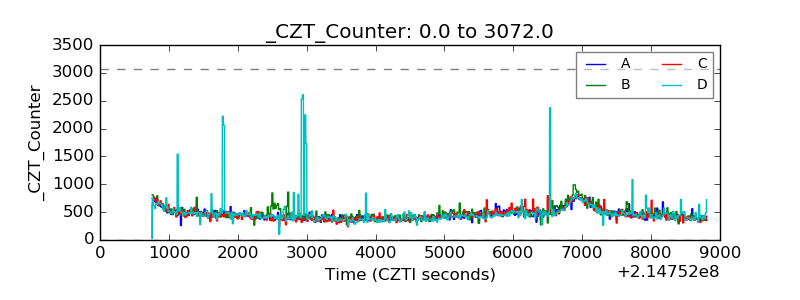 |
| +2.5 Volts monitor |  |
| +5 Volts monitor |  |
| _ROLL_ROT | 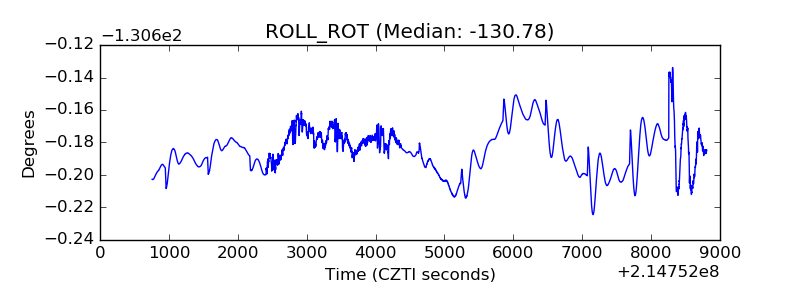 |
| _Roll_DEC | 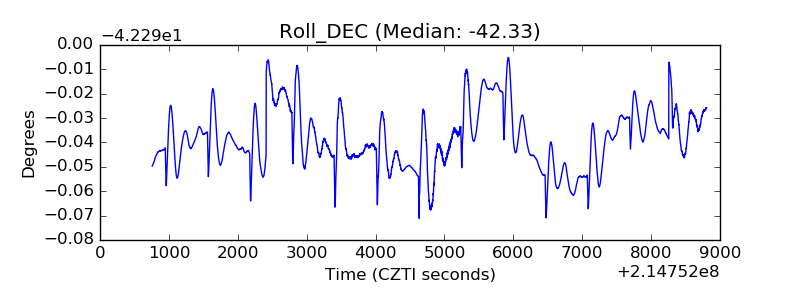 |
| _Roll_RA | 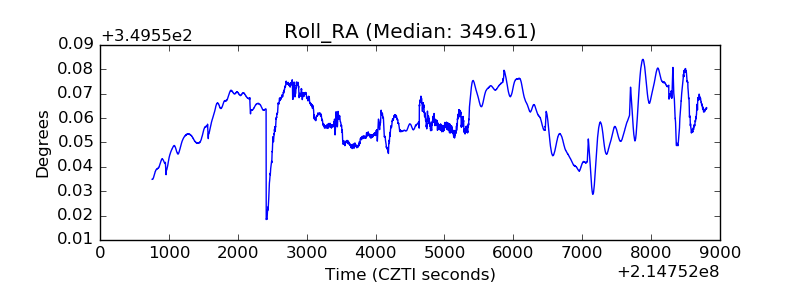 |
| Veto Counter | 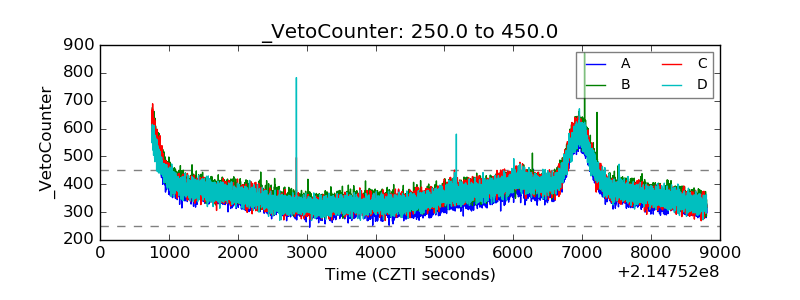 |