| Param | Original file | Final file |
|---|---|---|
| Filename | modeM0/AS1G06_002T01_9000000742_05769cztM0_level2.evt | modeM0/AS1G06_002T01_9000000742_05769cztM0_level2_quad_clean.evt |
| Size (bytes) | 1,082,626,560 | 194,198,400 |
| Size | 1.0 GB | 185.2 MB |
| Events in quadrant A | 7,856,391 | 1,182,538 |
| Events in quadrant B | 8,236,017 | 1,185,340 |
| Events in quadrant C | 7,685,649 | 1,161,287 |
| Events in quadrant D | 7,803,703 | 1,126,332 |
| Mode M0 | |||
|---|---|---|---|
| Quadrant | BADHDUFLAG | Total packets | Discarded packets |
| A | 0 | 37627 | 1429 |
| B | 0 | 37964 | 1510 |
| C | 0 | 37527 | 1546 |
| D | 0 | 38126 | 1616 |
| Mode M9 | |||
|---|---|---|---|
| Quadrant | BADHDUFLAG | Total packets | Discarded packets |
| A | 0 | 23 | 0 |
| B | 0 | 23 | 0 |
| C | 0 | 23 | 0 |
| D | 0 | 23 | 0 |
| Mode SS | |||
|---|---|---|---|
| Quadrant | BADHDUFLAG | Total packets | Discarded packets |
| A | 0 | 378 | 22 |
| B | 0 | 377 | 7 |
| C | 0 | 377 | 21 |
| D | 0 | 378 | 10 |
| Quadrant | Total seconds | Saturated seconds | Saturation percentage |
|---|---|---|---|
| A | 17820 | 74 | 0.415264% |
| B | 17786 | 77 | 0.432925% |
| C | 17760 | 40 | 0.225225% |
| D | 17746 | 63 | 0.355010% |
Noise dominated data is calculated using 1-second bins in cleaned event files. If a bin has >2000 counts, and if more than 50% of those come from <1% of pixels, then it is considered to be noise-dominated and hence unusable.
| Quadrant | # 1 sec bins | Bins with >0 counts | Bins with >2000 counts | High rate bins dominated by noise | Noise dominated (total time) | Noise dominated (detector-on time) | Marked lightcurve |
|---|---|---|---|---|---|---|---|
| A | 20802 | 18309 | 0 | 0 | 0.00% | 0.00% | 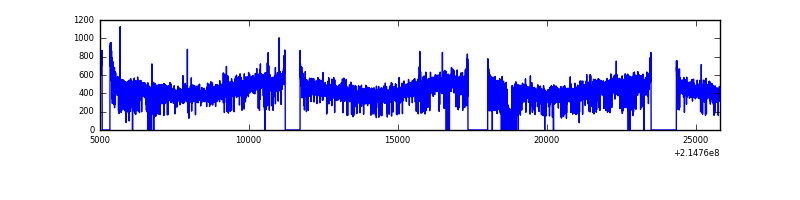 |
| B | 20802 | 18322 | 1 | 1 | 0.00% | 0.01% | 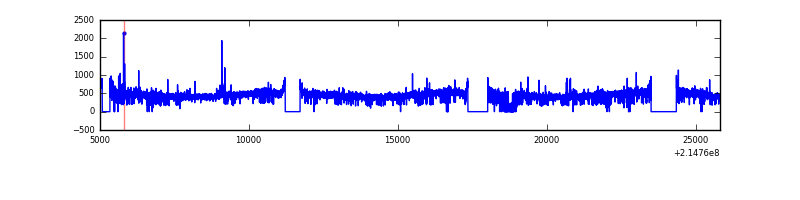 |
| C | 20802 | 18313 | 1 | 1 | 0.00% | 0.01% | 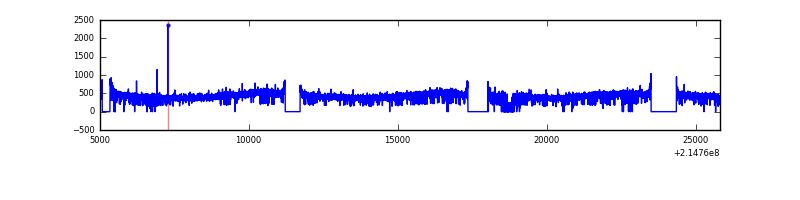 |
| D | 20802 | 18285 | 24 | 24 | 0.12% | 0.13% | 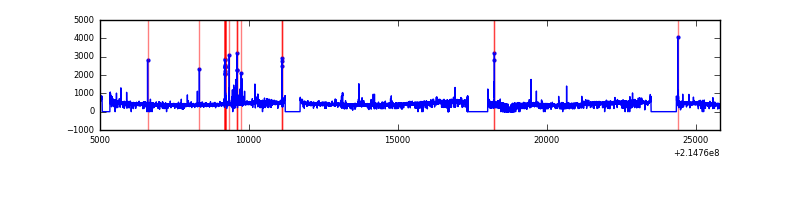 |
Top three noisy pixels from each quadrant. If the there are fewer than three noisy pixels in the level2.evt file, extra rows are filled as -1
| Pixel properties | Quadrant properties | ||||||
|---|---|---|---|---|---|---|---|
| Quadrant | DetID | PixID | Counts | Sigma | Mean | Median | Sigma |
| A | 0 | 226 | 19735 | 42.63 | 2037 | 1992 | 416.2 |
| A | 12 | 194 | 19720 | 42.59 | 2037 | 1992 | 416.2 |
| A | 15 | 236 | 8612 | 15.91 | 2037 | 1992 | 416.2 |
| B | 0 | 219 | 128895 | 321.9 | 2058 | 2009 | 394.2 |
| B | 15 | 204 | 79280 | 196.03 | 2058 | 2009 | 394.2 |
| B | 12 | 111 | 38193 | 91.8 | 2058 | 2009 | 394.2 |
| C | 13 | 61 | 15768 | 30.14 | 1968 | 1975 | 457.7 |
| C | 8 | 222 | 5590 | 7.9 | 1968 | 1975 | 457.7 |
| C | 12 | 4 | 4838 | 6.26 | 1968 | 1975 | 457.7 |
| D | 8 | 195 | 121627 | 250.44 | 1962 | 1902 | 478.1 |
| D | 4 | 95 | 103396 | 212.3 | 1962 | 1902 | 478.1 |
| D | 11 | 241 | 50978 | 102.66 | 1962 | 1902 | 478.1 |
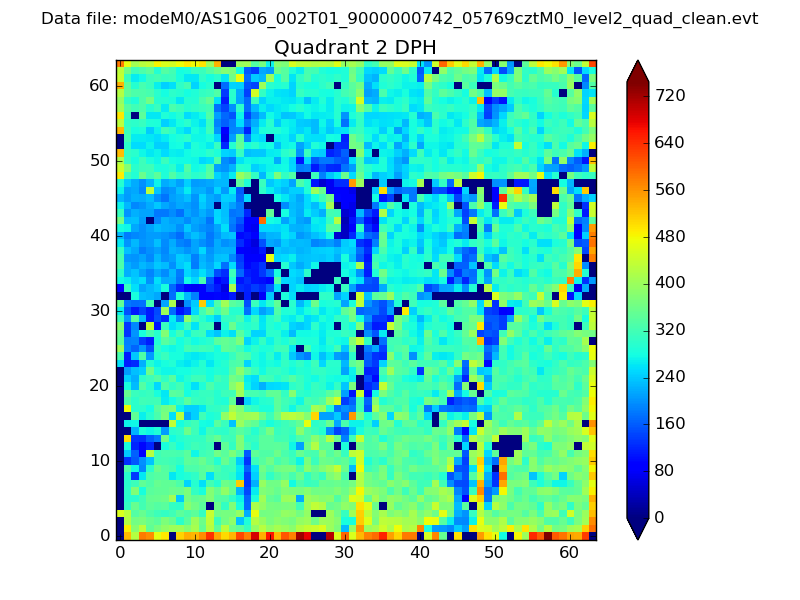
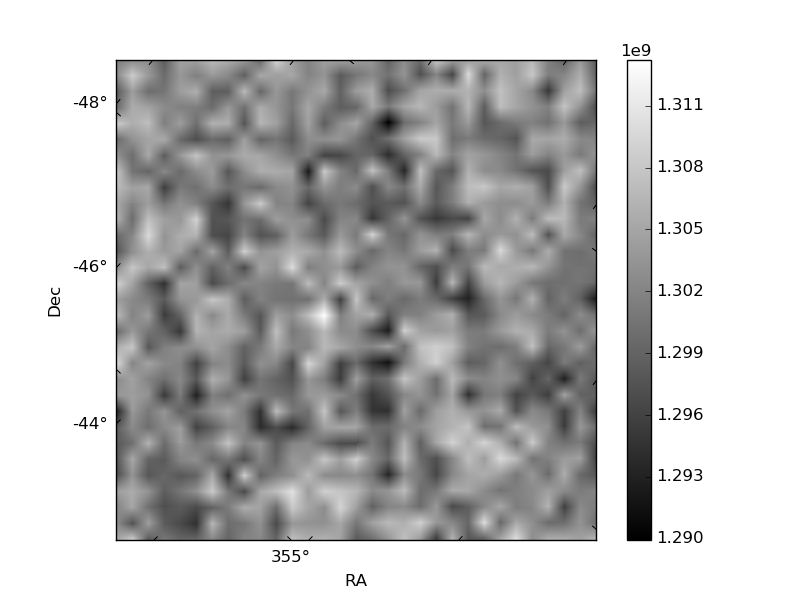
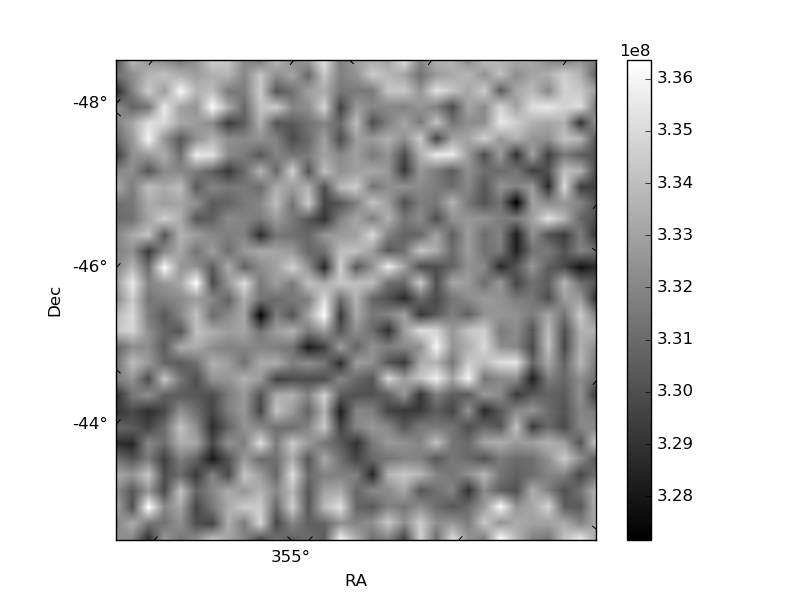
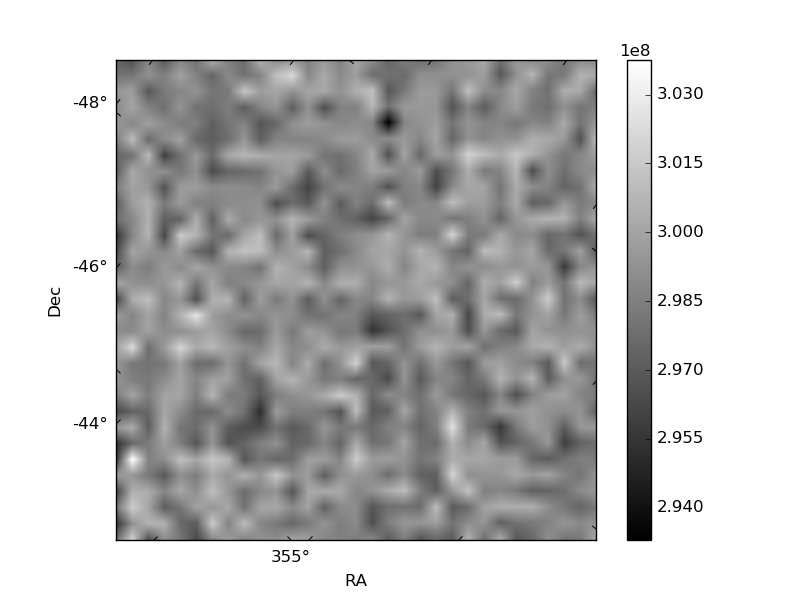
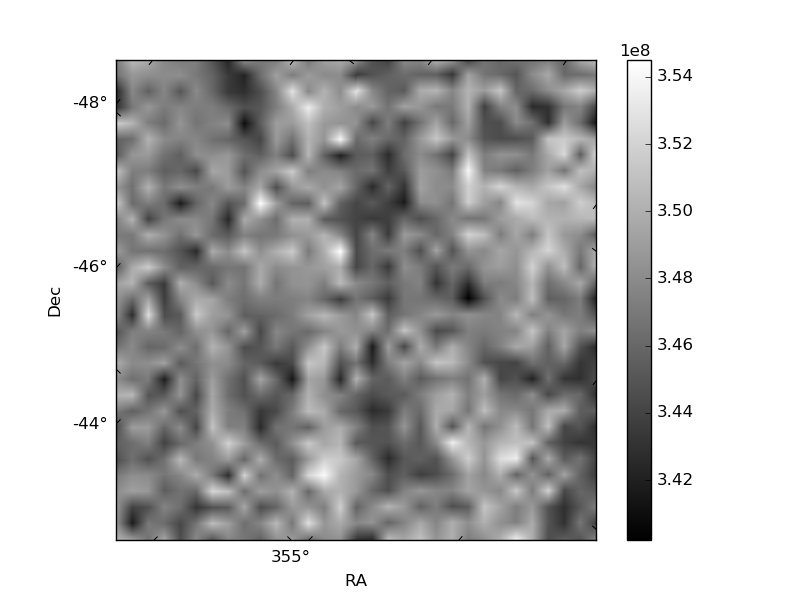
Histogram calculated using DETX and DETY for each event in the final _common_clean file
| Quadrant A | 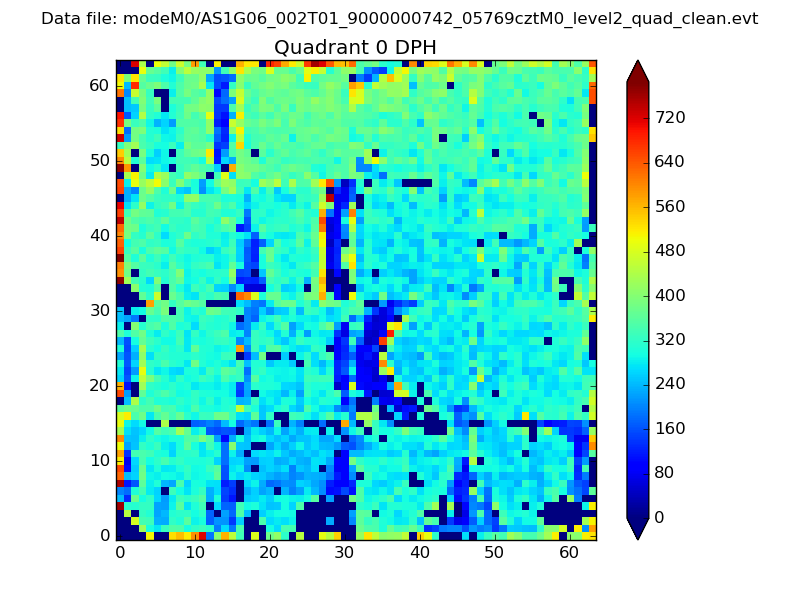 |
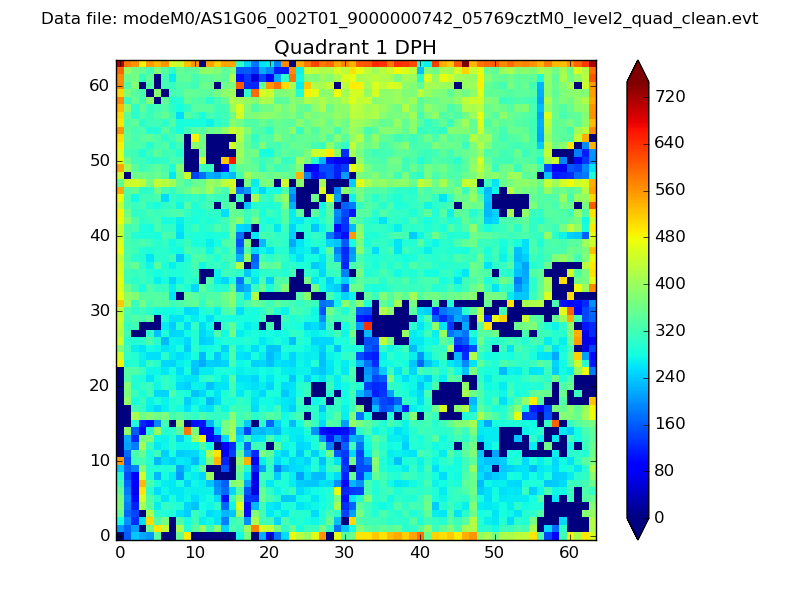 |
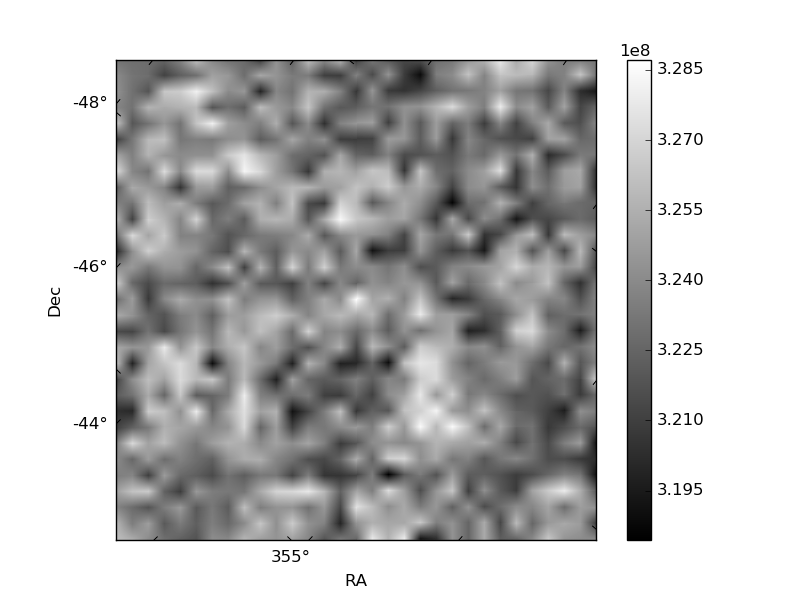
Quadrant B |
|---|---|---|---|
| Quadrant D | 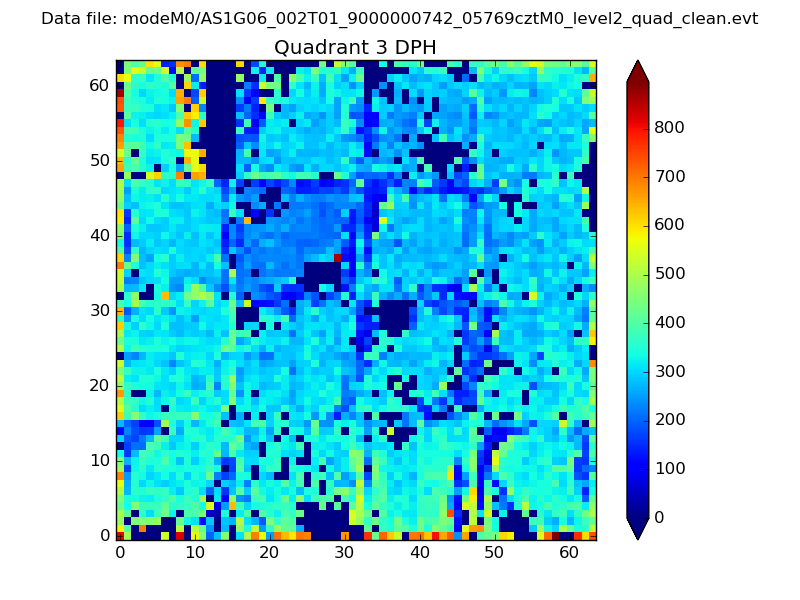 |
 |
Quadrant C |
| Plot type | Count rate plots | Images |
|---|---|---|
| Comparison with Poisson distribution Blue bars denote a histogram of data divided into 1 sec bins. Red curve is a Poisson curve with rate = median count rate of data. |
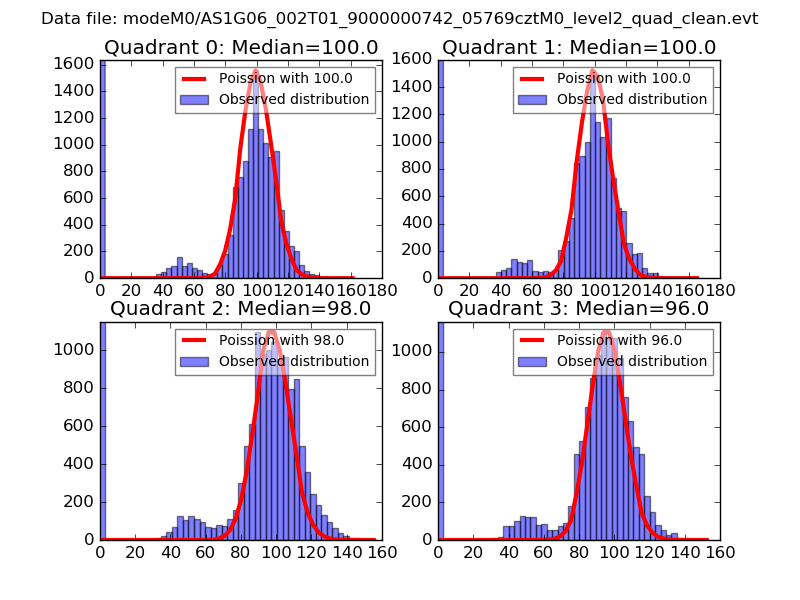 |
 |
| Quadrant-wise count rates Data is divided into 100 sec bins |
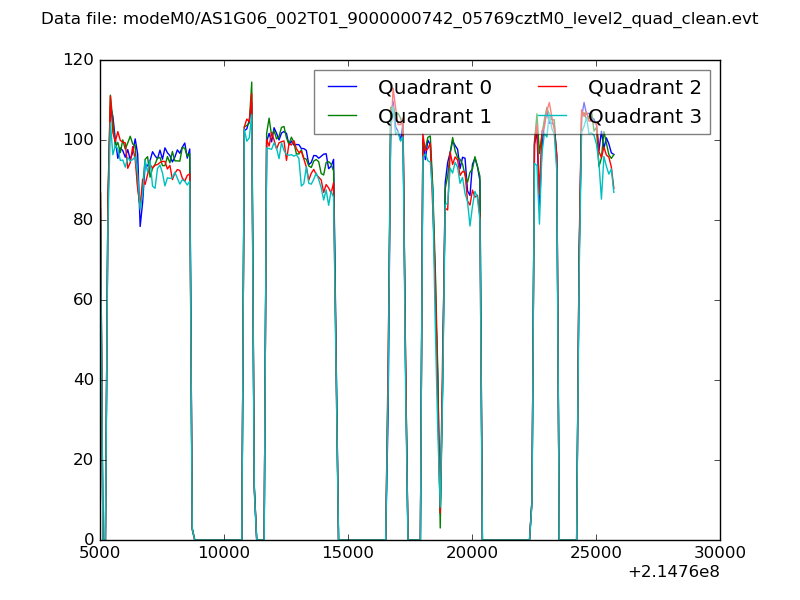 |
|
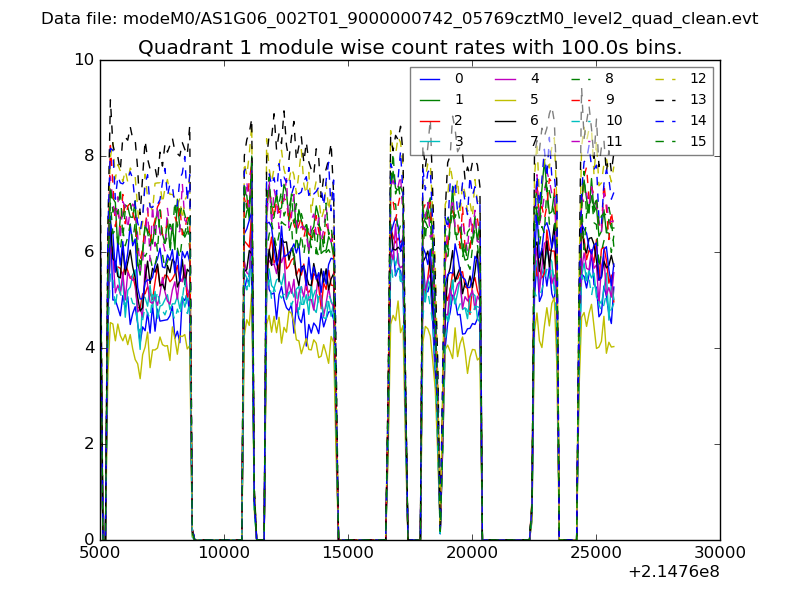
| Module-wise count rates for Quadrant A Data is divided into 100 sec bins |
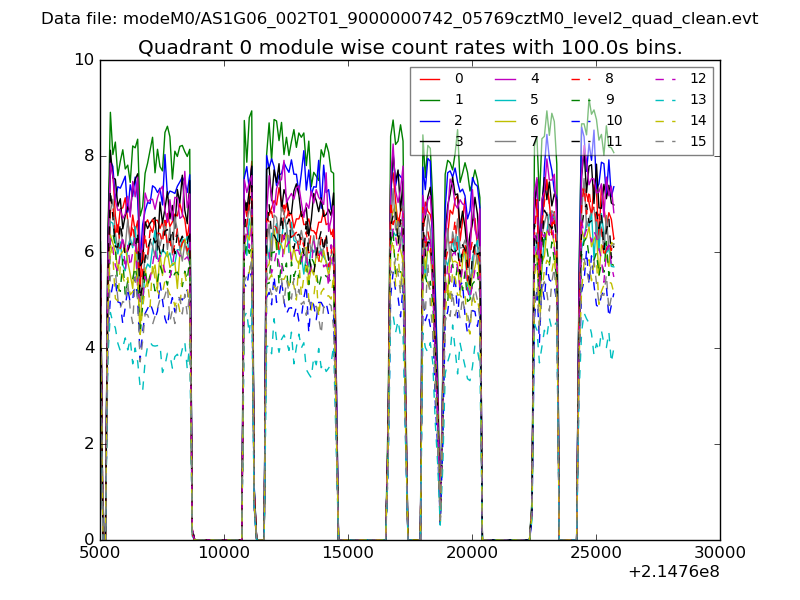 |
 |
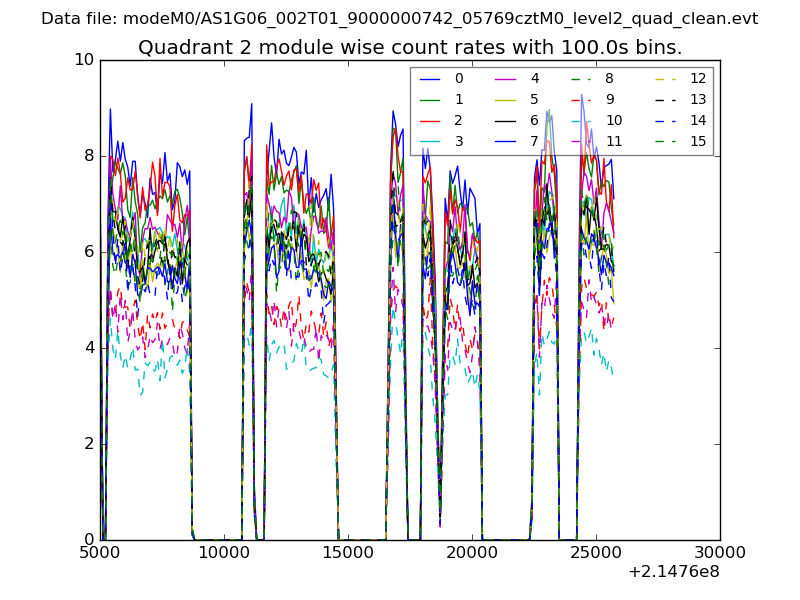
| Module-wise count rates for Quadrant B Data is divided into 100 sec bins |
 |
 |
| Module-wise count rates for Quadrant C Data is divided into 100 sec bins |
 |
 |
| Module-wise count rates for Quadrant D Data is divided into 100 sec bins |
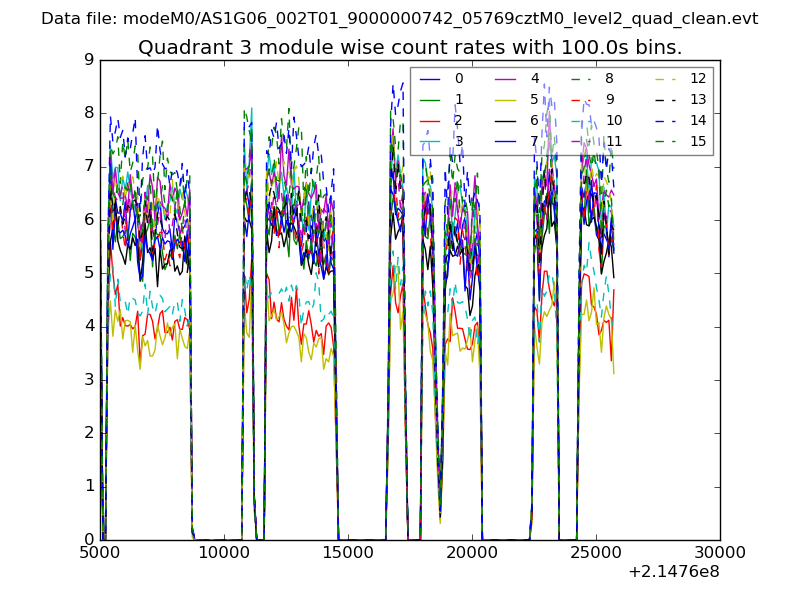 |
 |
| Parameter | Plot |
|---|---|
| CZT HV Monitor | 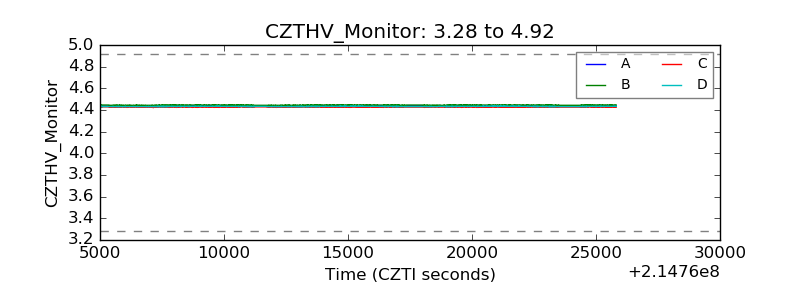 |
| D_VDD | 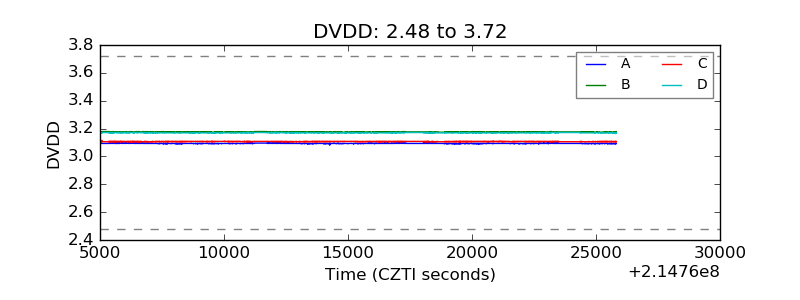 |
| Temperature 1 | 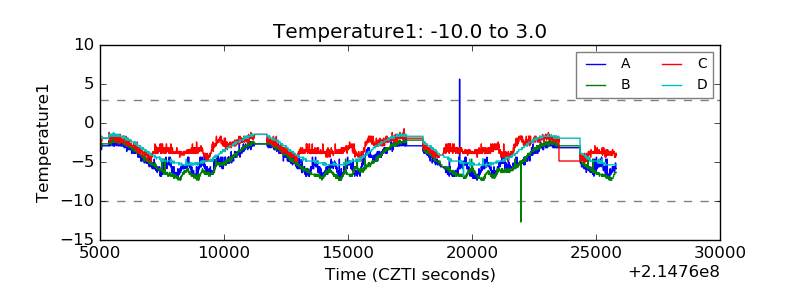 |
| Veto HV Monitor | 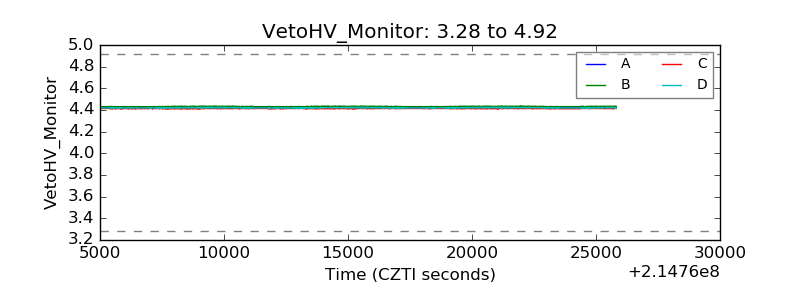 |
| Veto LLD | 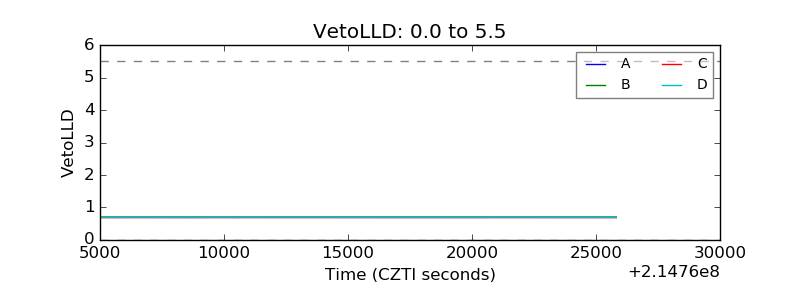 |
| Alpha Counter | 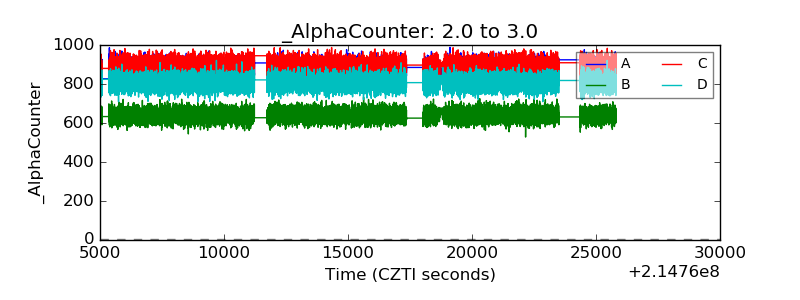 |
| _CPM_Rate | 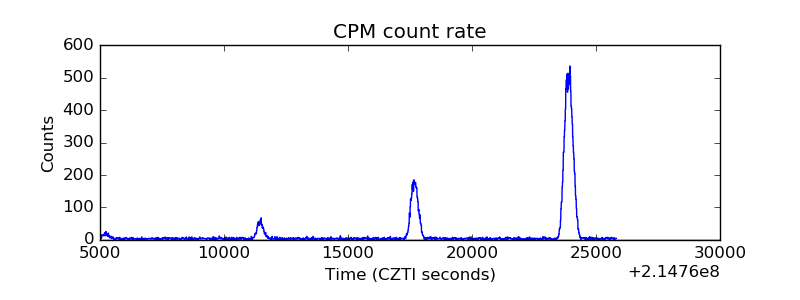 |
| CZT Counter | 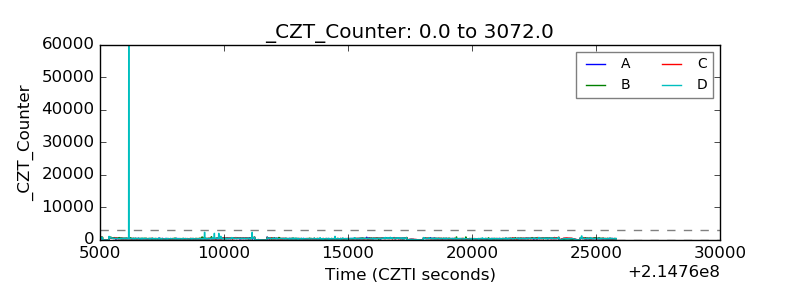 |
| +2.5 Volts monitor |  |
| +5 Volts monitor |  |
| _ROLL_ROT |  |
| _Roll_DEC | 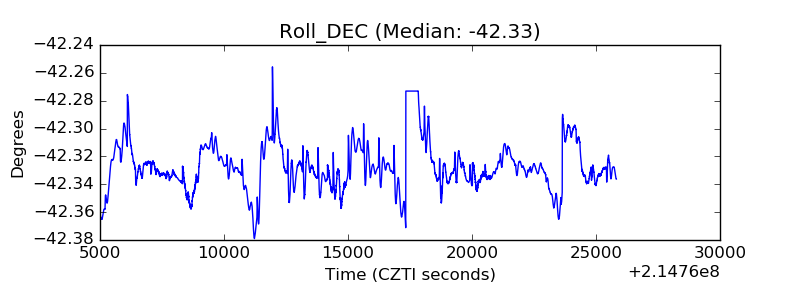 |
| _Roll_RA | 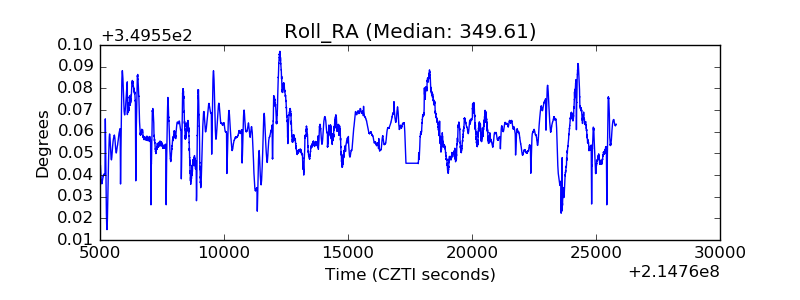 |
| Veto Counter | 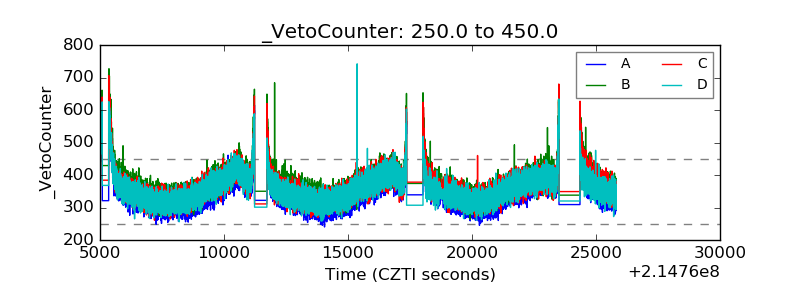 |