| Param | Original file | Final file |
|---|---|---|
| Filename | modeM0/AS1G06_002T01_9000000742_05773cztM0_level2.evt | modeM0/AS1G06_002T01_9000000742_05773cztM0_level2_quad_clean.evt |
| Size (bytes) | 447,785,280 | 75,945,600 |
| Size | 427.0 MB | 72.4 MB |
| Events in quadrant A | 3,201,718 | 457,044 |
| Events in quadrant B | 3,470,376 | 465,507 |
| Events in quadrant C | 3,234,904 | 461,695 |
| Events in quadrant D | 3,193,674 | 443,181 |
| Mode M0 | |||
|---|---|---|---|
| Quadrant | BADHDUFLAG | Total packets | Discarded packets |
| A | 0 | 13927 | 3 |
| B | 0 | 14498 | 2 |
| C | 0 | 14035 | 2 |
| D | 0 | 14003 | 2 |
| Mode M9 | |||
|---|---|---|---|
| Quadrant | BADHDUFLAG | Total packets | Discarded packets |
| A | 0 | 24 | 0 |
| B | 0 | 24 | 0 |
| C | 0 | 24 | 0 |
| D | 0 | 24 | 0 |
| Mode SS | |||
|---|---|---|---|
| Quadrant | BADHDUFLAG | Total packets | Discarded packets |
| A | 0 | 140 | 0 |
| B | 0 | 140 | 0 |
| C | 0 | 140 | 0 |
| D | 0 | 140 | 0 |
| Quadrant | Total seconds | Saturated seconds | Saturation percentage |
|---|---|---|---|
| A | 6773 | 36 | 0.531522% |
| B | 6773 | 83 | 1.225454% |
| C | 6773 | 51 | 0.752990% |
| D | 6773 | 48 | 0.708696% |
Noise dominated data is calculated using 1-second bins in cleaned event files. If a bin has >2000 counts, and if more than 50% of those come from <1% of pixels, then it is considered to be noise-dominated and hence unusable.
| Quadrant | # 1 sec bins | Bins with >0 counts | Bins with >2000 counts | High rate bins dominated by noise | Noise dominated (total time) | Noise dominated (detector-on time) | Marked lightcurve |
|---|---|---|---|---|---|---|---|
| A | 9148 | 6775 | 0 | 0 | 0.00% | 0.00% | 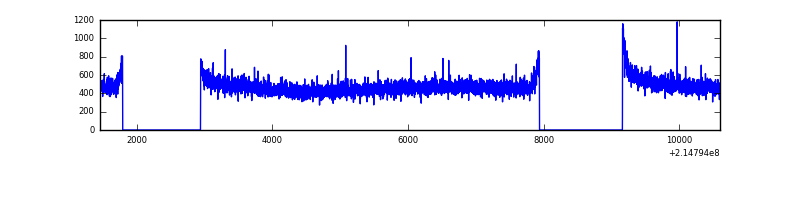 |
| B | 9148 | 6775 | 8 | 8 | 0.09% | 0.12% | 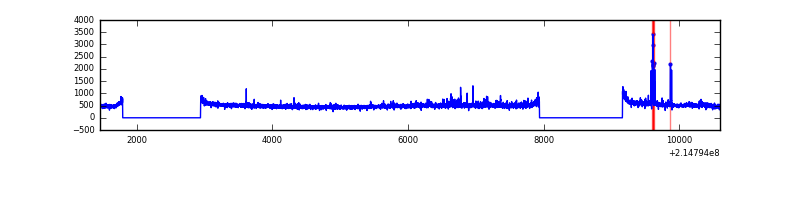 |
| C | 9148 | 6775 | 0 | 0 | 0.00% | 0.00% | 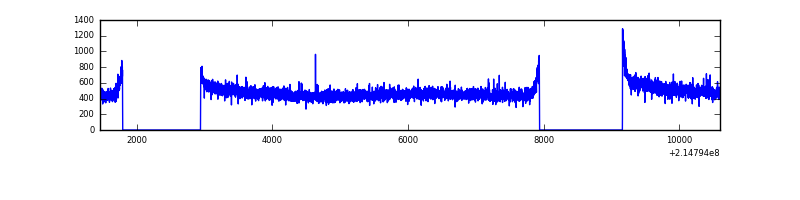 |
| D | 9148 | 6775 | 1 | 1 | 0.01% | 0.01% | 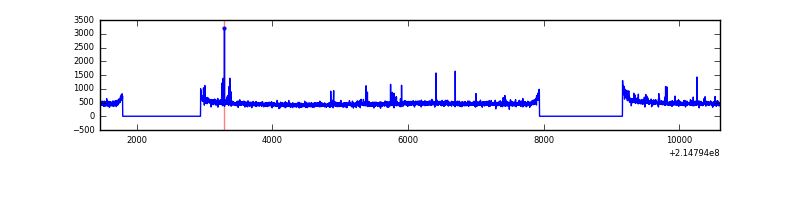 |
Top three noisy pixels from each quadrant. If the there are fewer than three noisy pixels in the level2.evt file, extra rows are filled as -1
| Pixel properties | Quadrant properties | ||||||
|---|---|---|---|---|---|---|---|
| Quadrant | DetID | PixID | Counts | Sigma | Mean | Median | Sigma |
| A | 0 | 226 | 7905 | 41.86 | 831 | 814 | 169.4 |
| A | 12 | 194 | 7894 | 41.79 | 831 | 814 | 169.4 |
| A | 7 | 16 | 3978 | 18.68 | 831 | 814 | 169.4 |
| B | 15 | 204 | 122228 | 764.44 | 846 | 826 | 158.8 |
| B | 4 | 81 | 56919 | 353.21 | 846 | 826 | 158.8 |
| B | 12 | 111 | 15198 | 90.5 | 846 | 826 | 158.8 |
| C | 9 | 160 | 11938 | 58.74 | 824 | 827 | 189.2 |
| C | 13 | 61 | 6643 | 30.74 | 824 | 827 | 189.2 |
| C | 9 | 176 | 5316 | 23.73 | 824 | 827 | 189.2 |
| D | 8 | 195 | 46995 | 231.36 | 814 | 789 | 199.7 |
| D | 2 | 206 | 24076 | 116.6 | 814 | 789 | 199.7 |
| D | 6 | 223 | 20555 | 98.97 | 814 | 789 | 199.7 |
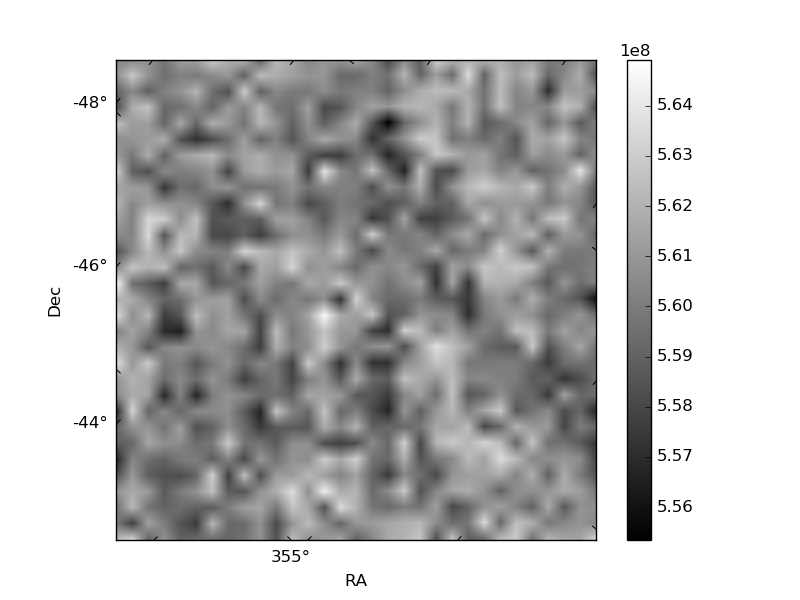
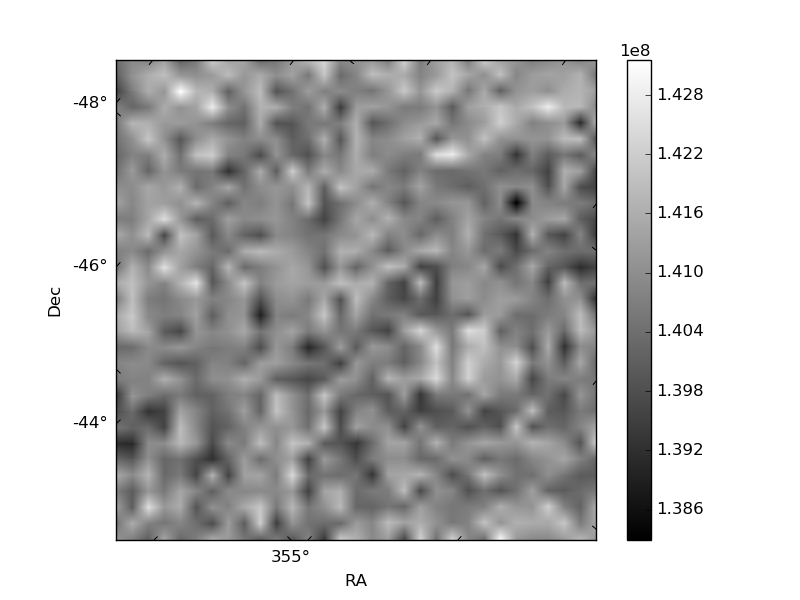
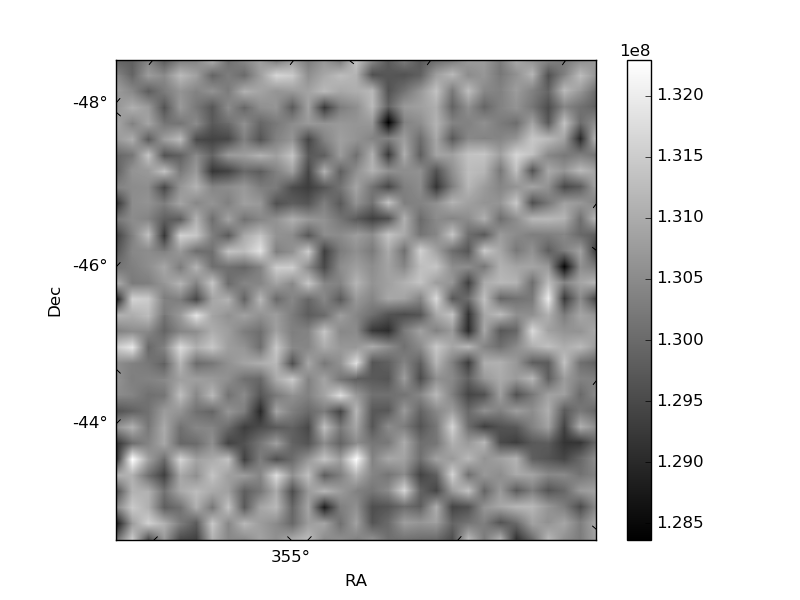
Histogram calculated using DETX and DETY for each event in the final _common_clean file
| Quadrant A | 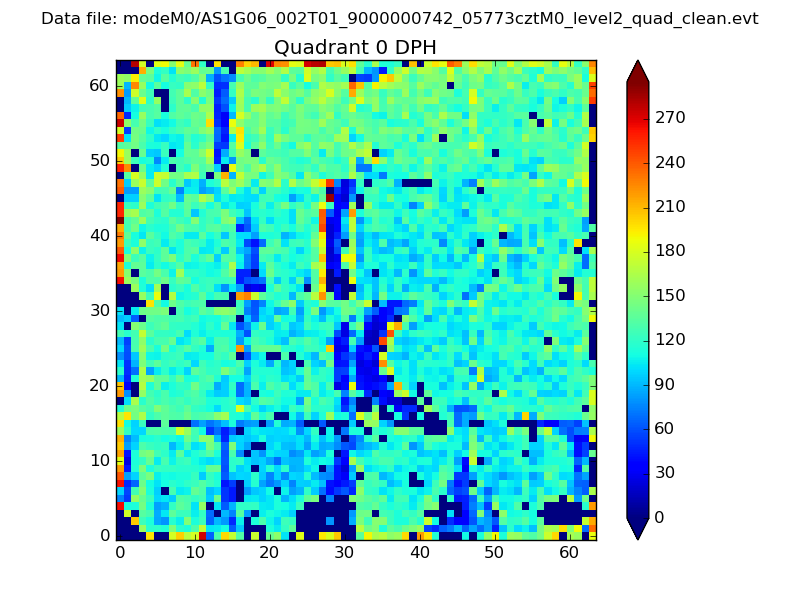 |
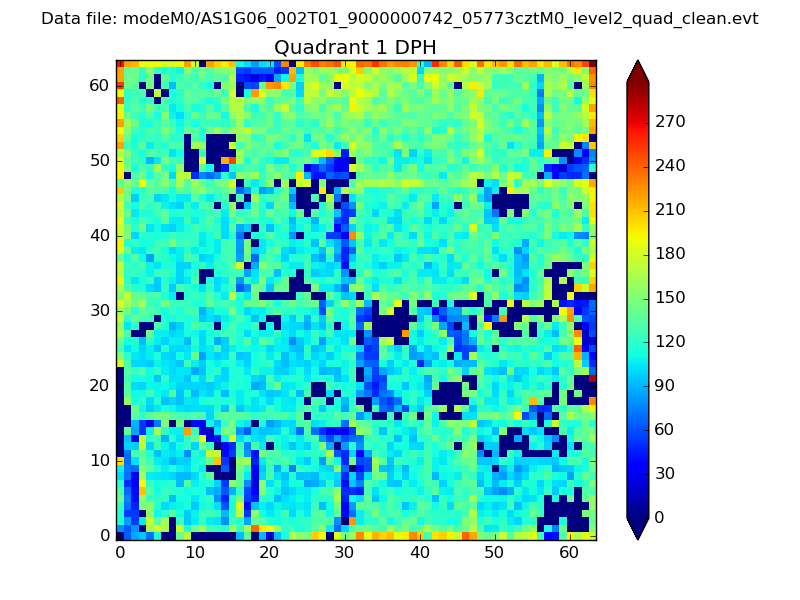 |
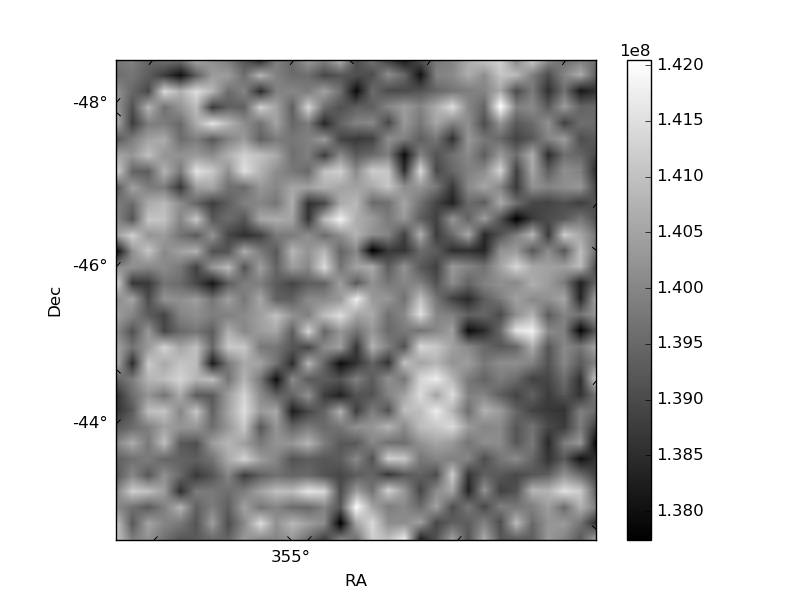
Quadrant B |
|---|---|---|---|
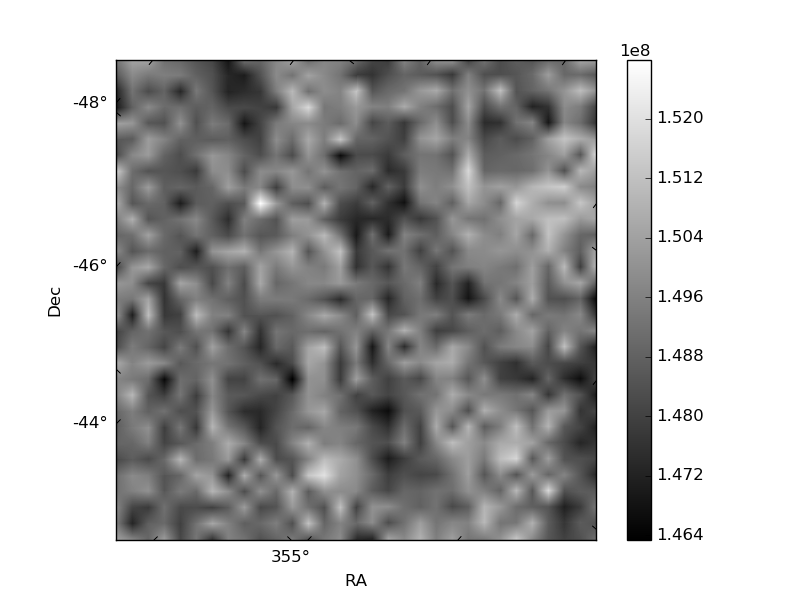
| Quadrant D | 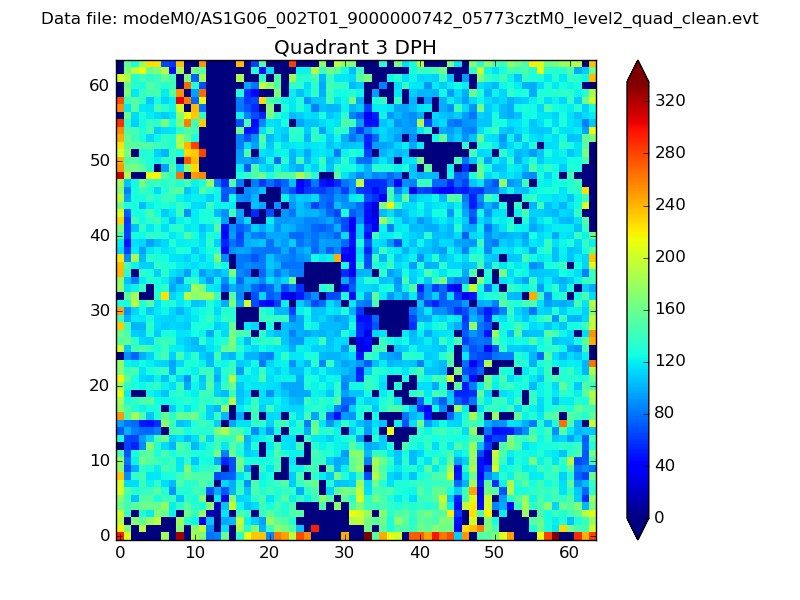 |
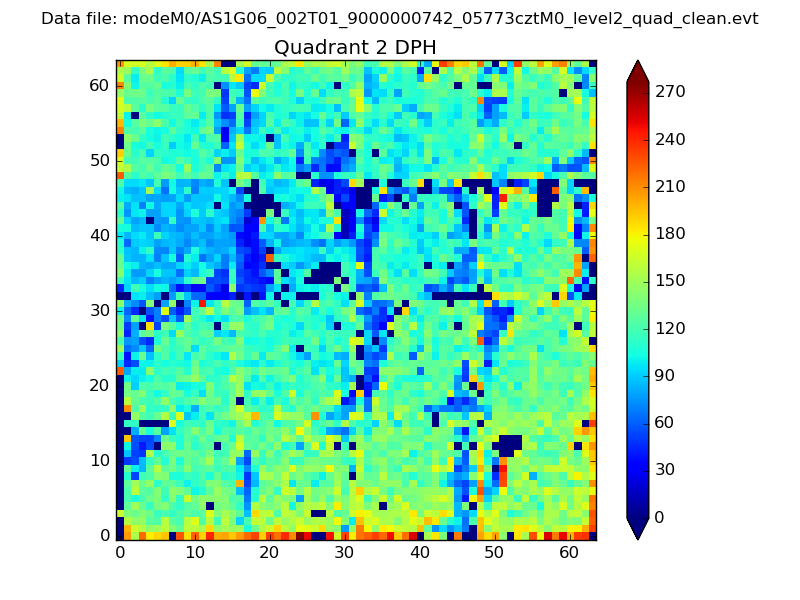 |
Quadrant C |
| Plot type | Count rate plots | Images |
|---|---|---|
| Comparison with Poisson distribution Blue bars denote a histogram of data divided into 1 sec bins. Red curve is a Poisson curve with rate = median count rate of data. |
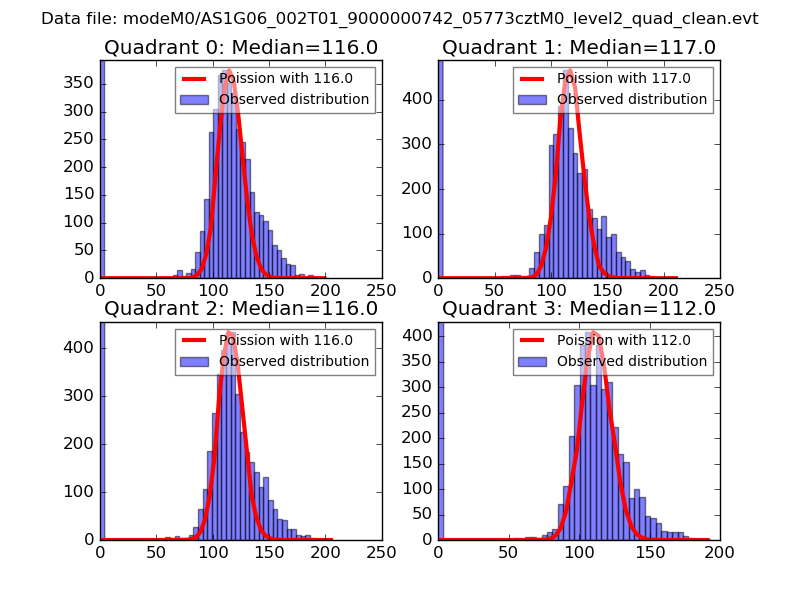 |
 |
| Quadrant-wise count rates Data is divided into 100 sec bins |
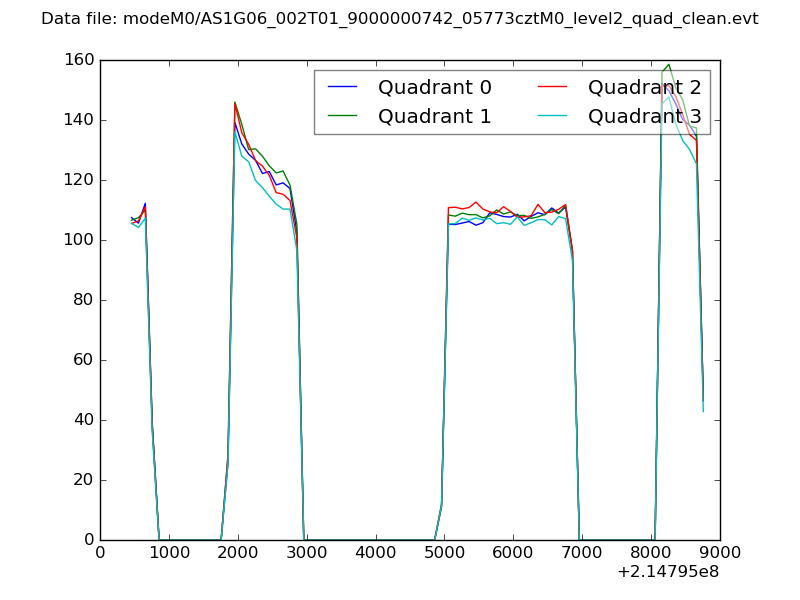 |
|
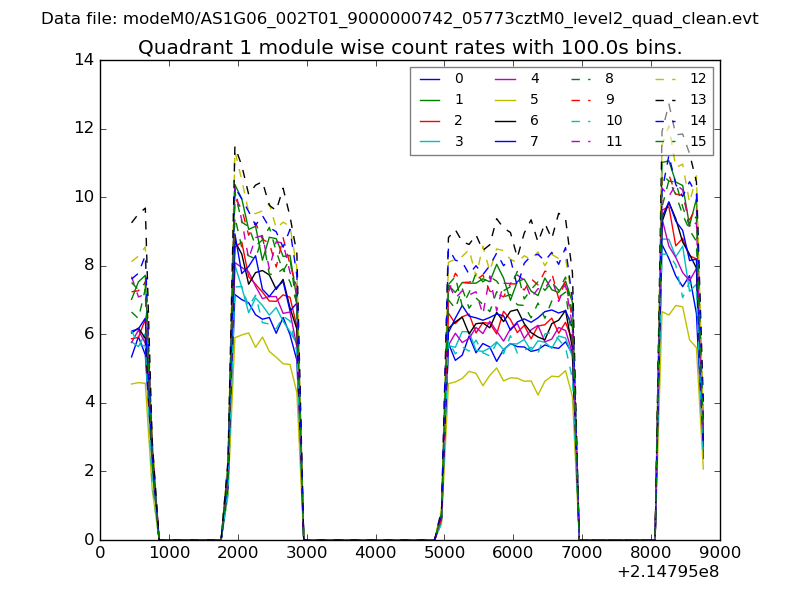
| Module-wise count rates for Quadrant A Data is divided into 100 sec bins |
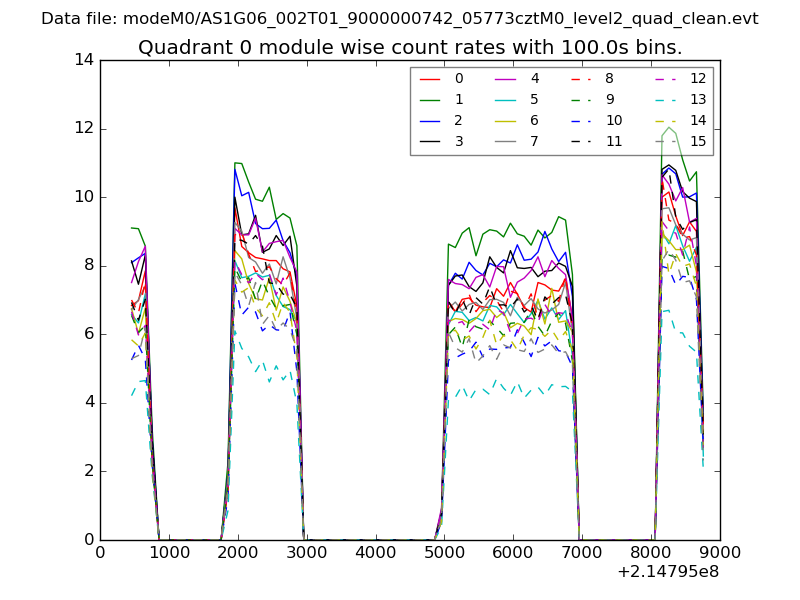 |
 |
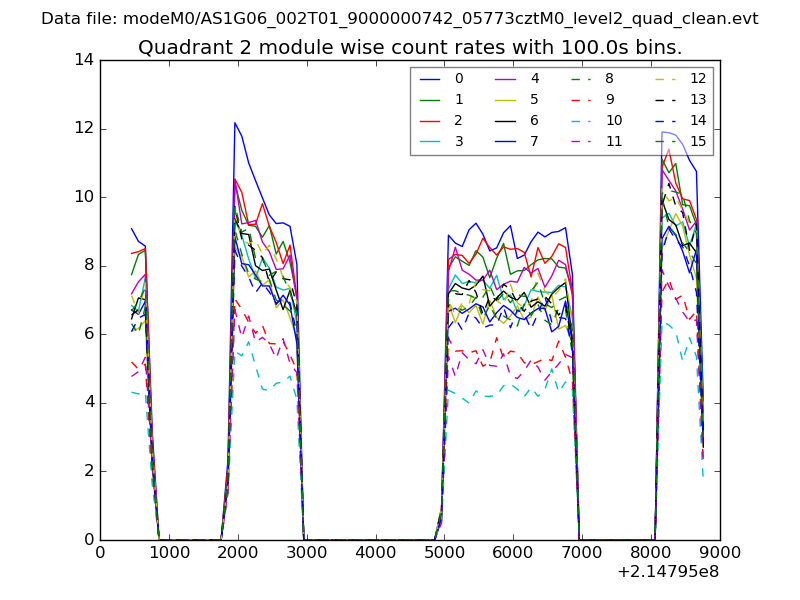
| Module-wise count rates for Quadrant B Data is divided into 100 sec bins |
 |
 |
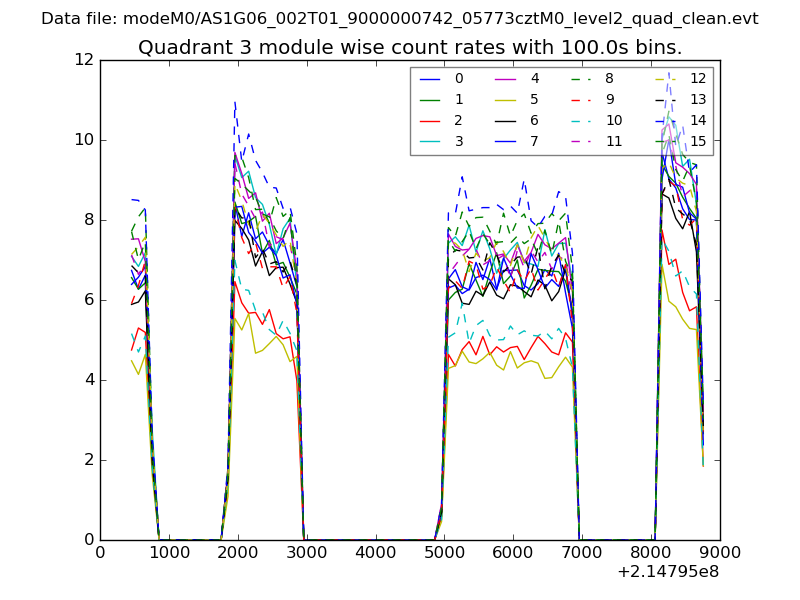
| Module-wise count rates for Quadrant C Data is divided into 100 sec bins |
 |
 |
| Module-wise count rates for Quadrant D Data is divided into 100 sec bins |
 |
 |
| Parameter | Plot |
|---|---|
| CZT HV Monitor | 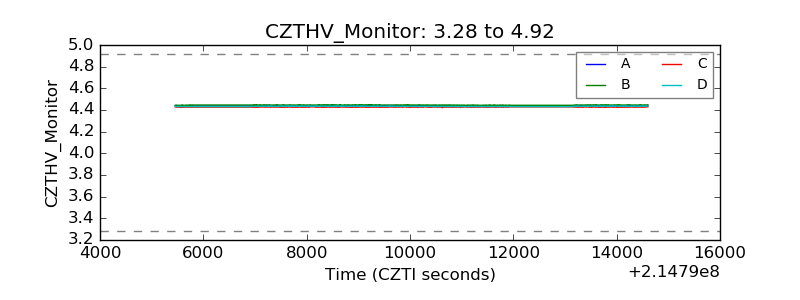 |
| D_VDD |  |
| Temperature 1 |  |
| Veto HV Monitor | 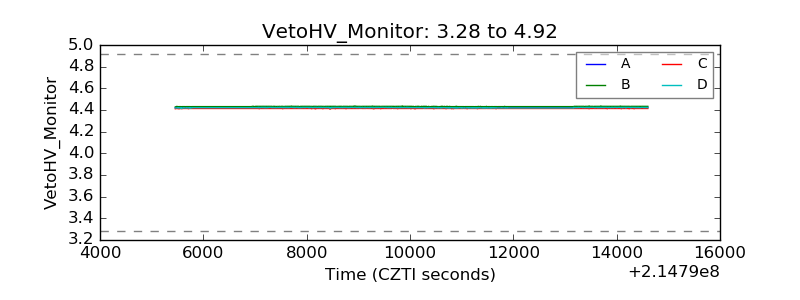 |
| Veto LLD | 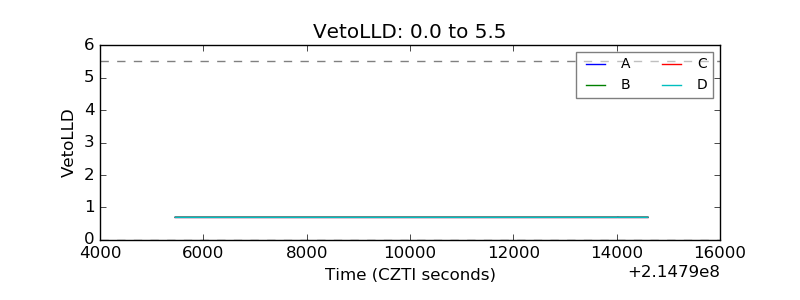 |
| Alpha Counter | 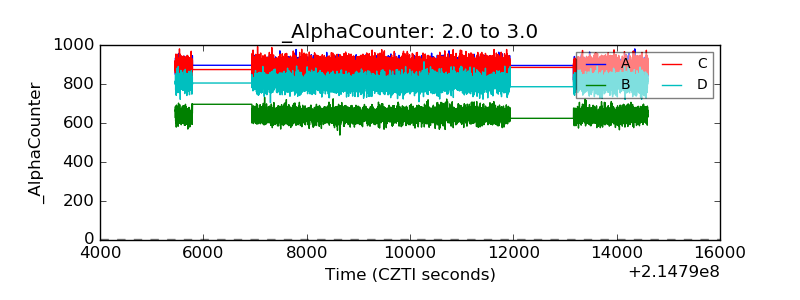 |
| _CPM_Rate | 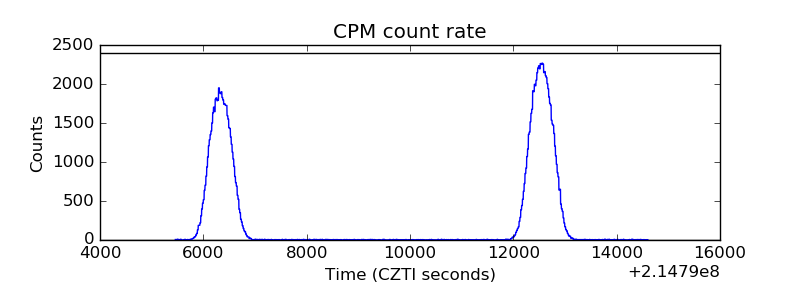 |
| CZT Counter | 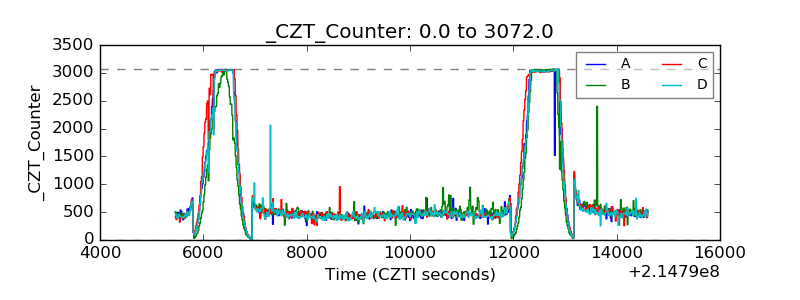 |
| +2.5 Volts monitor | 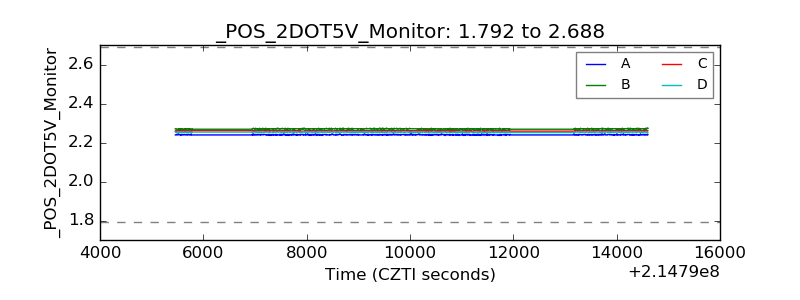 |
| +5 Volts monitor |  |
| _ROLL_ROT | 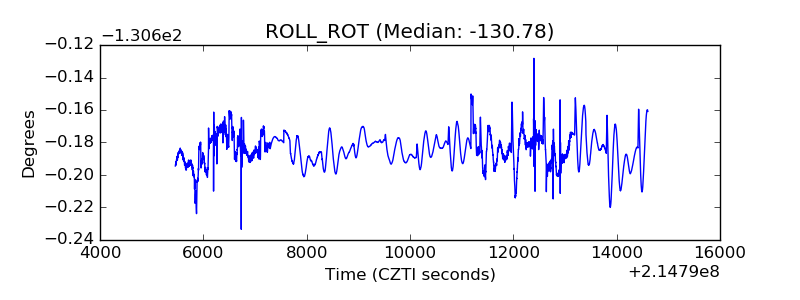 |
| _Roll_DEC | 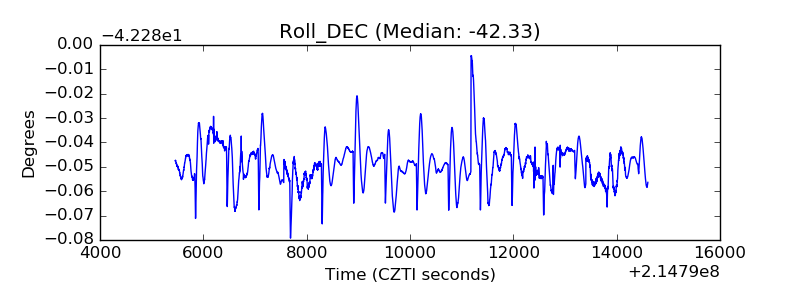 |
| _Roll_RA | 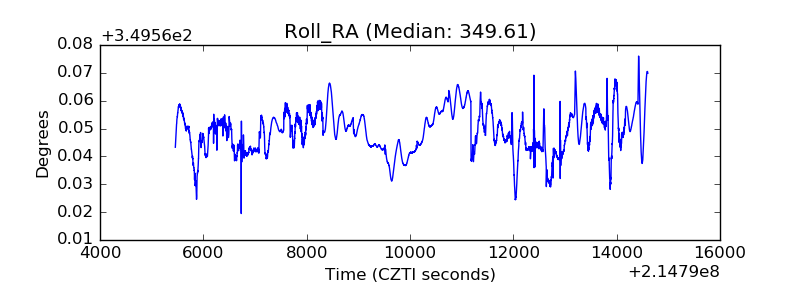 |
| Veto Counter | 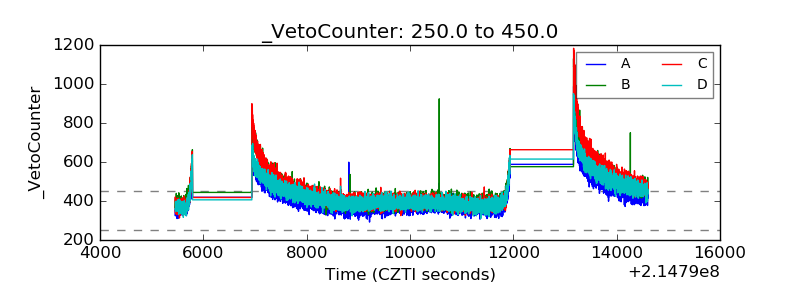 |