| Param | Original file | Final file |
|---|---|---|
| Filename | modeM0/AS1G06_002T01_9000000742_05774cztM0_level2.evt | modeM0/AS1G06_002T01_9000000742_05774cztM0_level2_quad_clean.evt |
| Size (bytes) | 433,592,640 | 63,000,000 |
| Size | 413.5 MB | 60.1 MB |
| Events in quadrant A | 3,014,173 | 367,597 |
| Events in quadrant B | 3,415,326 | 376,743 |
| Events in quadrant C | 3,061,948 | 376,547 |
| Events in quadrant D | 3,221,519 | 357,063 |
| Mode M0 | |||
|---|---|---|---|
| Quadrant | BADHDUFLAG | Total packets | Discarded packets |
| A | 0 | 13077 | 296 |
| B | 0 | 14205 | 327 |
| C | 0 | 13237 | 259 |
| D | 0 | 13778 | 315 |
| Mode M9 | |||
|---|---|---|---|
| Quadrant | BADHDUFLAG | Total packets | Discarded packets |
| A | 0 | 19 | 0 |
| B | 0 | 19 | 0 |
| C | 0 | 19 | 0 |
| D | 0 | 20 | 0 |
| Mode SS | |||
|---|---|---|---|
| Quadrant | BADHDUFLAG | Total packets | Discarded packets |
| A | 0 | 126 | 2 |
| B | 0 | 126 | 2 |
| C | 0 | 126 | 4 |
| D | 0 | 126 | 0 |
| Quadrant | Total seconds | Saturated seconds | Saturation percentage |
|---|---|---|---|
| A | 6153 | 28 | 0.455063% |
| B | 6145 | 72 | 1.171684% |
| C | 6171 | 39 | 0.631988% |
| D | 6149 | 82 | 1.333550% |
Noise dominated data is calculated using 1-second bins in cleaned event files. If a bin has >2000 counts, and if more than 50% of those come from <1% of pixels, then it is considered to be noise-dominated and hence unusable.
| Quadrant | # 1 sec bins | Bins with >0 counts | Bins with >2000 counts | High rate bins dominated by noise | Noise dominated (total time) | Noise dominated (detector-on time) | Marked lightcurve |
|---|---|---|---|---|---|---|---|
| A | 7623 | 6255 | 0 | 0 | 0.00% | 0.00% | 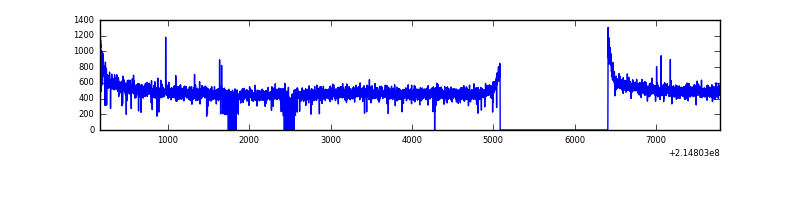 |
| B | 7623 | 6254 | 10 | 10 | 0.13% | 0.16% | 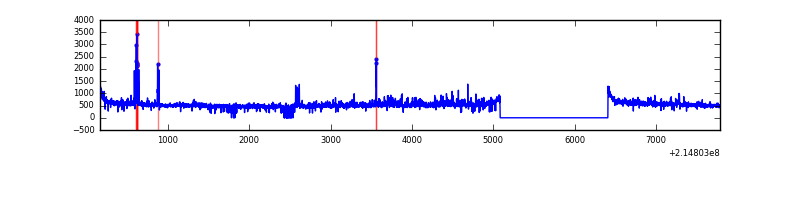 |
| C | 7623 | 6255 | 0 | 0 | 0.00% | 0.00% |  |
| D | 7623 | 6268 | 40 | 40 | 0.52% | 0.64% | 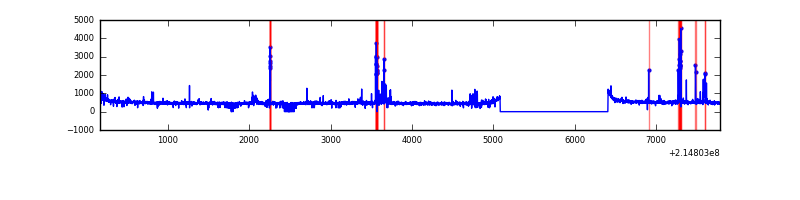 |
Top three noisy pixels from each quadrant. If the there are fewer than three noisy pixels in the level2.evt file, extra rows are filled as -1
| Pixel properties | Quadrant properties | ||||||
|---|---|---|---|---|---|---|---|
| Quadrant | DetID | PixID | Counts | Sigma | Mean | Median | Sigma |
| A | 0 | 226 | 7460 | 42.68 | 783 | 767 | 156.8 |
| A | 12 | 194 | 7412 | 42.37 | 783 | 767 | 156.8 |
| A | 7 | 16 | 4130 | 21.44 | 783 | 767 | 156.8 |
| B | 15 | 204 | 184791 | 1248.5 | 796 | 782 | 147.4 |
| B | 4 | 81 | 92064 | 619.35 | 796 | 782 | 147.4 |
| B | 0 | 219 | 54443 | 364.09 | 796 | 782 | 147.4 |
| C | 9 | 160 | 9202 | 47.1 | 780 | 784 | 178.7 |
| C | 13 | 61 | 6327 | 31.01 | 780 | 784 | 178.7 |
| C | 7 | 236 | 4242 | 19.35 | 780 | 784 | 178.7 |
| D | 4 | 95 | 144900 | 773.53 | 767 | 744 | 186.4 |
| D | 2 | 136 | 59622 | 315.93 | 767 | 744 | 186.4 |
| D | 8 | 195 | 34145 | 179.23 | 767 | 744 | 186.4 |
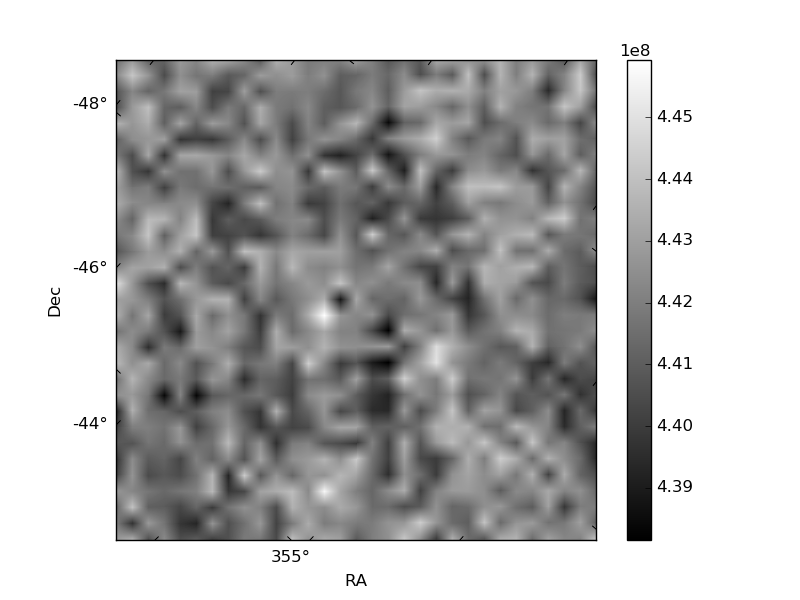
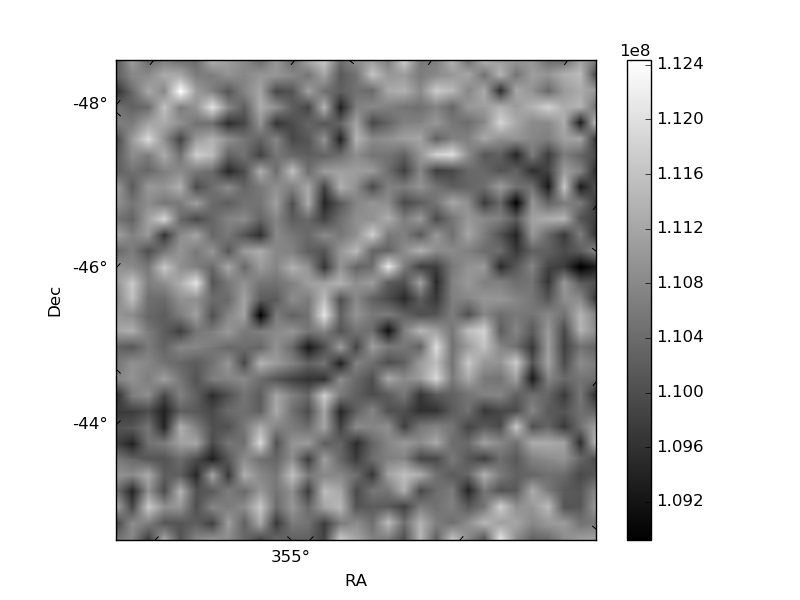
Histogram calculated using DETX and DETY for each event in the final _common_clean file
| Quadrant A | 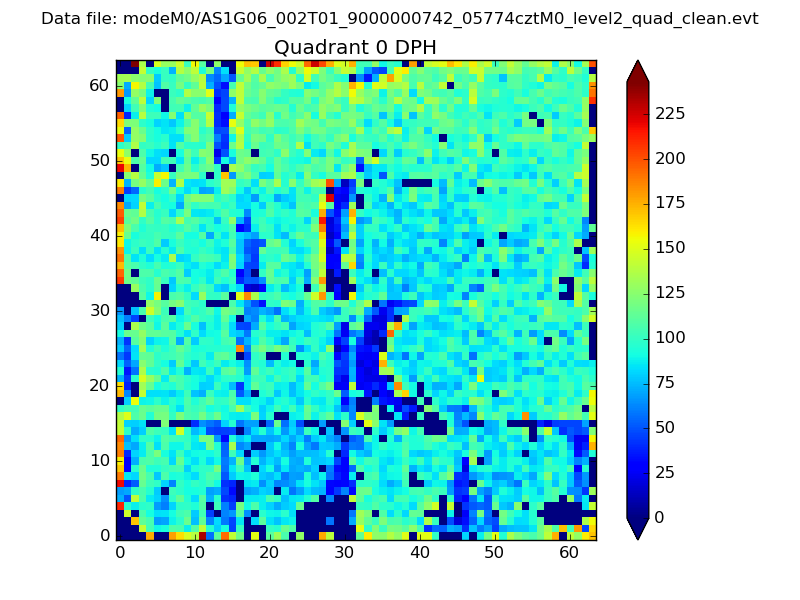 |
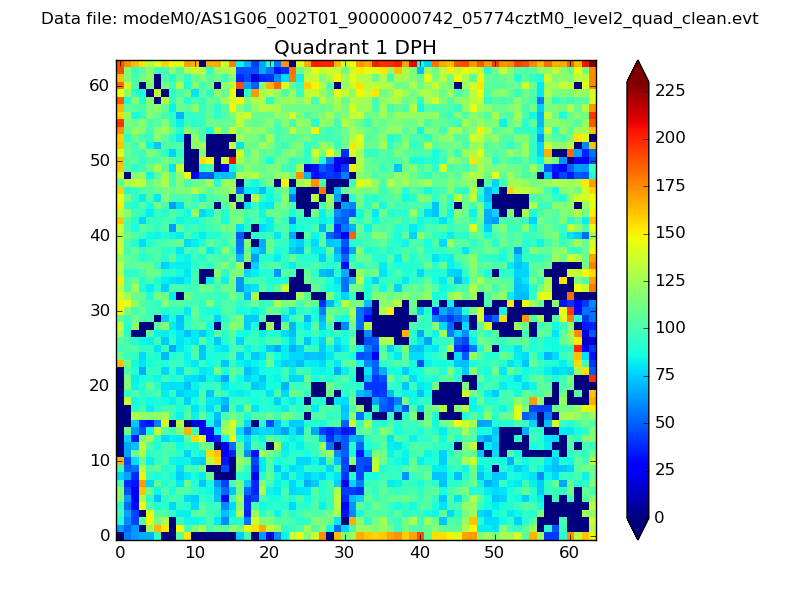 |
Quadrant B |
|---|---|---|---|
| Quadrant D | 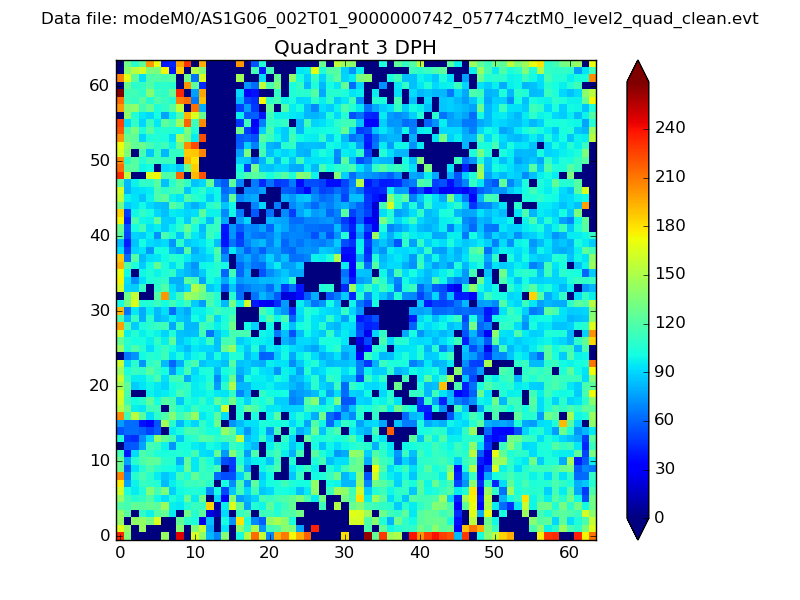 |
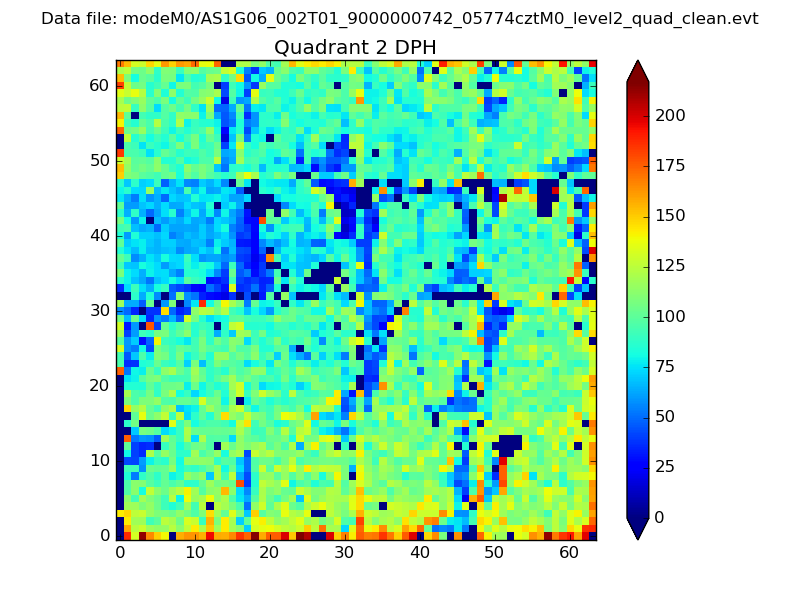 |
Quadrant C |
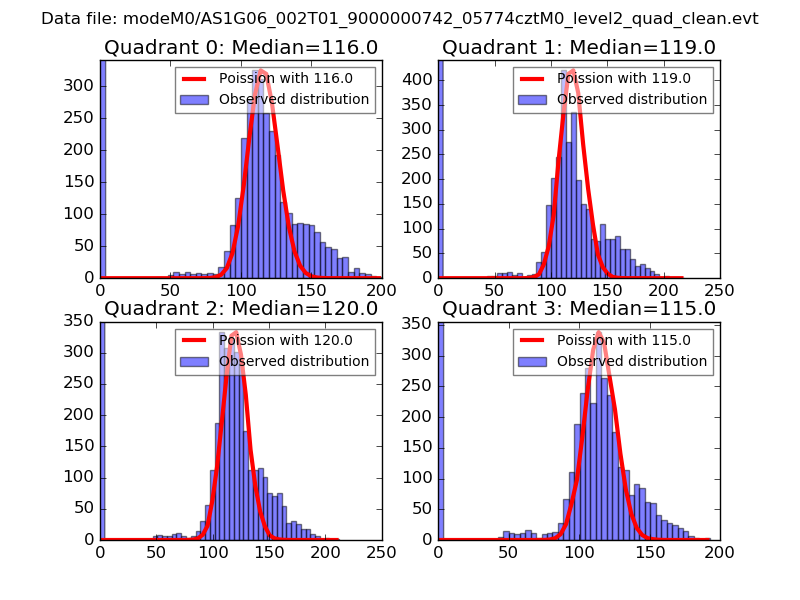
| Plot type | Count rate plots | Images |
|---|---|---|
| Comparison with Poisson distribution Blue bars denote a histogram of data divided into 1 sec bins. Red curve is a Poisson curve with rate = median count rate of data. |
 |
 |
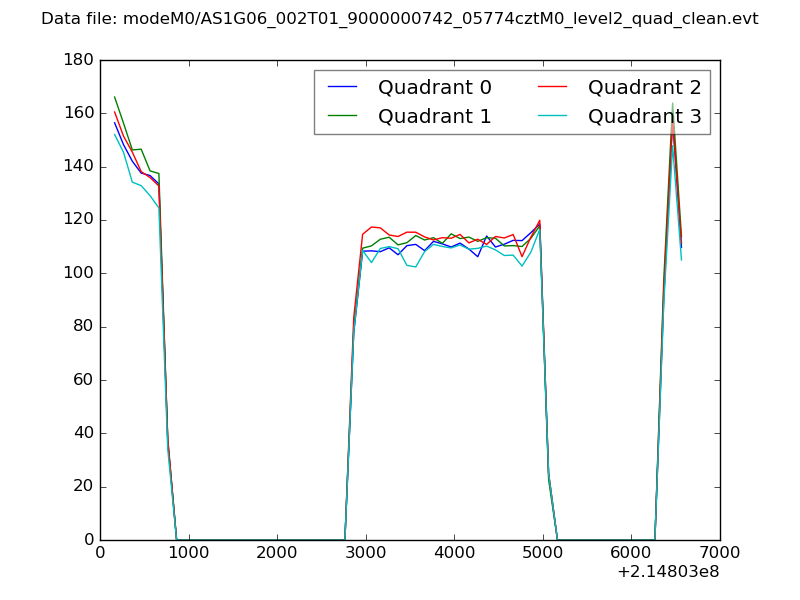
| Quadrant-wise count rates Data is divided into 100 sec bins |
 |
|
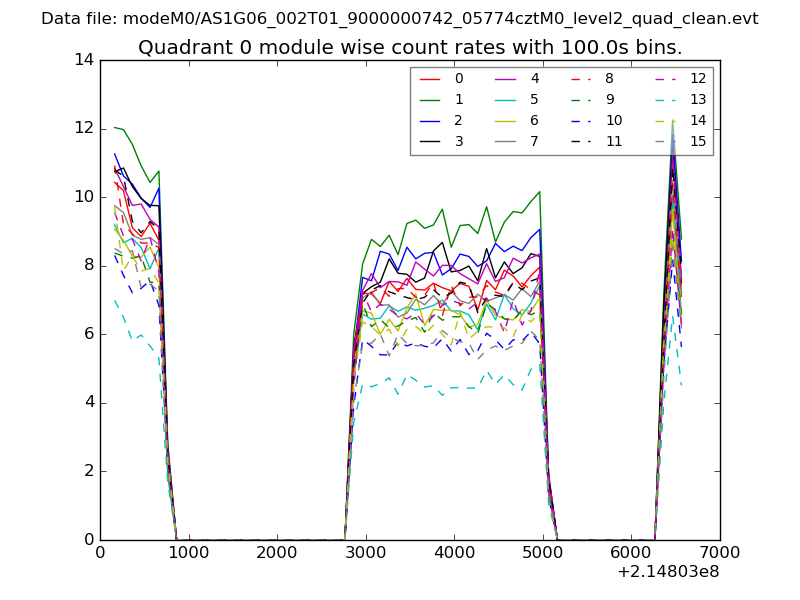
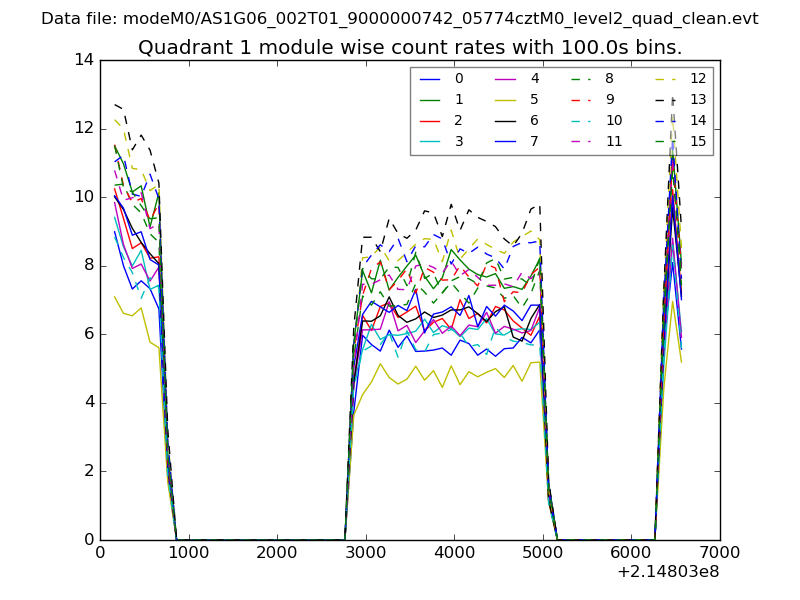
| Module-wise count rates for Quadrant A Data is divided into 100 sec bins |
 |
 |
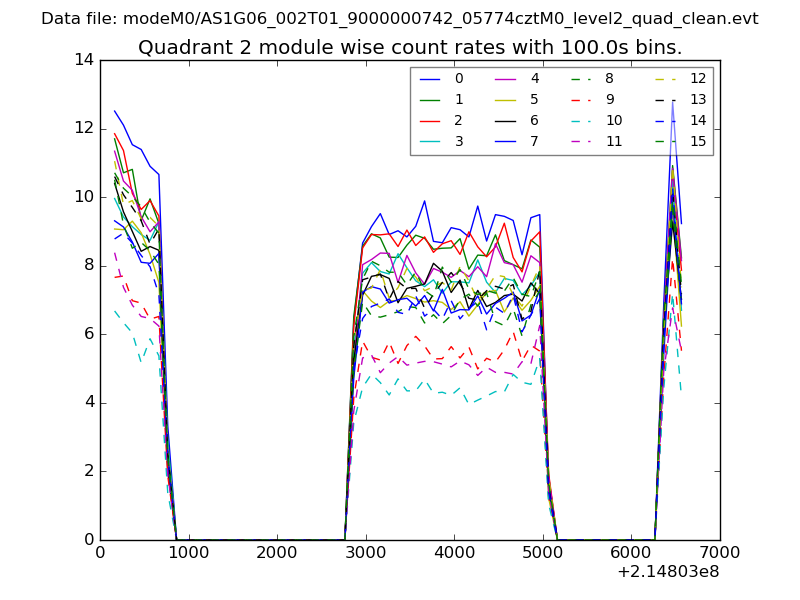
| Module-wise count rates for Quadrant B Data is divided into 100 sec bins |
 |
 |
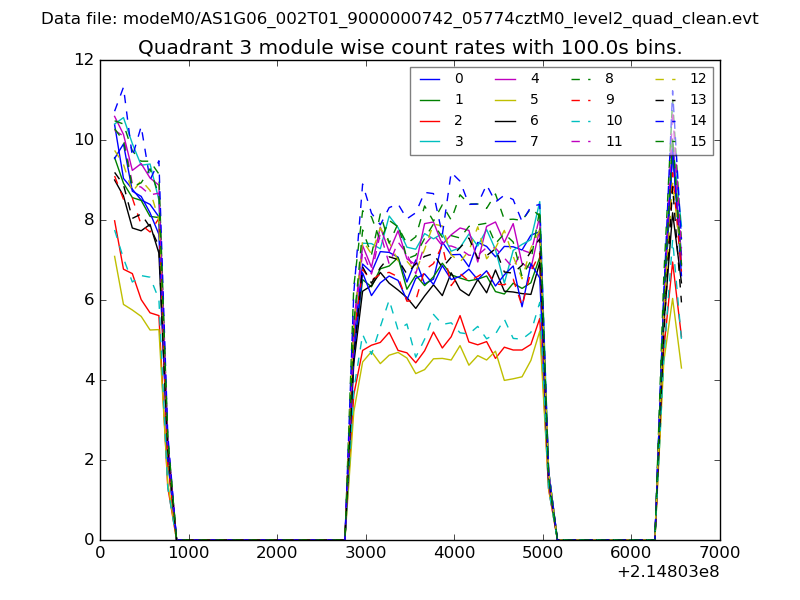
| Module-wise count rates for Quadrant C Data is divided into 100 sec bins |
 |
 |
| Module-wise count rates for Quadrant D Data is divided into 100 sec bins |
 |
 |
| Parameter | Plot |
|---|---|
| CZT HV Monitor | 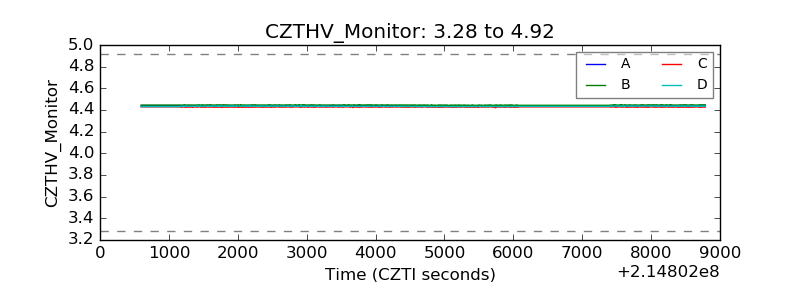 |
| D_VDD | 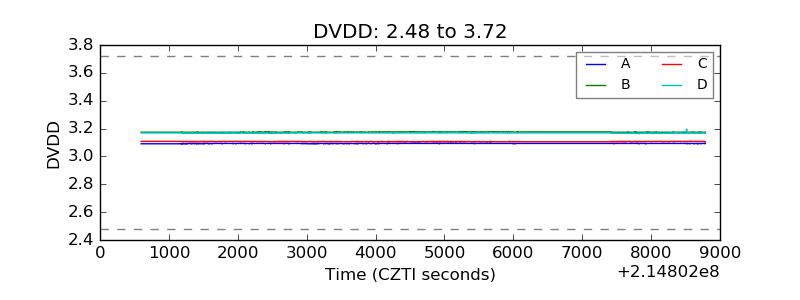 |
| Temperature 1 | 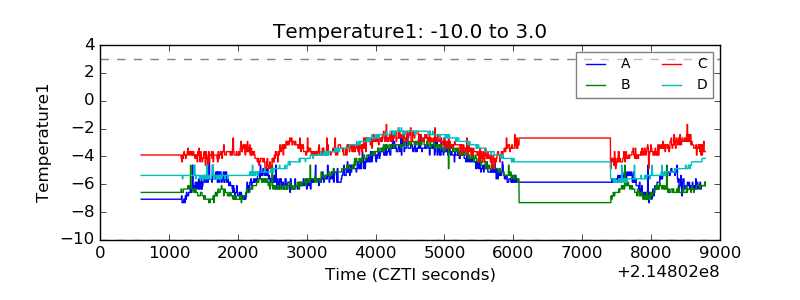 |
| Veto HV Monitor | 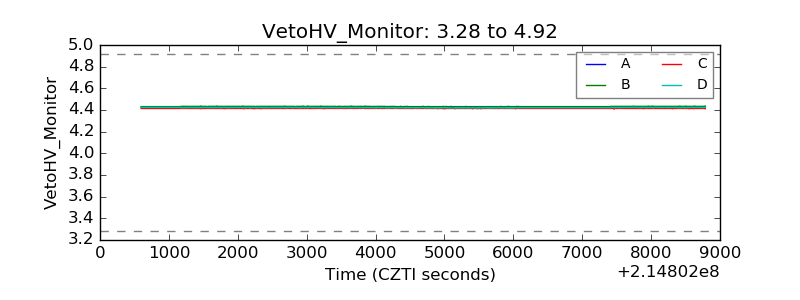 |
| Veto LLD | 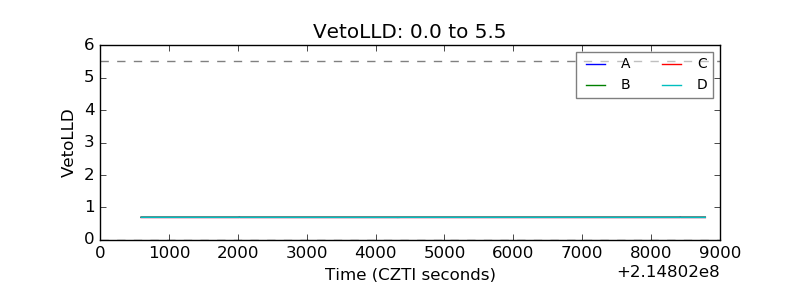 |
| Alpha Counter | 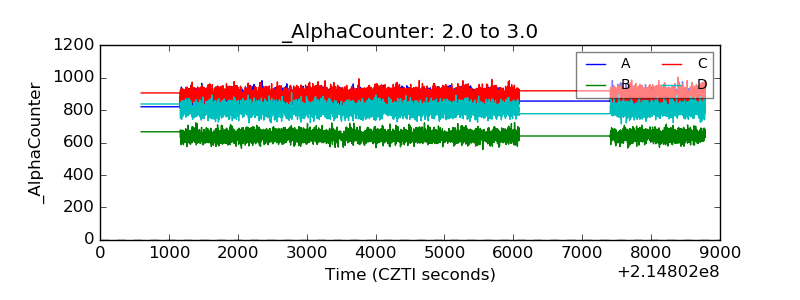 |
| _CPM_Rate | 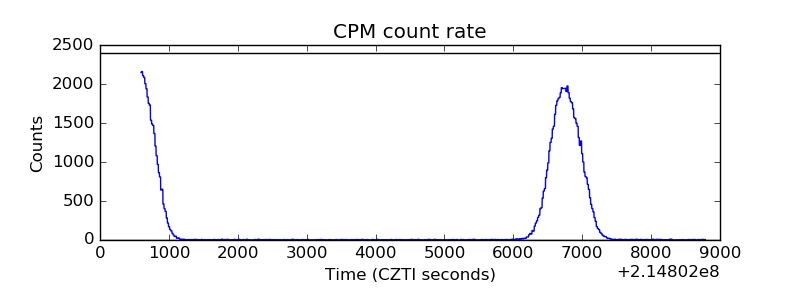 |
| CZT Counter | 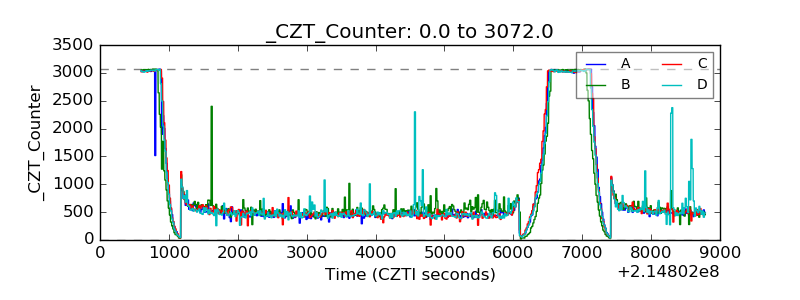 |
| +2.5 Volts monitor |  |
| +5 Volts monitor |  |
| _ROLL_ROT | 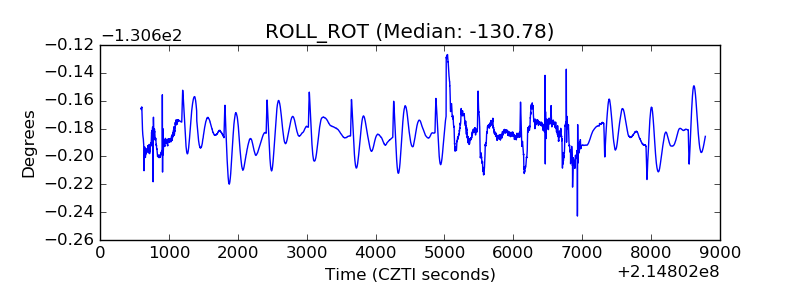 |
| _Roll_DEC |  |
| _Roll_RA | 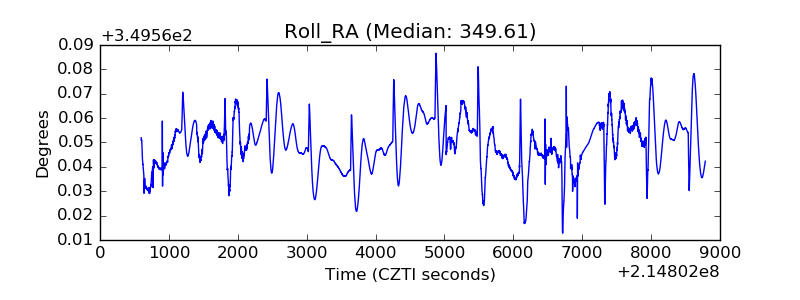 |
| Veto Counter | 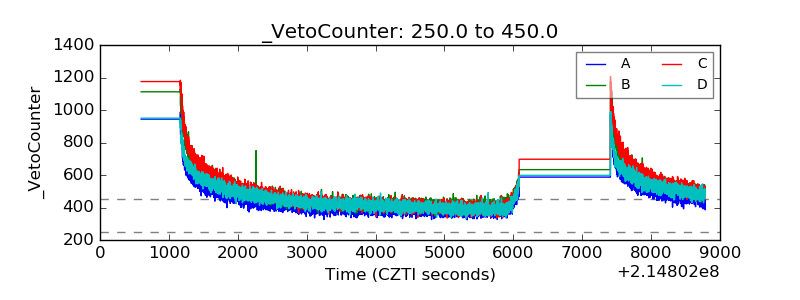 |