| Param | Original file | Final file |
|---|---|---|
| Filename | modeM0/AS1G06_002T01_9000000742_05775cztM0_level2.evt | modeM0/AS1G06_002T01_9000000742_05775cztM0_level2_quad_clean.evt |
| Size (bytes) | 437,904,000 | 58,250,880 |
| Size | 417.6 MB | 55.6 MB |
| Events in quadrant A | 3,061,892 | 333,104 |
| Events in quadrant B | 3,337,626 | 337,869 |
| Events in quadrant C | 3,073,751 | 338,888 |
| Events in quadrant D | 3,369,646 | 323,128 |
| Mode M0 | |||
|---|---|---|---|
| Quadrant | BADHDUFLAG | Total packets | Discarded packets |
| A | 0 | 12833 | 5 |
| B | 0 | 13545 | 2 |
| C | 0 | 12923 | 2 |
| D | 0 | 13748 | 2 |
| Mode M9 | |||
|---|---|---|---|
| Quadrant | BADHDUFLAG | Total packets | Discarded packets |
| A | 0 | 16 | 0 |
| B | 0 | 16 | 0 |
| C | 0 | 16 | 0 |
| D | 0 | 17 | 0 |
| Mode SS | |||
|---|---|---|---|
| Quadrant | BADHDUFLAG | Total packets | Discarded packets |
| A | 0 | 126 | 0 |
| B | 0 | 126 | 0 |
| C | 0 | 126 | 0 |
| D | 0 | 126 | 0 |
| Quadrant | Total seconds | Saturated seconds | Saturation percentage |
|---|---|---|---|
| A | 6163 | 75 | 1.216940% |
| B | 6164 | 96 | 1.557430% |
| C | 6164 | 74 | 1.200519% |
| D | 6164 | 111 | 1.800779% |
Noise dominated data is calculated using 1-second bins in cleaned event files. If a bin has >2000 counts, and if more than 50% of those come from <1% of pixels, then it is considered to be noise-dominated and hence unusable.
| Quadrant | # 1 sec bins | Bins with >0 counts | Bins with >2000 counts | High rate bins dominated by noise | Noise dominated (total time) | Noise dominated (detector-on time) | Marked lightcurve |
|---|---|---|---|---|---|---|---|
| A | 7489 | 6165 | 0 | 0 | 0.00% | 0.00% | 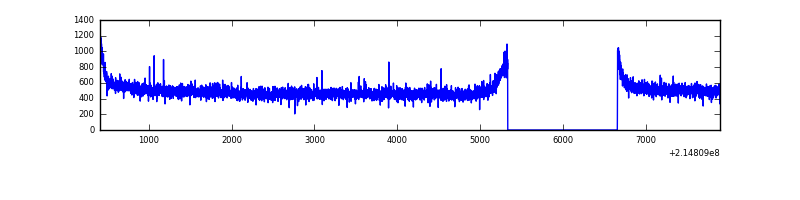 |
| B | 7489 | 6165 | 0 | 0 | 0.00% | 0.00% | 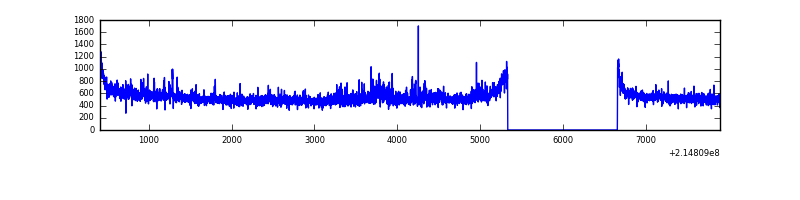 |
| C | 7489 | 6165 | 0 | 0 | 0.00% | 0.00% | 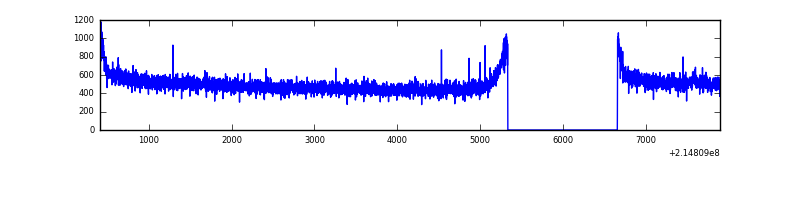 |
| D | 7489 | 6165 | 36 | 36 | 0.48% | 0.58% | 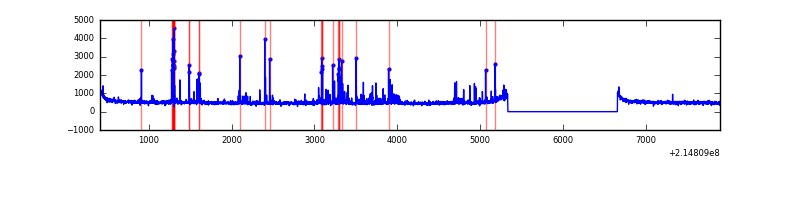 |
Top three noisy pixels from each quadrant. If the there are fewer than three noisy pixels in the level2.evt file, extra rows are filled as -1
| Pixel properties | Quadrant properties | ||||||
|---|---|---|---|---|---|---|---|
| Quadrant | DetID | PixID | Counts | Sigma | Mean | Median | Sigma |
| A | 12 | 194 | 7677 | 42.99 | 796 | 780 | 160.5 |
| A | 0 | 226 | 7488 | 41.81 | 796 | 780 | 160.5 |
| A | 13 | 254 | 2748 | 12.27 | 796 | 780 | 160.5 |
| B | 15 | 204 | 134841 | 888.8 | 806 | 790 | 150.8 |
| B | 0 | 219 | 67155 | 440.02 | 806 | 790 | 150.8 |
| B | 4 | 81 | 18193 | 115.39 | 806 | 790 | 150.8 |
| C | 13 | 61 | 6346 | 30.98 | 786 | 792 | 179.3 |
| C | 1 | 16 | 5768 | 27.75 | 786 | 792 | 179.3 |
| C | 8 | 222 | 1987 | 6.66 | 786 | 792 | 179.3 |
| D | 4 | 95 | 279588 | 1476.92 | 780 | 758 | 188.8 |
| D | 12 | 221 | 54705 | 285.75 | 780 | 758 | 188.8 |
| D | 2 | 136 | 28537 | 147.14 | 780 | 758 | 188.8 |
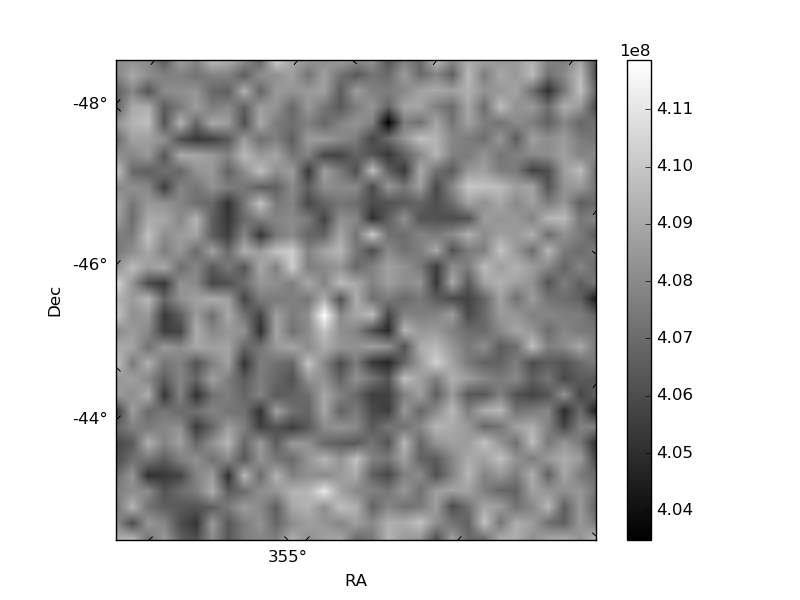
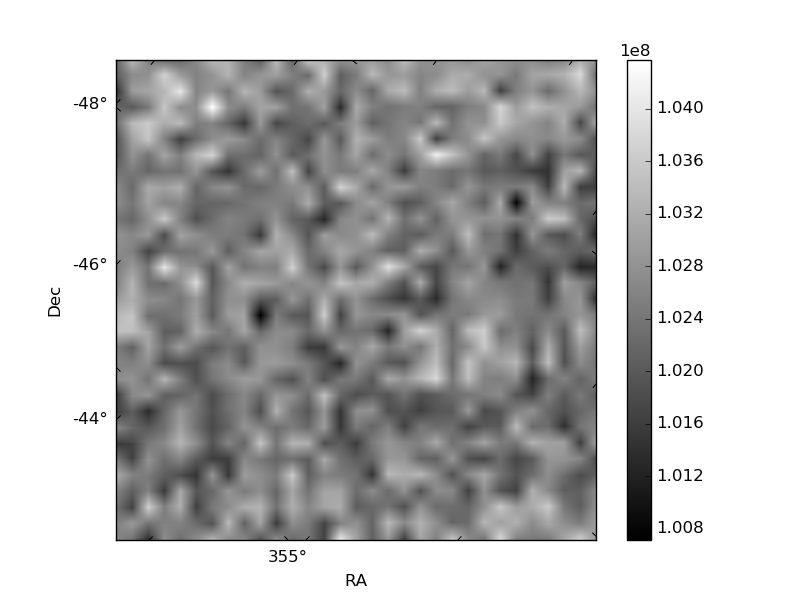
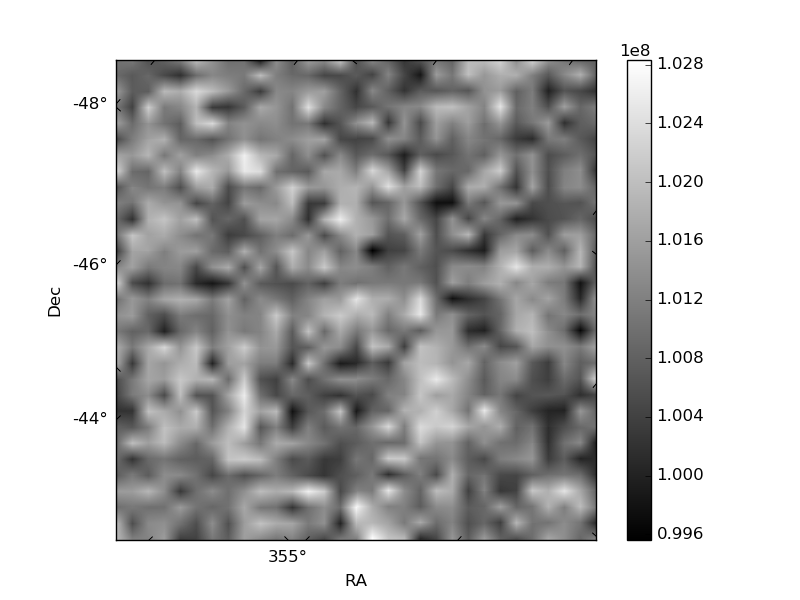
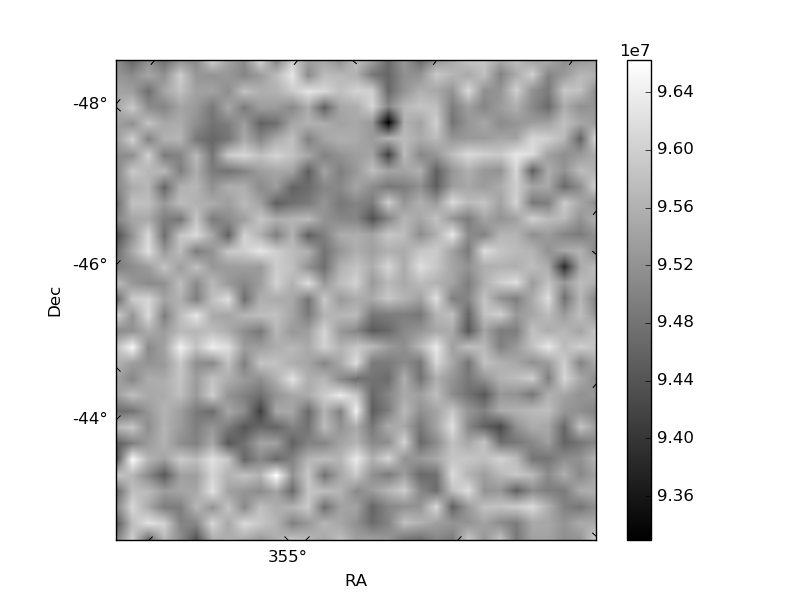
Histogram calculated using DETX and DETY for each event in the final _common_clean file
| Quadrant A | 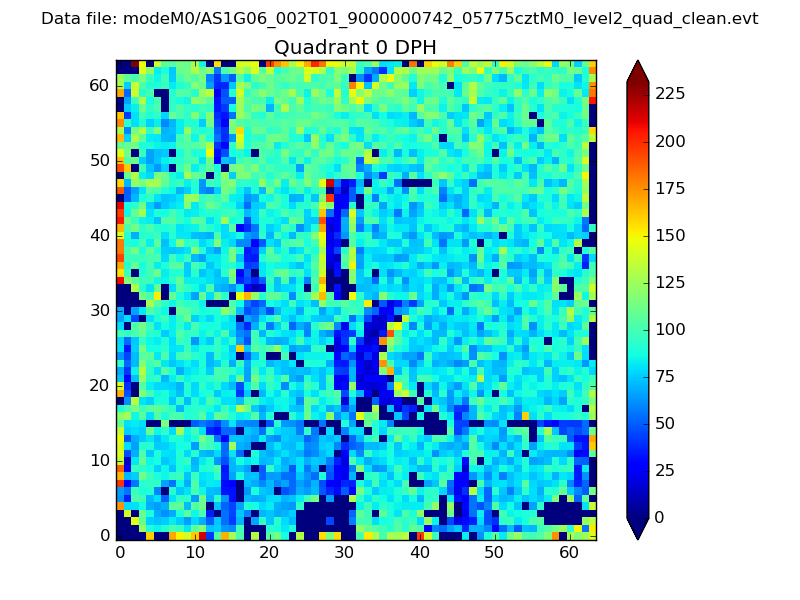 |
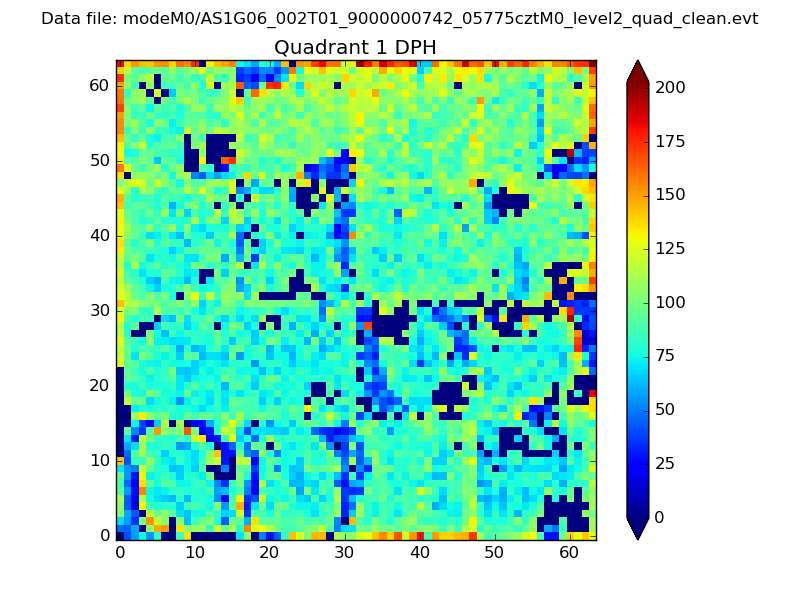 |
Quadrant B |
|---|---|---|---|
| Quadrant D | 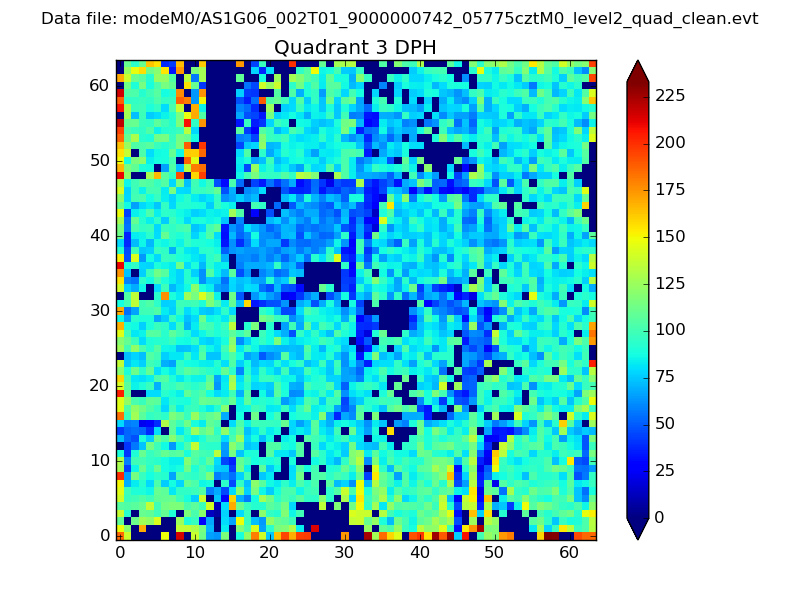 |
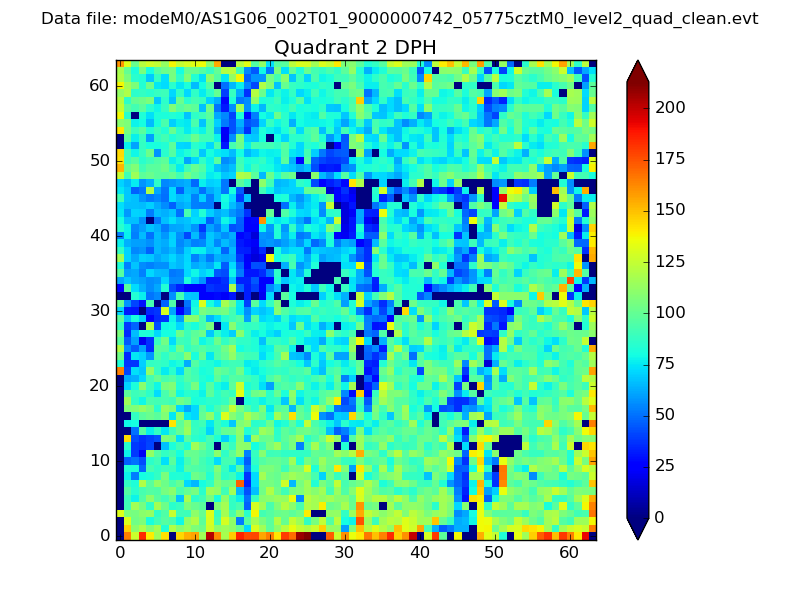 |
Quadrant C |
| Plot type | Count rate plots | Images |
|---|---|---|
| Comparison with Poisson distribution Blue bars denote a histogram of data divided into 1 sec bins. Red curve is a Poisson curve with rate = median count rate of data. |
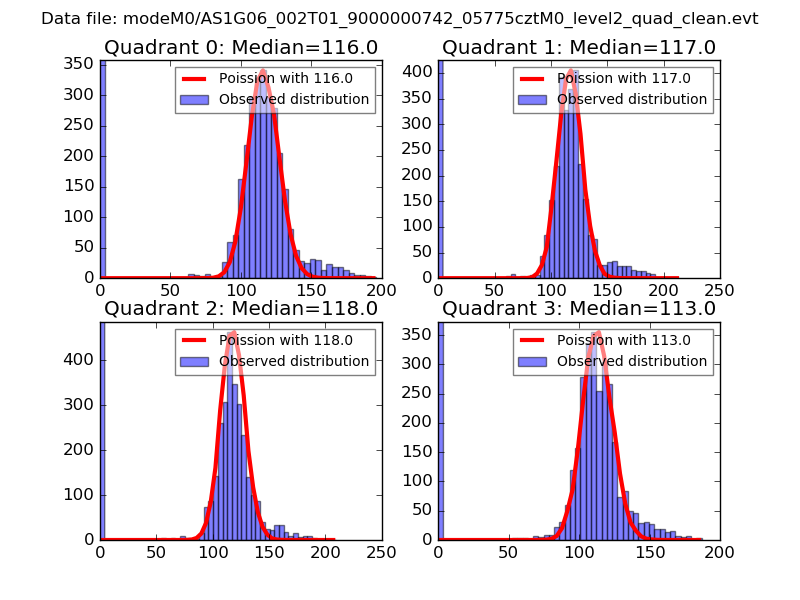 |
 |
| Quadrant-wise count rates Data is divided into 100 sec bins |
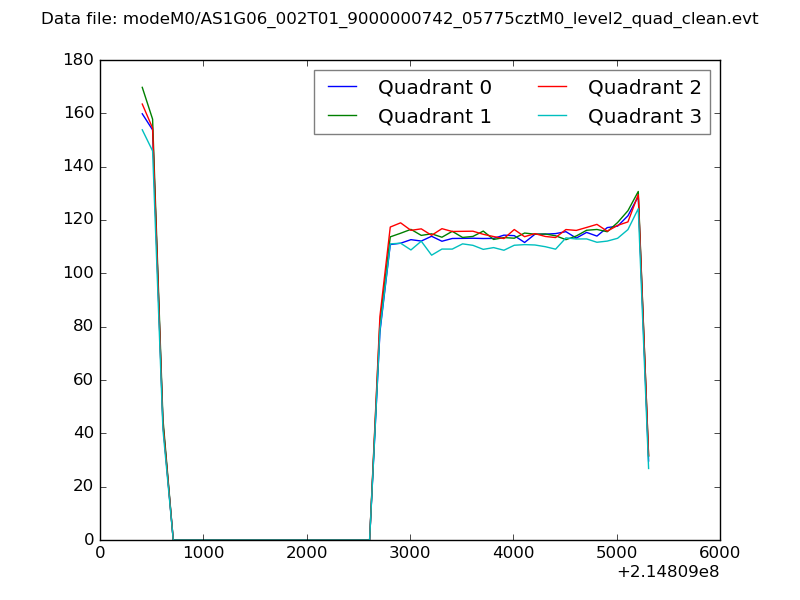 |
|
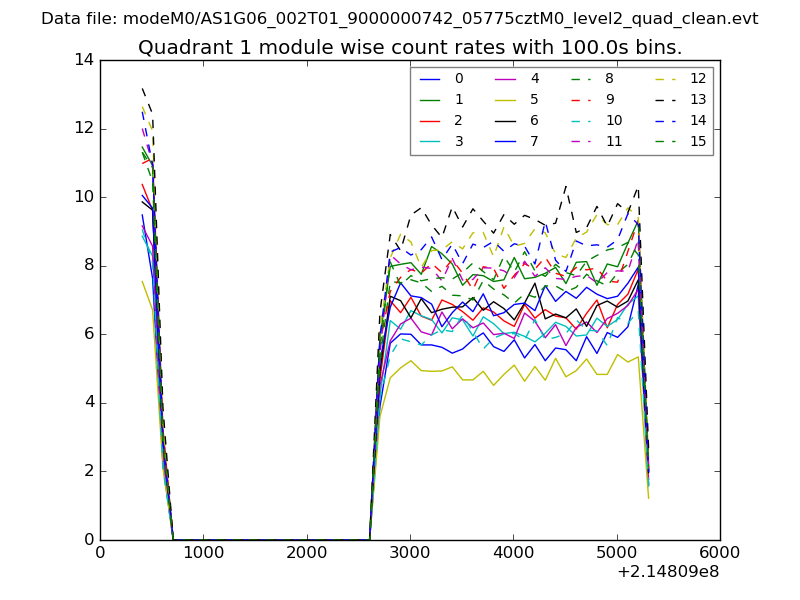
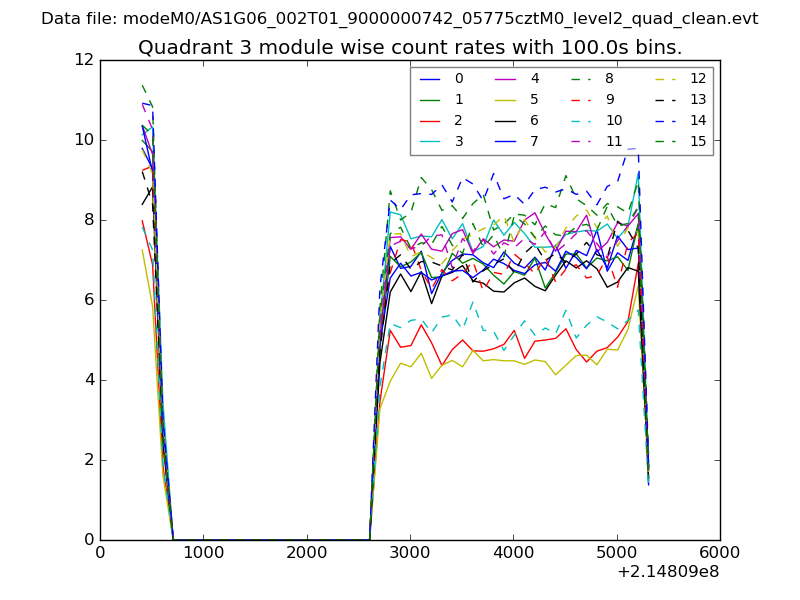
| Module-wise count rates for Quadrant A Data is divided into 100 sec bins |
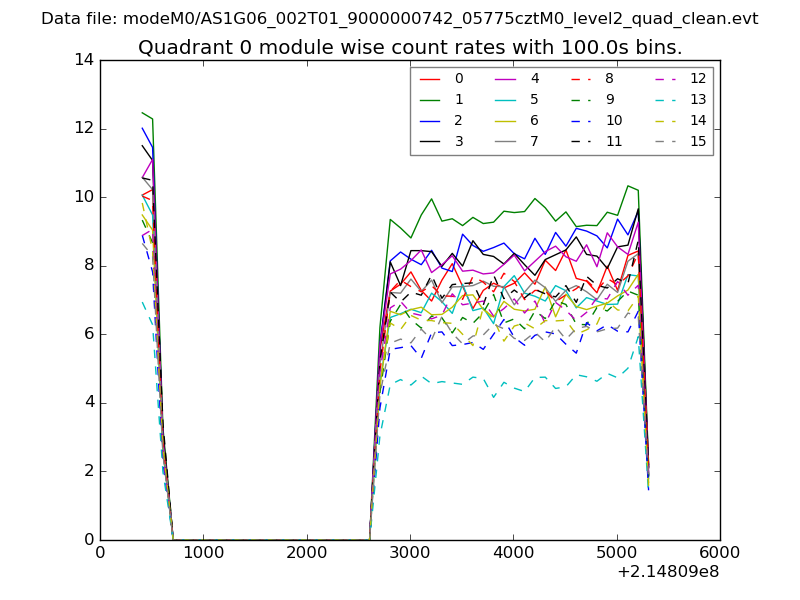 |
 |
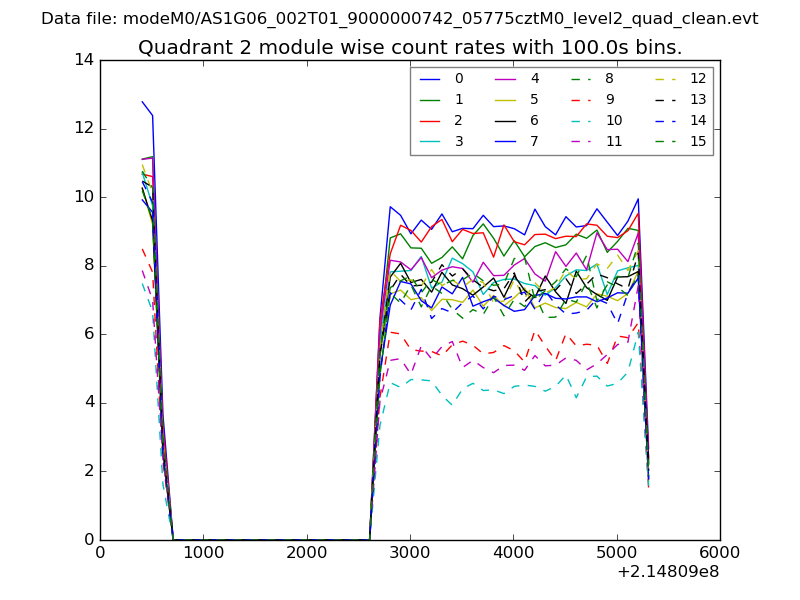
| Module-wise count rates for Quadrant B Data is divided into 100 sec bins |
 |
 |
| Module-wise count rates for Quadrant C Data is divided into 100 sec bins |
 |
 |
| Module-wise count rates for Quadrant D Data is divided into 100 sec bins |
 |
 |
| Parameter | Plot |
|---|---|
| CZT HV Monitor | 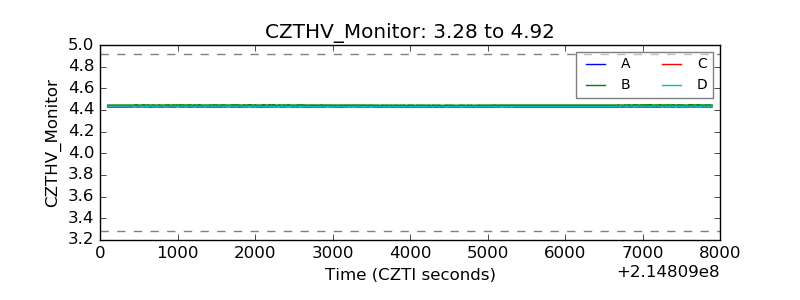 |
| D_VDD |  |
| Temperature 1 | 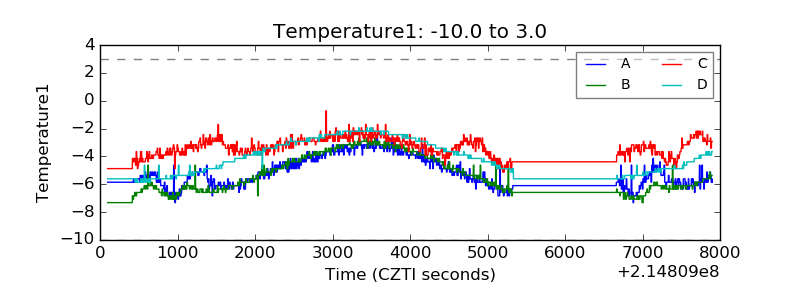 |
| Veto HV Monitor | 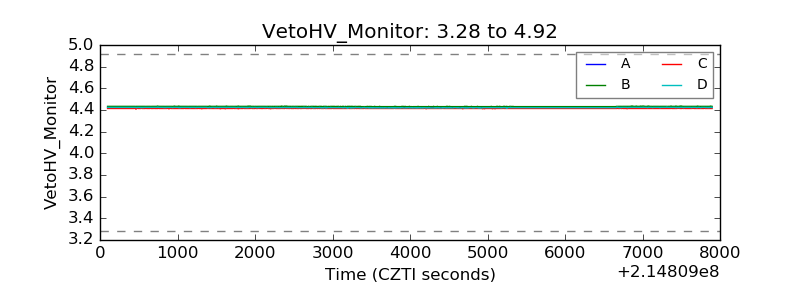 |
| Veto LLD | 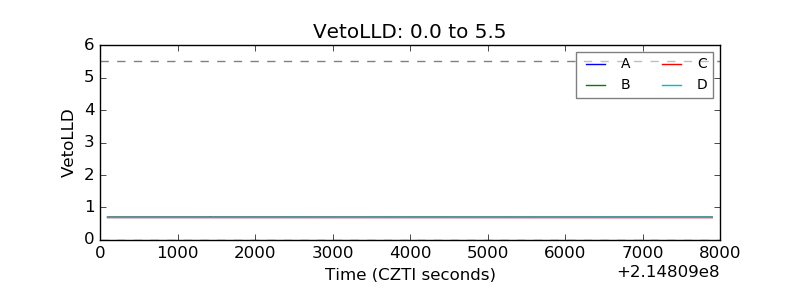 |
| Alpha Counter | 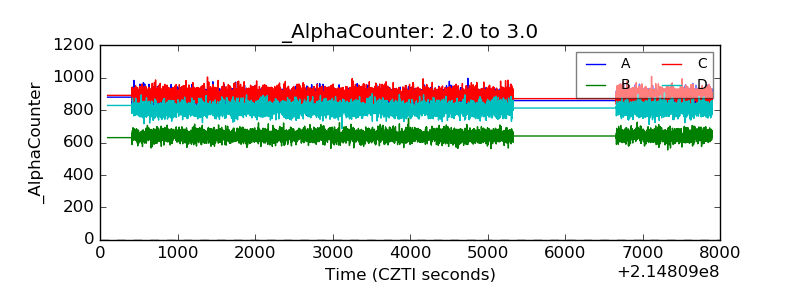 |
| _CPM_Rate | 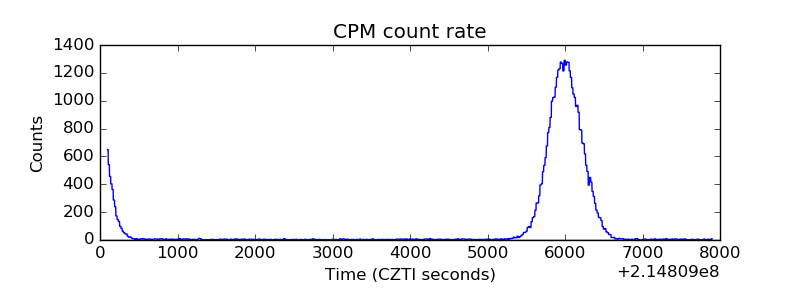 |
| CZT Counter | 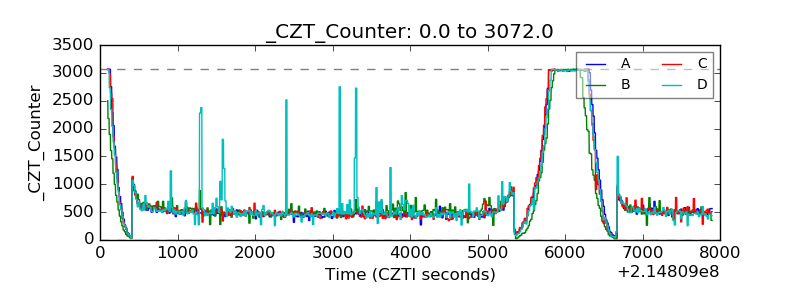 |
| +2.5 Volts monitor |  |
| +5 Volts monitor |  |
| _ROLL_ROT | 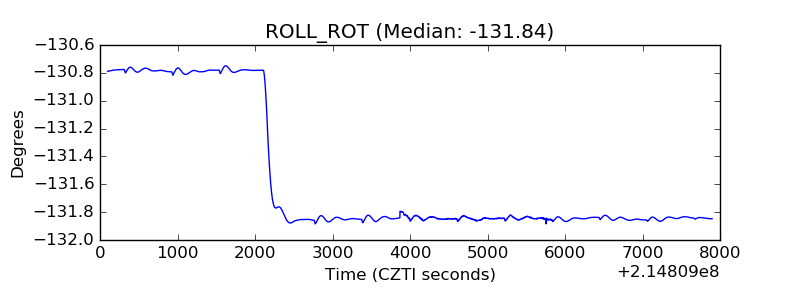 |
| _Roll_DEC | 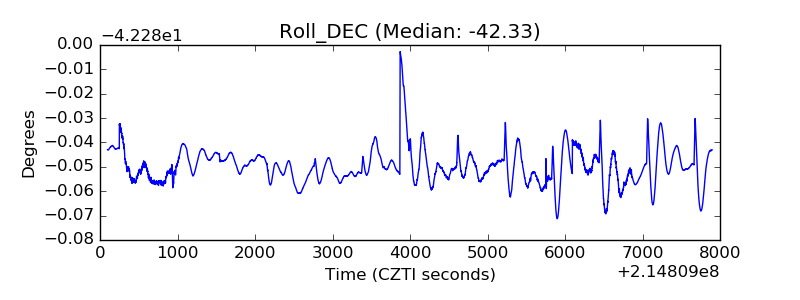 |
| _Roll_RA | 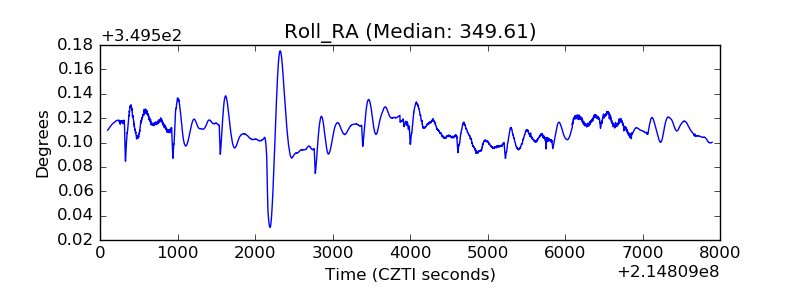 |
| Veto Counter | 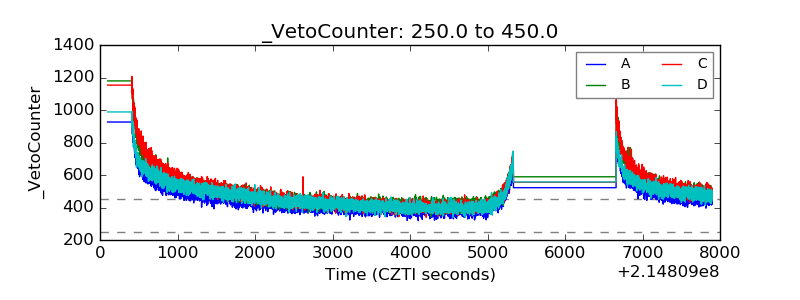 |