| Param | Original file | Final file |
|---|---|---|
| Filename | modeM0/AS1G06_002T01_9000000742_05776cztM0_level2.evt | modeM0/AS1G06_002T01_9000000742_05776cztM0_level2_quad_clean.evt |
| Size (bytes) | 420,520,320 | 60,289,920 |
| Size | 401.0 MB | 57.5 MB |
| Events in quadrant A | 3,054,150 | 346,535 |
| Events in quadrant B | 3,190,178 | 350,726 |
| Events in quadrant C | 3,052,436 | 352,374 |
| Events in quadrant D | 3,014,786 | 340,918 |
| Mode M0 | |||
|---|---|---|---|
| Quadrant | BADHDUFLAG | Total packets | Discarded packets |
| A | 0 | 12992 | 42 |
| B | 0 | 13208 | 31 |
| C | 0 | 13046 | 42 |
| D | 0 | 13091 | 57 |
| Mode M9 | |||
|---|---|---|---|
| Quadrant | BADHDUFLAG | Total packets | Discarded packets |
| A | 0 | 23 | 0 |
| B | 0 | 23 | 0 |
| C | 0 | 23 | 0 |
| D | 0 | 24 | 0 |
| Mode SS | |||
|---|---|---|---|
| Quadrant | BADHDUFLAG | Total packets | Discarded packets |
| A | 0 | 126 | 0 |
| B | 0 | 126 | 0 |
| C | 0 | 126 | 0 |
| D | 0 | 126 | 4 |
| Quadrant | Total seconds | Saturated seconds | Saturation percentage |
|---|---|---|---|
| A | 6234 | 112 | 1.796599% |
| B | 6239 | 134 | 2.147780% |
| C | 6234 | 110 | 1.764517% |
| D | 6230 | 99 | 1.589085% |
Noise dominated data is calculated using 1-second bins in cleaned event files. If a bin has >2000 counts, and if more than 50% of those come from <1% of pixels, then it is considered to be noise-dominated and hence unusable.
| Quadrant | # 1 sec bins | Bins with >0 counts | Bins with >2000 counts | High rate bins dominated by noise | Noise dominated (total time) | Noise dominated (detector-on time) | Marked lightcurve |
|---|---|---|---|---|---|---|---|
| A | 7484 | 6252 | 0 | 0 | 0.00% | 0.00% | 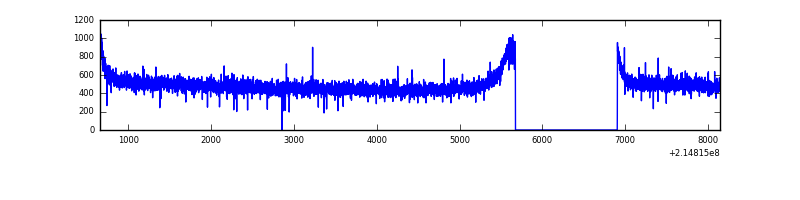 |
| B | 7484 | 6255 | 1 | 1 | 0.01% | 0.02% | 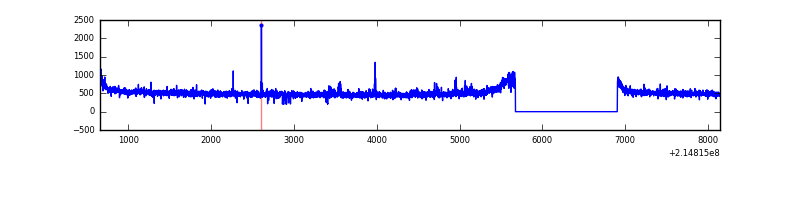 |
| C | 7484 | 6255 | 0 | 0 | 0.00% | 0.00% |  |
| D | 7484 | 6253 | 2 | 2 | 0.03% | 0.03% | 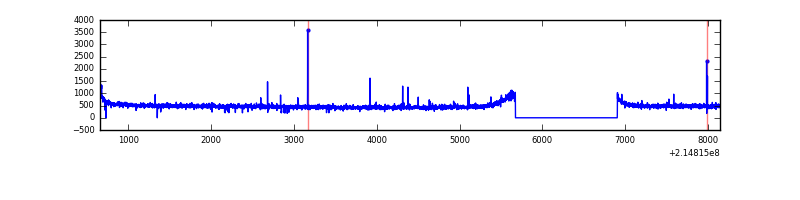 |
Top three noisy pixels from each quadrant. If the there are fewer than three noisy pixels in the level2.evt file, extra rows are filled as -1
| Pixel properties | Quadrant properties | ||||||
|---|---|---|---|---|---|---|---|
| Quadrant | DetID | PixID | Counts | Sigma | Mean | Median | Sigma |
| A | 12 | 194 | 7791 | 43.79 | 793 | 778 | 160.2 |
| A | 0 | 226 | 7705 | 43.25 | 793 | 778 | 160.2 |
| A | 13 | 254 | 2388 | 10.05 | 793 | 778 | 160.2 |
| B | 15 | 204 | 63489 | 413.27 | 800 | 782 | 151.7 |
| B | 12 | 111 | 14680 | 91.6 | 800 | 782 | 151.7 |
| B | 4 | 81 | 14074 | 87.6 | 800 | 782 | 151.7 |
| C | 1 | 16 | 9906 | 51.16 | 779 | 783 | 178.3 |
| C | 13 | 61 | 6419 | 31.61 | 779 | 783 | 178.3 |
| C | 7 | 236 | 3315 | 14.2 | 779 | 783 | 178.3 |
| D | 8 | 195 | 30822 | 158.22 | 776 | 751 | 190.1 |
| D | 2 | 14 | 17657 | 88.95 | 776 | 751 | 190.1 |
| D | 6 | 223 | 8223 | 39.31 | 776 | 751 | 190.1 |
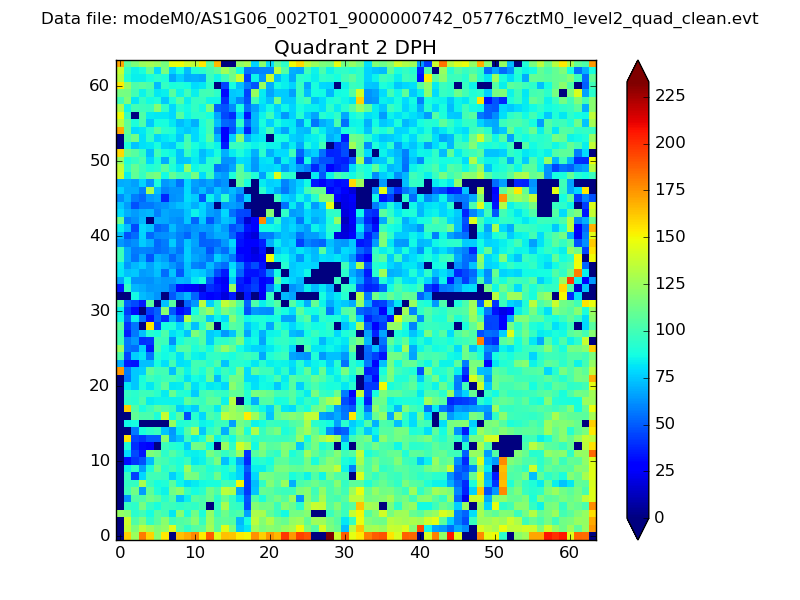
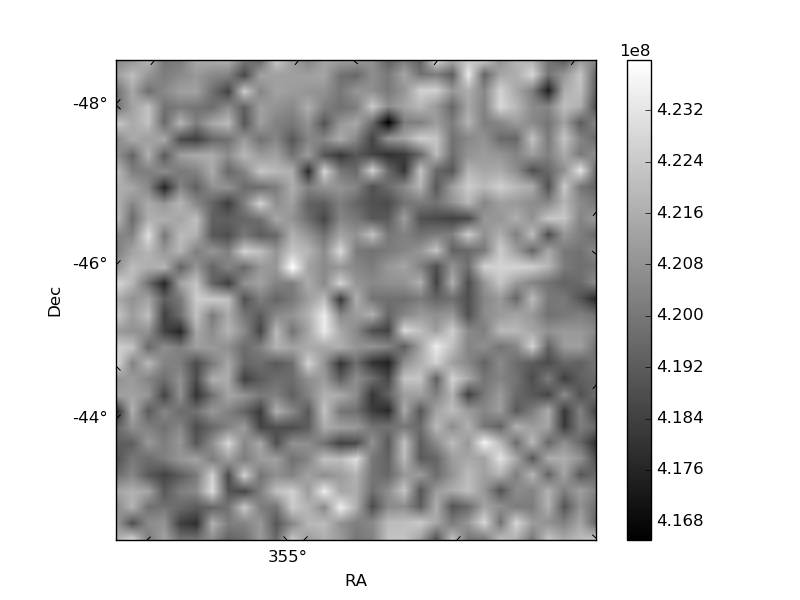
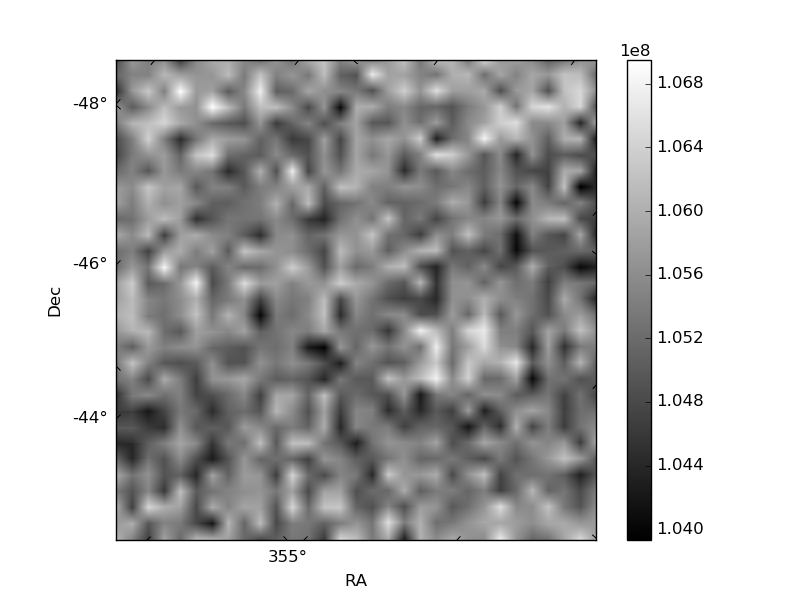
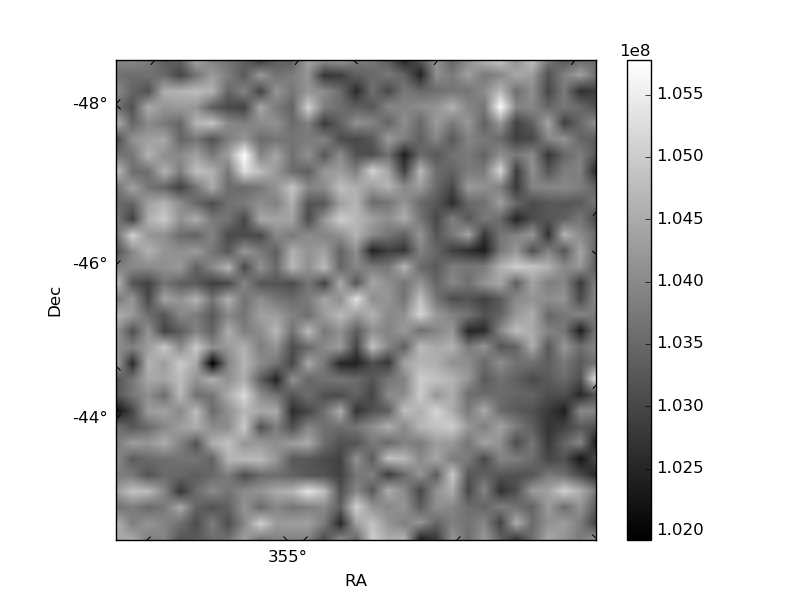
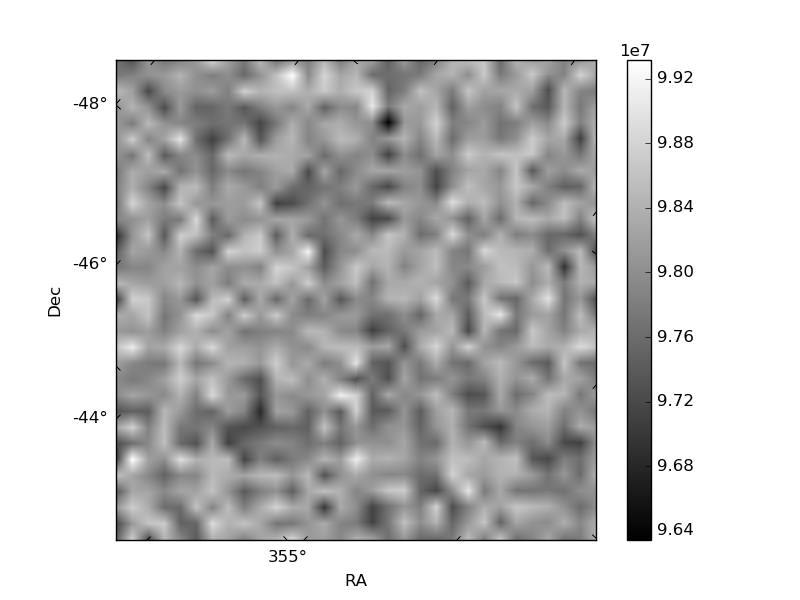
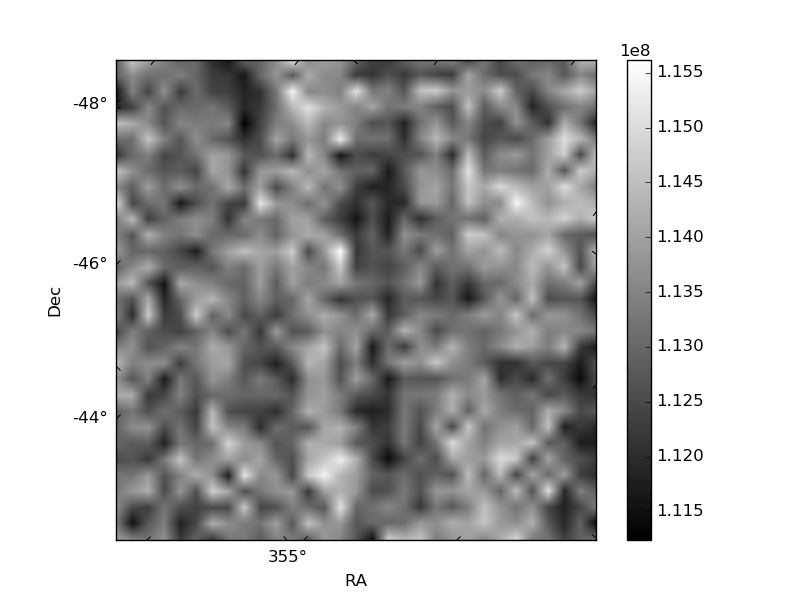
Histogram calculated using DETX and DETY for each event in the final _common_clean file
| Quadrant A | 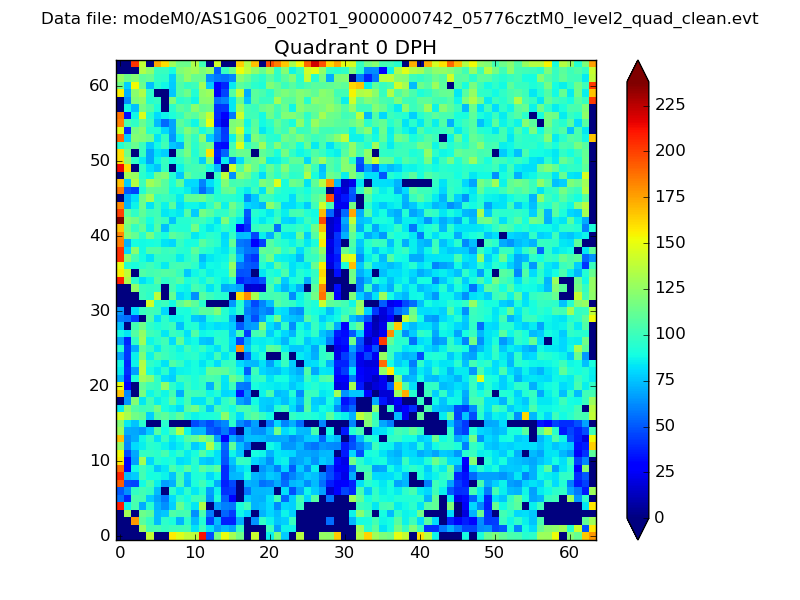 |
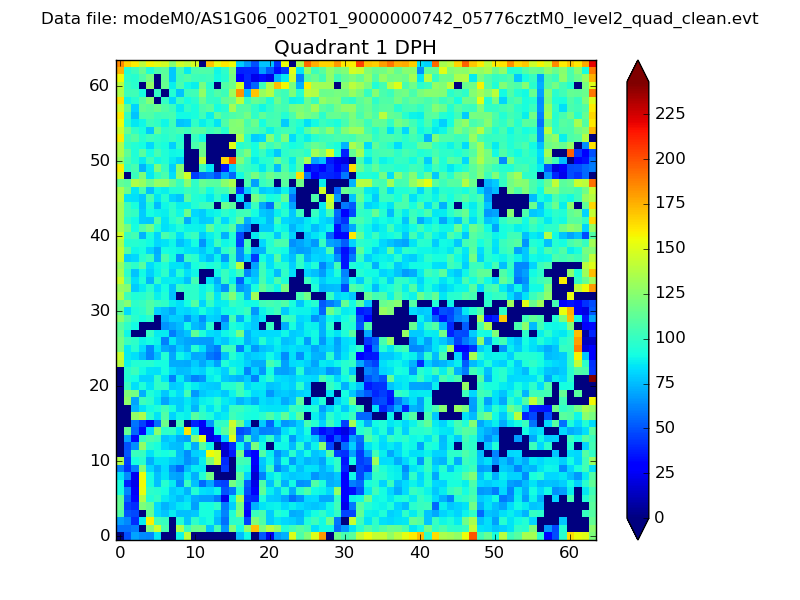 |
Quadrant B |
|---|---|---|---|
| Quadrant D | 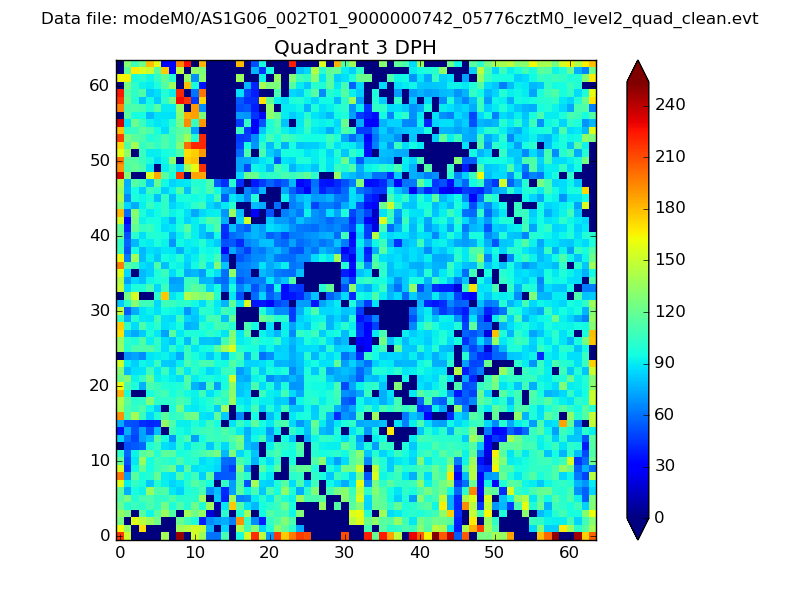 |
 |
Quadrant C |
| Plot type | Count rate plots | Images |
|---|---|---|
| Comparison with Poisson distribution Blue bars denote a histogram of data divided into 1 sec bins. Red curve is a Poisson curve with rate = median count rate of data. |
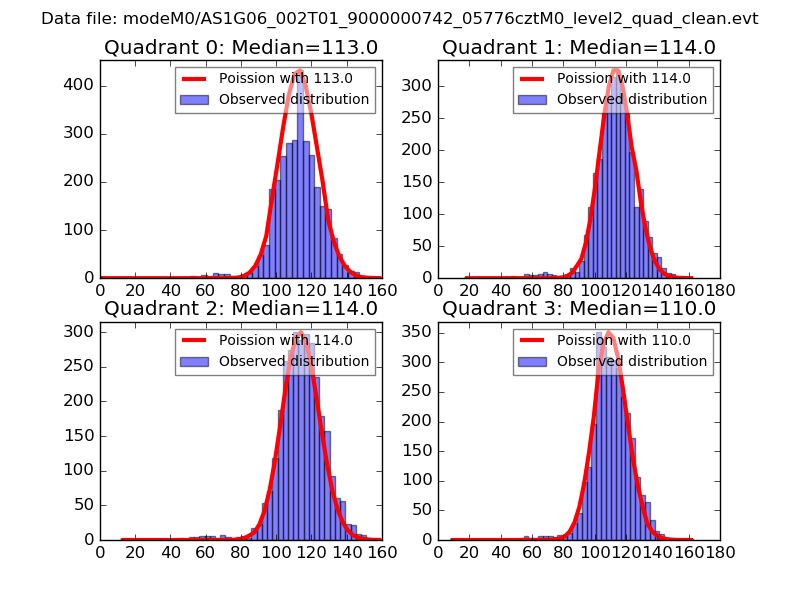 |
 |
| Quadrant-wise count rates Data is divided into 100 sec bins |
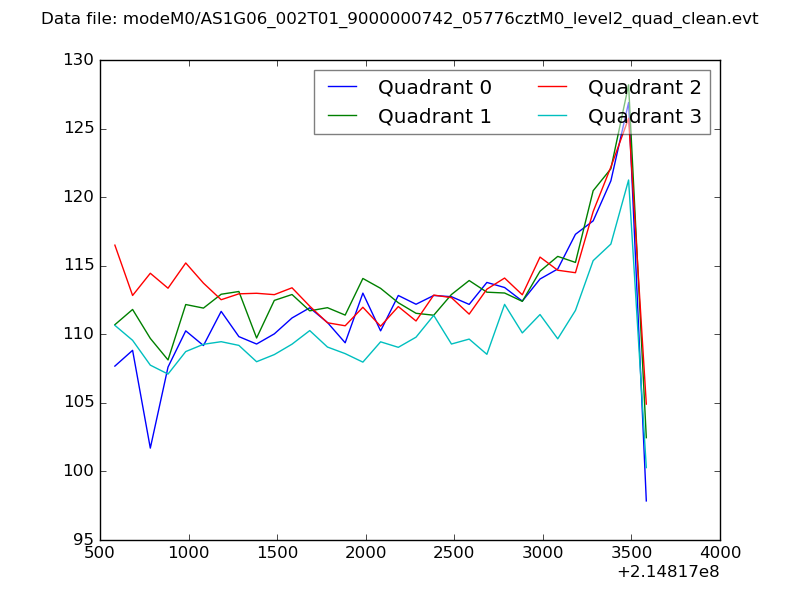 |
|
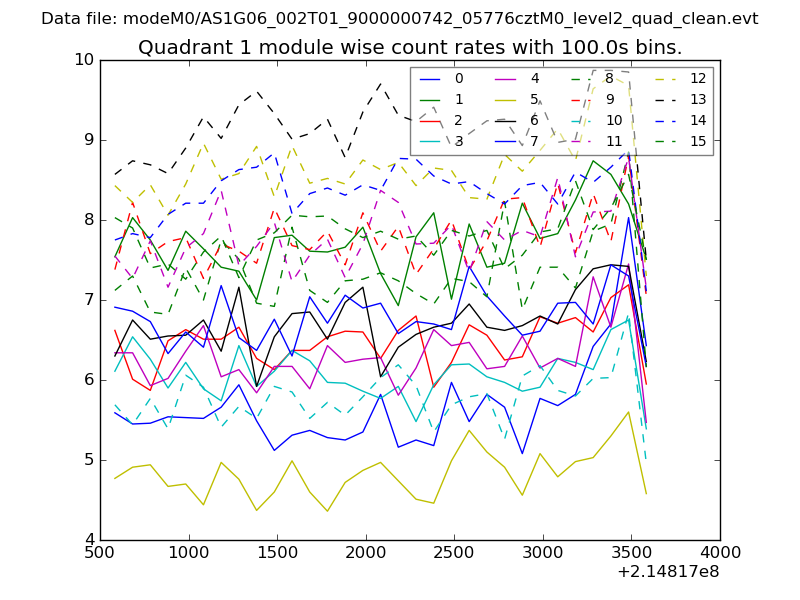
| Module-wise count rates for Quadrant A Data is divided into 100 sec bins |
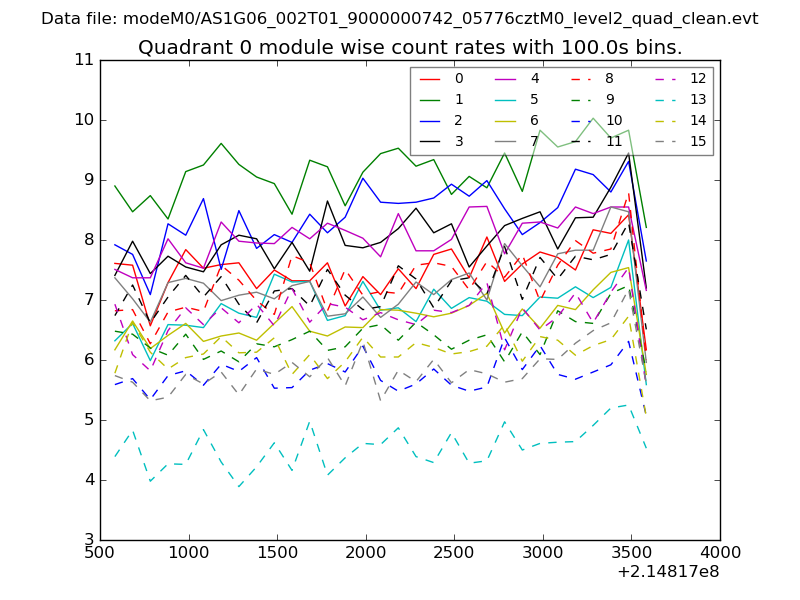 |
 |
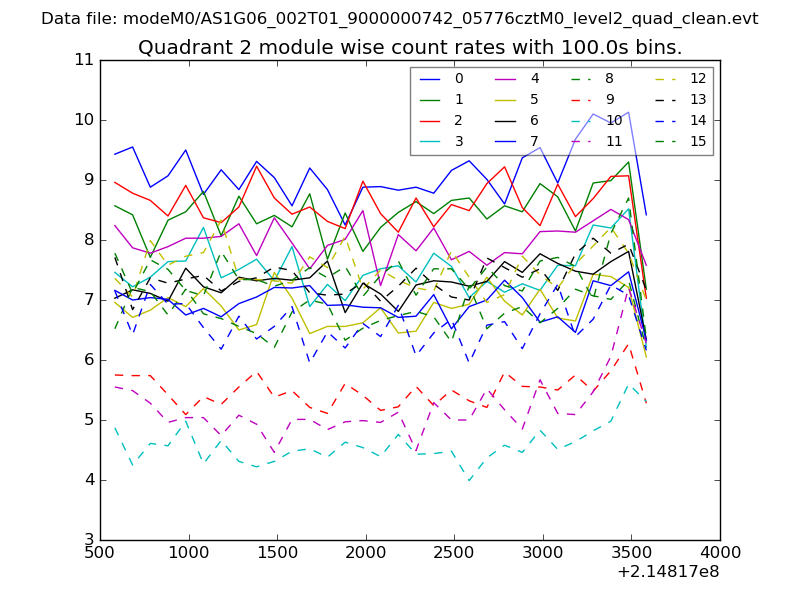
| Module-wise count rates for Quadrant B Data is divided into 100 sec bins |
 |
 |
| Module-wise count rates for Quadrant C Data is divided into 100 sec bins |
 |
 |
| Module-wise count rates for Quadrant D Data is divided into 100 sec bins |
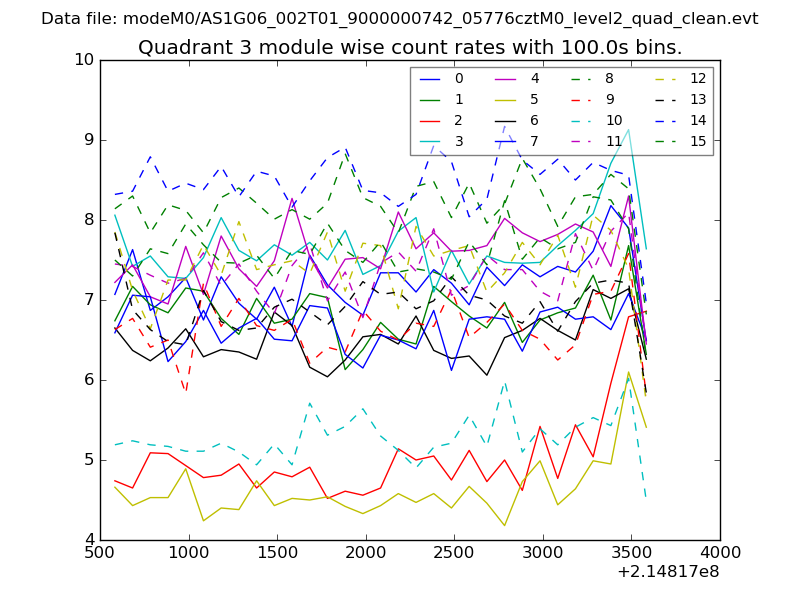 |
 |
| Parameter | Plot |
|---|---|
| CZT HV Monitor | 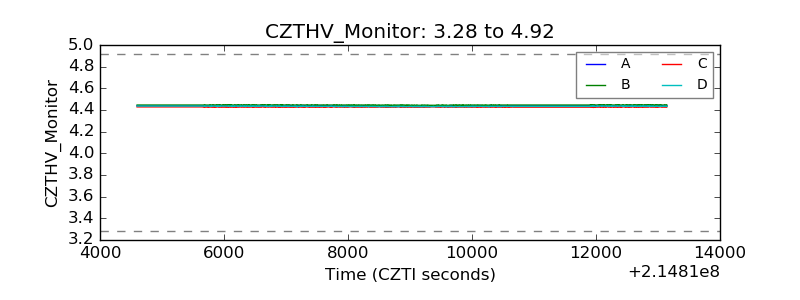 |
| D_VDD | 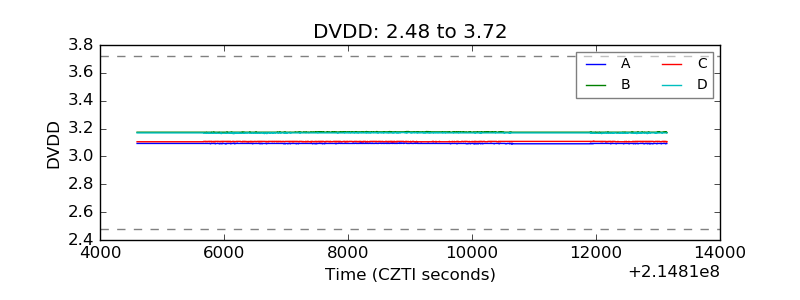 |
| Temperature 1 | 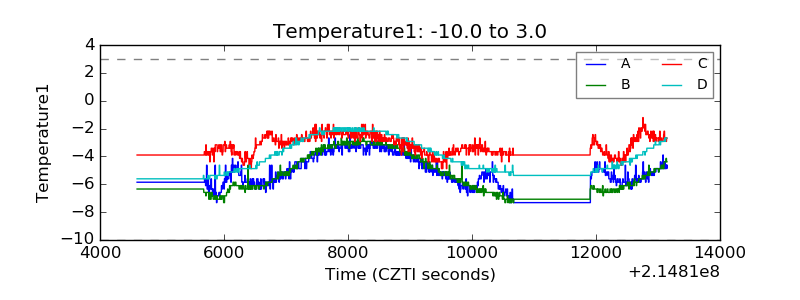 |
| Veto HV Monitor |  |
| Veto LLD | 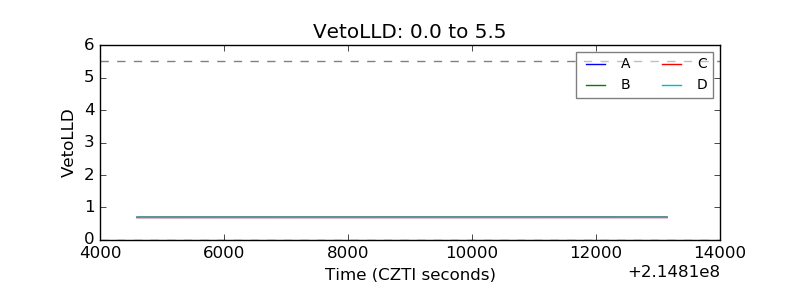 |
| Alpha Counter | 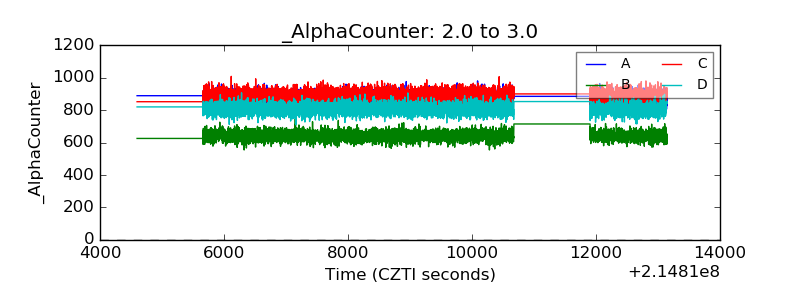 |
| _CPM_Rate | 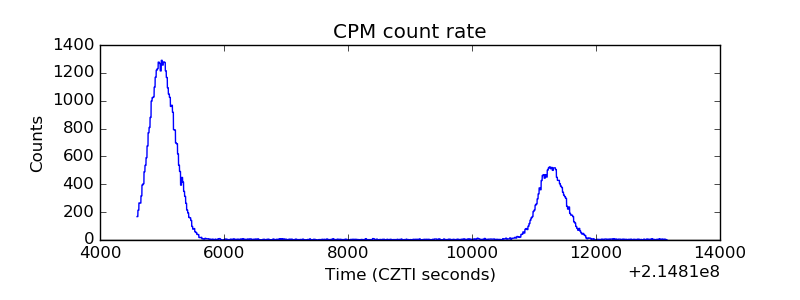 |
| CZT Counter | 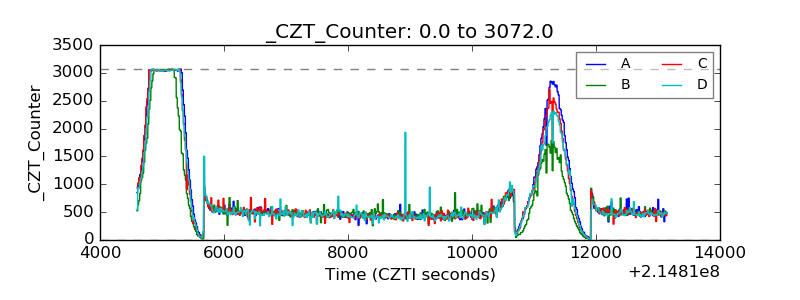 |
| +2.5 Volts monitor |  |
| +5 Volts monitor |  |
| _ROLL_ROT | 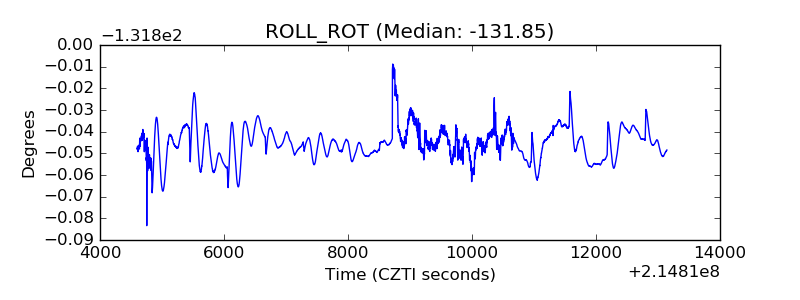 |
| _Roll_DEC |  |
| _Roll_RA | 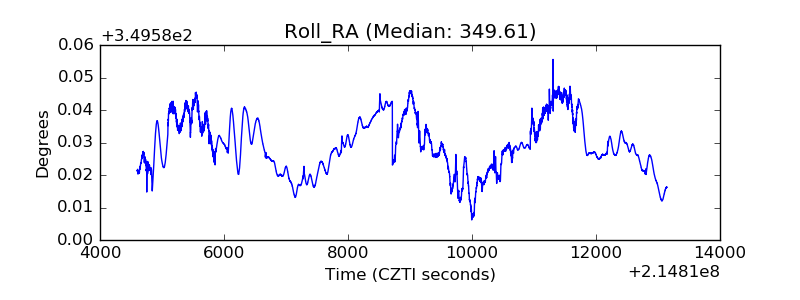 |
| Veto Counter | 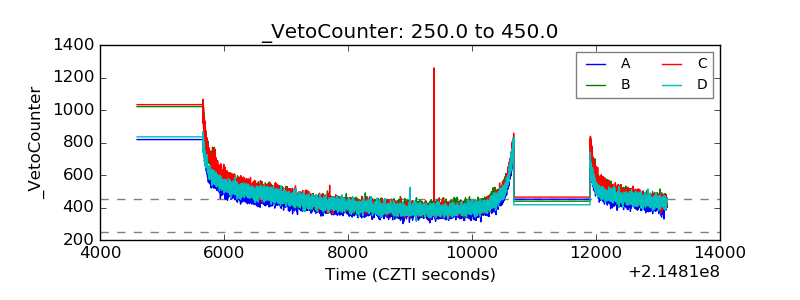 |