| Param | Original file | Final file |
|---|---|---|
| Filename | modeM0/AS1G06_002T01_9000000742_05777cztM0_level2.evt | modeM0/AS1G06_002T01_9000000742_05777cztM0_level2_quad_clean.evt |
| Size (bytes) | 504,043,200 | 87,716,160 |
| Size | 480.7 MB | 83.7 MB |
| Events in quadrant A | 3,557,093 | 536,982 |
| Events in quadrant B | 4,047,858 | 538,079 |
| Events in quadrant C | 3,588,692 | 541,790 |
| Events in quadrant D | 3,566,370 | 522,371 |
| Mode M0 | |||
|---|---|---|---|
| Quadrant | BADHDUFLAG | Total packets | Discarded packets |
| A | 0 | 16041 | 595 |
| B | 0 | 17238 | 675 |
| C | 0 | 16160 | 555 |
| D | 0 | 16214 | 599 |
| Mode M9 | |||
|---|---|---|---|
| Quadrant | BADHDUFLAG | Total packets | Discarded packets |
| A | 0 | 23 | 0 |
| B | 0 | 23 | 1 |
| C | 0 | 23 | 0 |
| D | 0 | 23 | 0 |
| Mode SS | |||
|---|---|---|---|
| Quadrant | BADHDUFLAG | Total packets | Discarded packets |
| A | 0 | 154 | 2 |
| B | 0 | 154 | 2 |
| C | 0 | 154 | 6 |
| D | 0 | 154 | 6 |
| Quadrant | Total seconds | Saturated seconds | Saturation percentage |
|---|---|---|---|
| A | 7426 | 222 | 2.989496% |
| B | 7420 | 254 | 3.423181% |
| C | 7450 | 206 | 2.765101% |
| D | 7429 | 190 | 2.557545% |
Noise dominated data is calculated using 1-second bins in cleaned event files. If a bin has >2000 counts, and if more than 50% of those come from <1% of pixels, then it is considered to be noise-dominated and hence unusable.
| Quadrant | # 1 sec bins | Bins with >0 counts | Bins with >2000 counts | High rate bins dominated by noise | Noise dominated (total time) | Noise dominated (detector-on time) | Marked lightcurve |
|---|---|---|---|---|---|---|---|
| A | 9873 | 7606 | 0 | 0 | 0.00% | 0.00% | 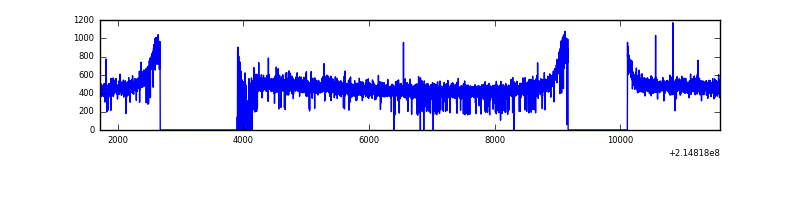 |
| B | 9873 | 7604 | 8 | 8 | 0.08% | 0.11% | 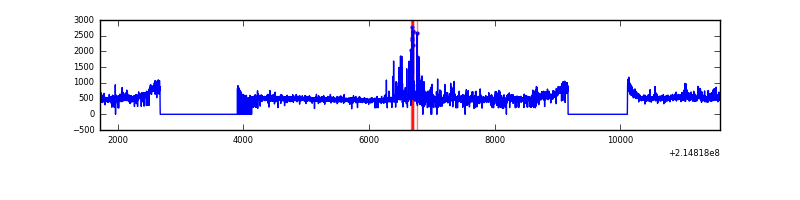 |
| C | 9873 | 7611 | 0 | 0 | 0.00% | 0.00% |  |
| D | 9873 | 7611 | 6 | 6 | 0.06% | 0.08% | 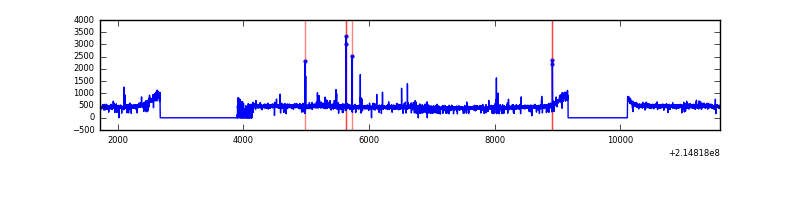 |
Top three noisy pixels from each quadrant. If the there are fewer than three noisy pixels in the level2.evt file, extra rows are filled as -1
| Pixel properties | Quadrant properties | ||||||
|---|---|---|---|---|---|---|---|
| Quadrant | DetID | PixID | Counts | Sigma | Mean | Median | Sigma |
| A | 12 | 194 | 9068 | 43.08 | 924 | 904 | 189.5 |
| A | 0 | 226 | 8891 | 42.15 | 924 | 904 | 189.5 |
| A | 13 | 254 | 2776 | 9.88 | 924 | 904 | 189.5 |
| B | 15 | 204 | 312679 | 1733.76 | 929 | 905 | 179.8 |
| B | 15 | 54 | 99512 | 548.35 | 929 | 905 | 179.8 |
| B | 4 | 81 | 21028 | 111.9 | 929 | 905 | 179.8 |
| C | 1 | 16 | 47071 | 219.76 | 907 | 909 | 210.1 |
| C | 13 | 61 | 7360 | 30.71 | 907 | 909 | 210.1 |
| C | 8 | 222 | 2352 | 6.87 | 907 | 909 | 210.1 |
| D | 8 | 195 | 80465 | 360.66 | 903 | 874 | 220.7 |
| D | 2 | 14 | 33409 | 147.43 | 903 | 874 | 220.7 |
| D | 2 | 206 | 22201 | 96.64 | 903 | 874 | 220.7 |
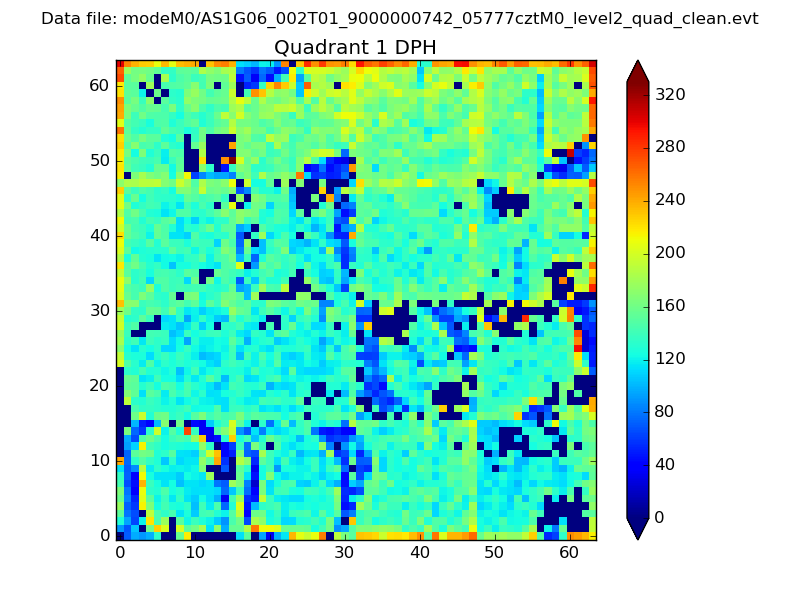
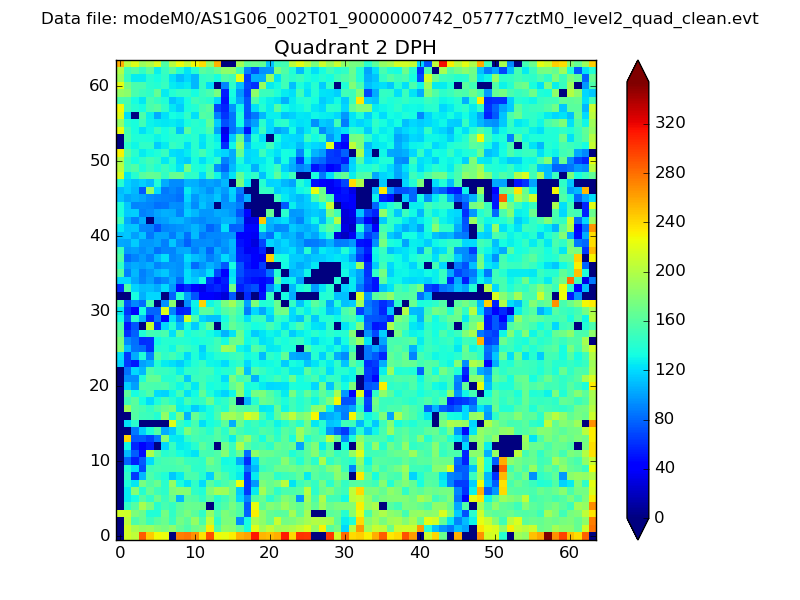
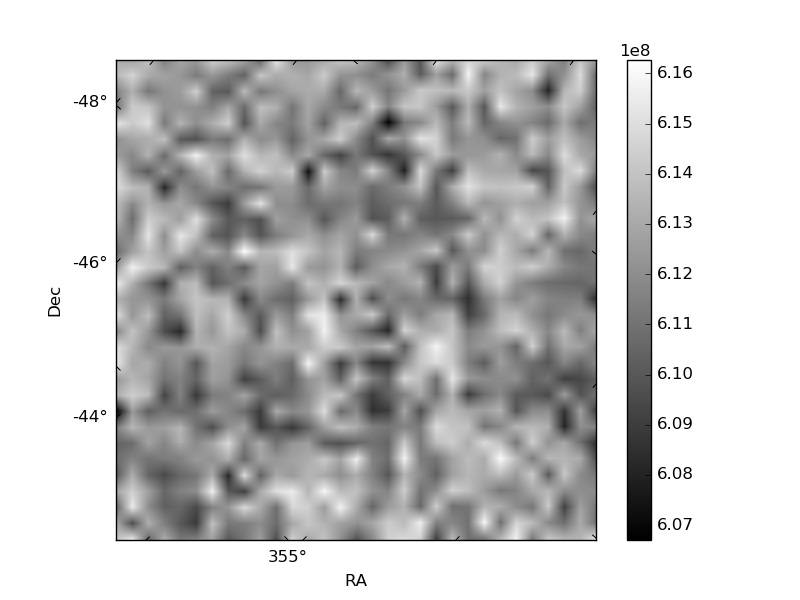
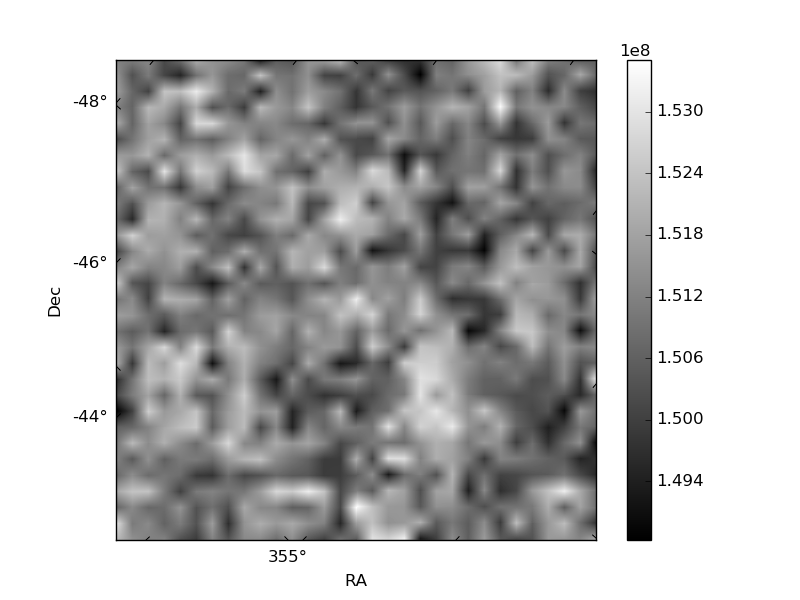
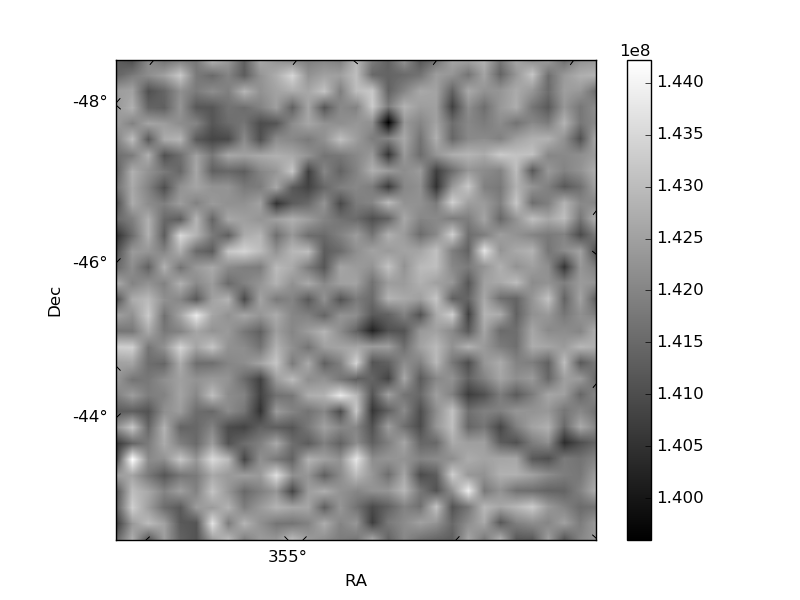
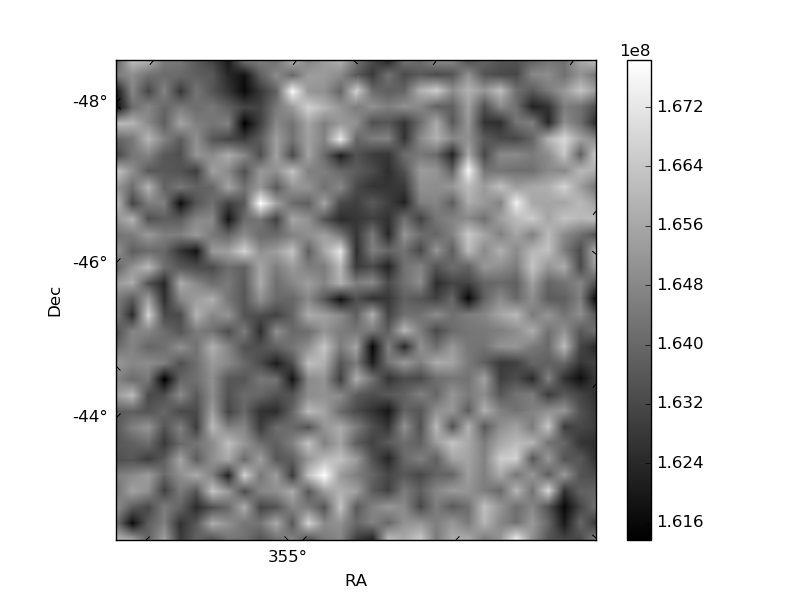
Histogram calculated using DETX and DETY for each event in the final _common_clean file
| Quadrant A | 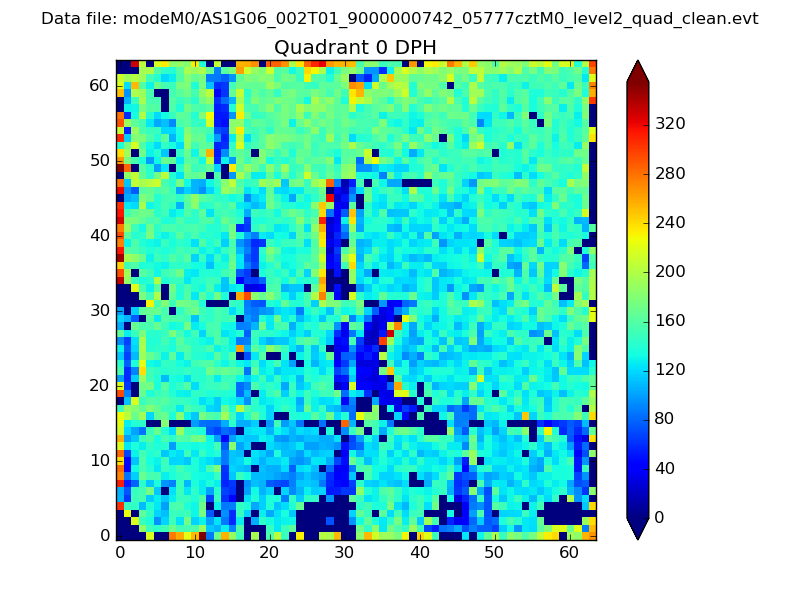 |
 |
Quadrant B |
|---|---|---|---|
| Quadrant D | 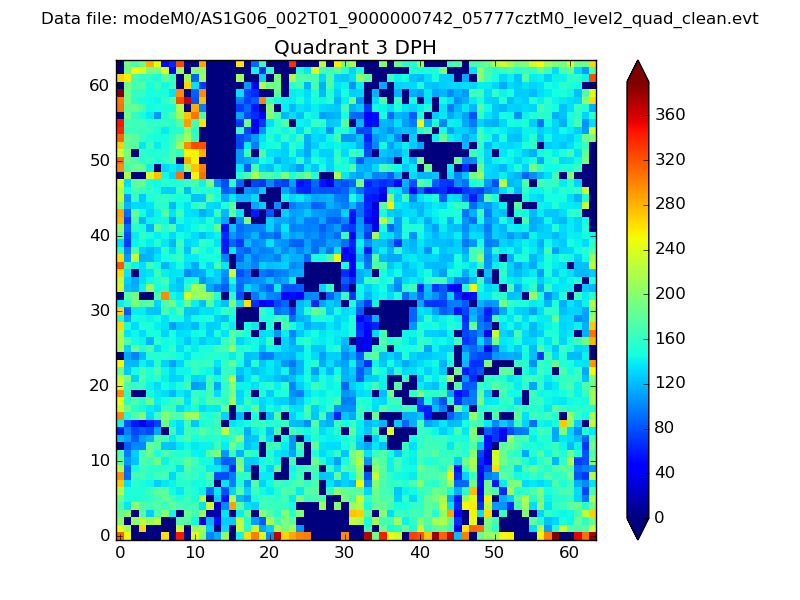 |
 |
Quadrant C |
| Plot type | Count rate plots | Images |
|---|---|---|
| Comparison with Poisson distribution Blue bars denote a histogram of data divided into 1 sec bins. Red curve is a Poisson curve with rate = median count rate of data. |
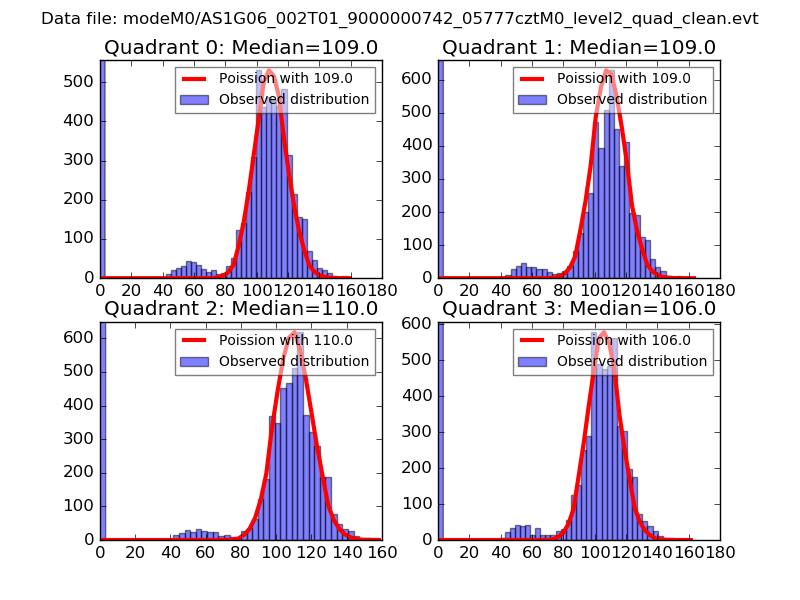 |
 |
| Quadrant-wise count rates Data is divided into 100 sec bins |
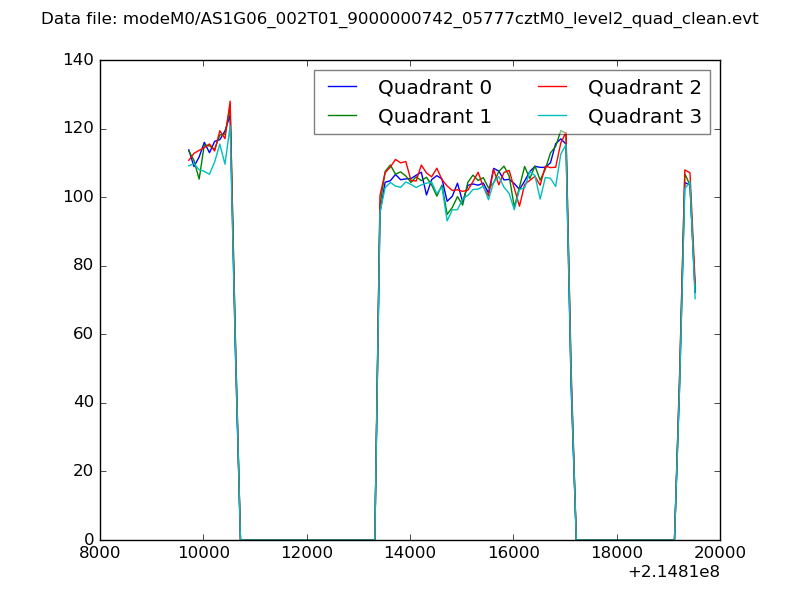 |
|
| Module-wise count rates for Quadrant A Data is divided into 100 sec bins |
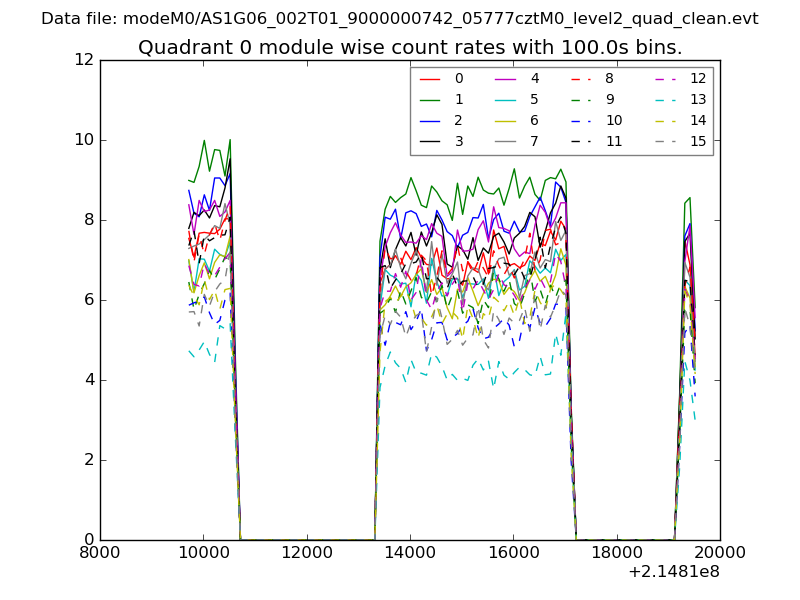 |
 |
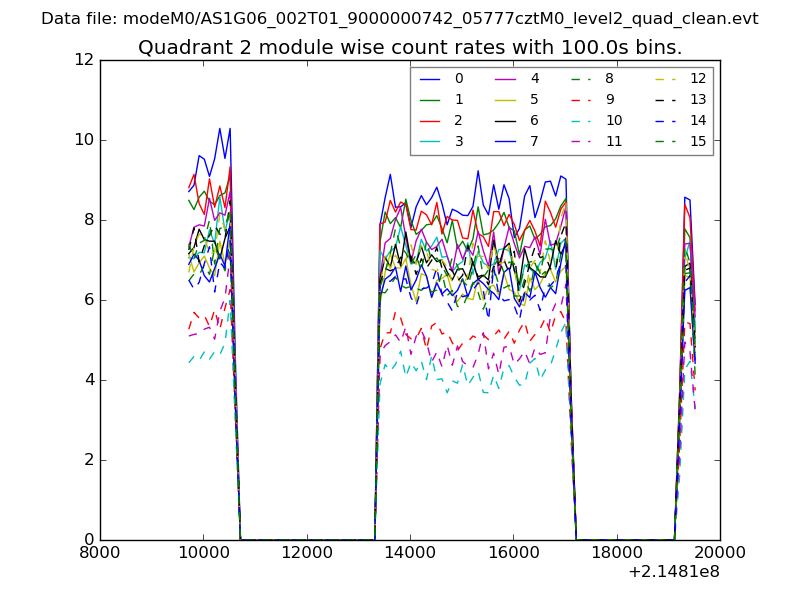
| Module-wise count rates for Quadrant B Data is divided into 100 sec bins |
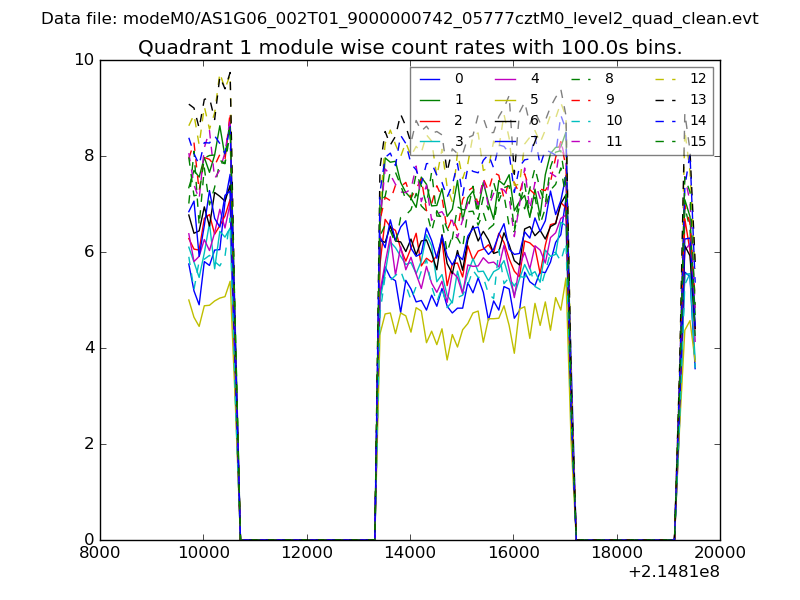 |
 |
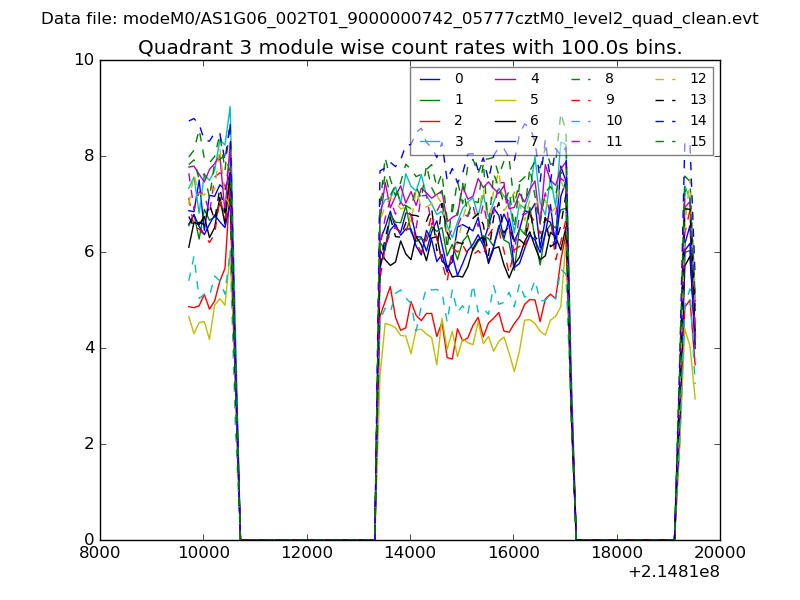
| Module-wise count rates for Quadrant C Data is divided into 100 sec bins |
 |
 |
| Module-wise count rates for Quadrant D Data is divided into 100 sec bins |
 |
 |
| Parameter | Plot |
|---|---|
| CZT HV Monitor | 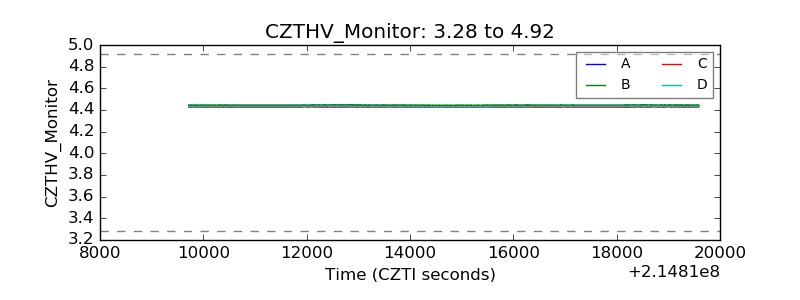 |
| D_VDD | 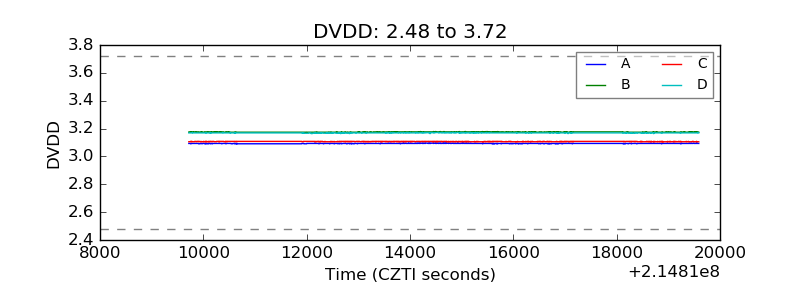 |
| Temperature 1 | 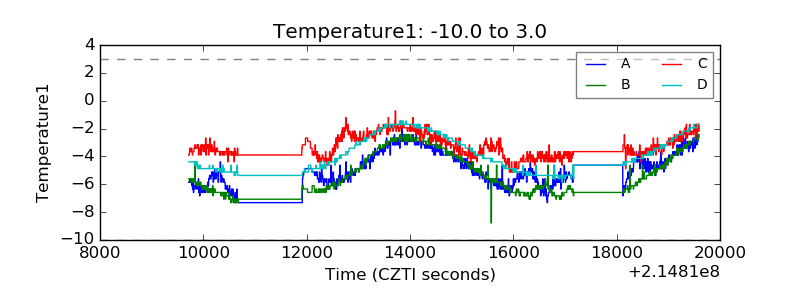 |
| Veto HV Monitor |  |
| Veto LLD | 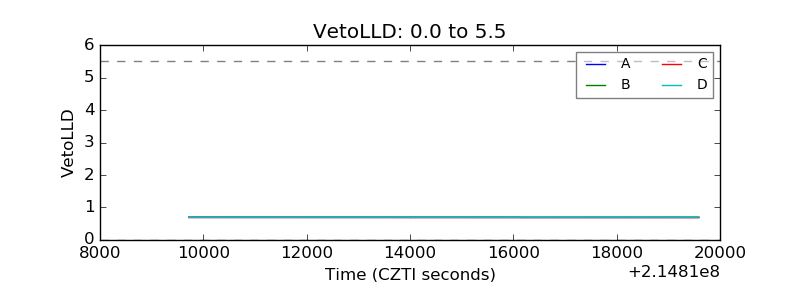 |
| Alpha Counter | 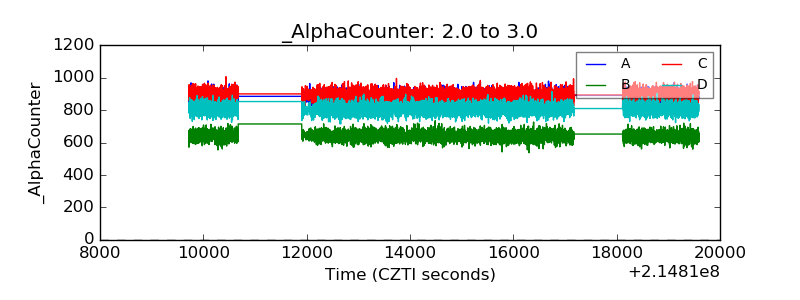 |
| _CPM_Rate | 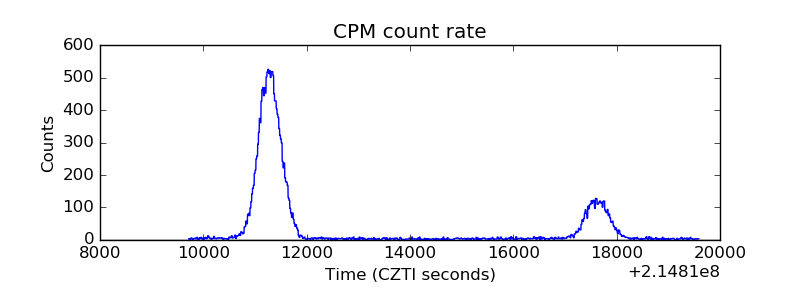 |
| CZT Counter | 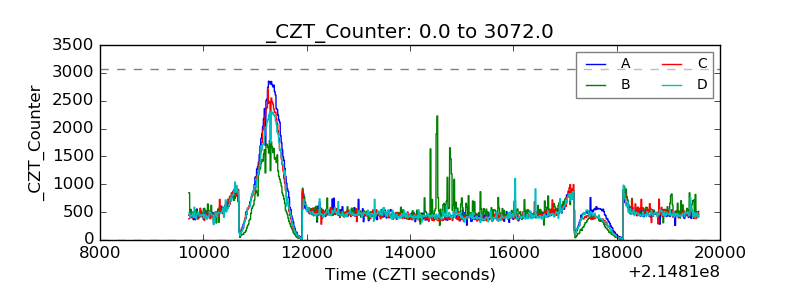 |
| +2.5 Volts monitor |  |
| +5 Volts monitor |  |
| _ROLL_ROT | 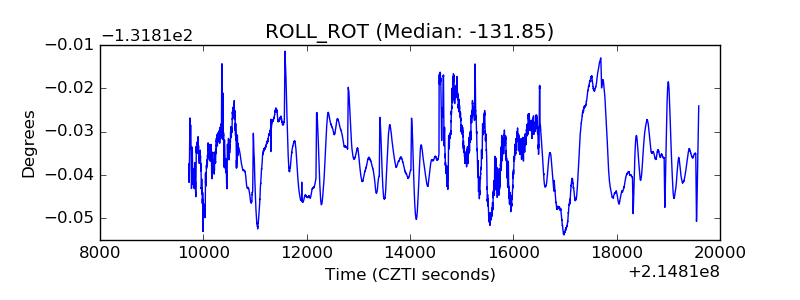 |
| _Roll_DEC |  |
| _Roll_RA | 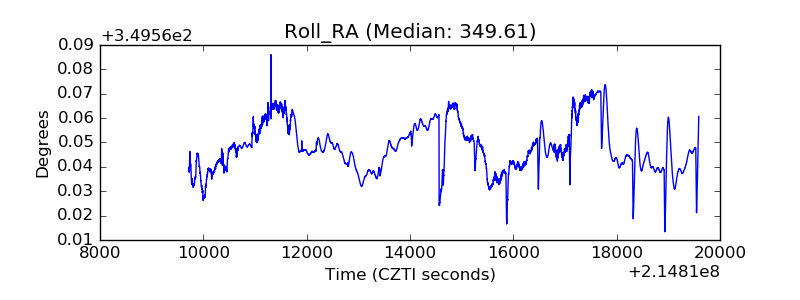 |
| Veto Counter | 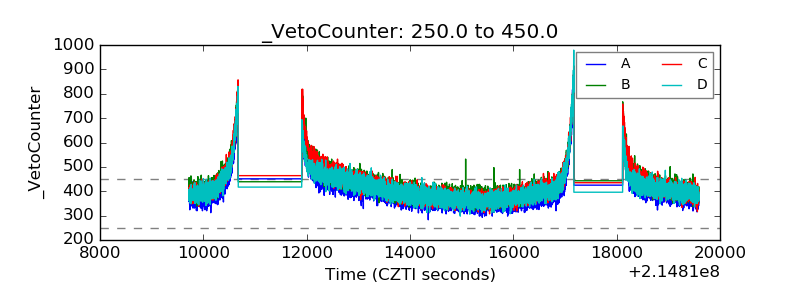 |