| Param | Original file | Final file |
|---|---|---|
| Filename | modeM0/AS1G06_002T01_9000000742_05778cztM0_level2.evt | modeM0/AS1G06_002T01_9000000742_05778cztM0_level2_quad_clean.evt |
| Size (bytes) | 818,798,400 | 141,675,840 |
| Size | 780.9 MB | 135.1 MB |
| Events in quadrant A | 5,865,185 | 863,601 |
| Events in quadrant B | 6,529,284 | 864,416 |
| Events in quadrant C | 5,693,939 | 869,065 |
| Events in quadrant D | 5,872,964 | 840,769 |
| Mode M0 | |||
|---|---|---|---|
| Quadrant | BADHDUFLAG | Total packets | Discarded packets |
| A | 0 | 25998 | 256 |
| B | 0 | 27304 | 241 |
| C | 0 | 25705 | 241 |
| D | 0 | 26154 | 197 |
| Mode M9 | |||
|---|---|---|---|
| Quadrant | BADHDUFLAG | Total packets | Discarded packets |
| A | 0 | 20 | 0 |
| B | 0 | 20 | 2 |
| C | 0 | 20 | 1 |
| D | 0 | 21 | 0 |
| Mode SS | |||
|---|---|---|---|
| Quadrant | BADHDUFLAG | Total packets | Discarded packets |
| A | 0 | 250 | 0 |
| B | 0 | 250 | 2 |
| C | 0 | 250 | 0 |
| D | 0 | 250 | 0 |
| Quadrant | Total seconds | Saturated seconds | Saturation percentage |
|---|---|---|---|
| A | 12322 | 257 | 2.085700% |
| B | 12340 | 304 | 2.463533% |
| C | 12331 | 215 | 1.743573% |
| D | 12353 | 221 | 1.789039% |
Noise dominated data is calculated using 1-second bins in cleaned event files. If a bin has >2000 counts, and if more than 50% of those come from <1% of pixels, then it is considered to be noise-dominated and hence unusable.
| Quadrant | # 1 sec bins | Bins with >0 counts | Bins with >2000 counts | High rate bins dominated by noise | Noise dominated (total time) | Noise dominated (detector-on time) | Marked lightcurve |
|---|---|---|---|---|---|---|---|
| A | 13935 | 12431 | 0 | 0 | 0.00% | 0.00% |  |
| B | 13935 | 12433 | 10 | 10 | 0.07% | 0.08% | 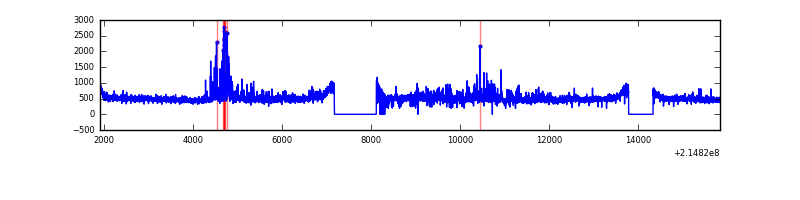 |
| C | 13935 | 12432 | 0 | 0 | 0.00% | 0.00% | 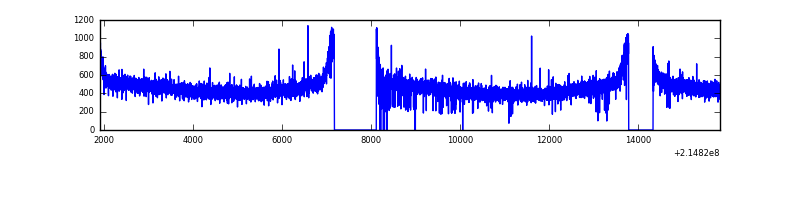 |
| D | 13935 | 12434 | 23 | 23 | 0.17% | 0.18% | 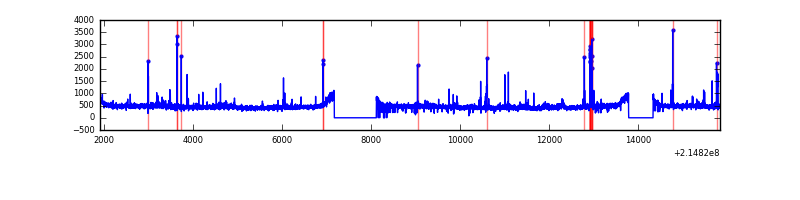 |
Top three noisy pixels from each quadrant. If the there are fewer than three noisy pixels in the level2.evt file, extra rows are filled as -1
| Pixel properties | Quadrant properties | ||||||
|---|---|---|---|---|---|---|---|
| Quadrant | DetID | PixID | Counts | Sigma | Mean | Median | Sigma |
| A | 15 | 79 | 164250 | 540.73 | 1481 | 1449 | 301.1 |
| A | 12 | 194 | 14346 | 42.84 | 1481 | 1449 | 301.1 |
| A | 0 | 226 | 14277 | 42.61 | 1481 | 1449 | 301.1 |
| B | 15 | 204 | 549199 | 1920.19 | 1495 | 1458 | 285.3 |
| B | 15 | 54 | 113142 | 391.53 | 1495 | 1458 | 285.3 |
| B | 4 | 81 | 41441 | 140.17 | 1495 | 1458 | 285.3 |
| C | 1 | 16 | 49979 | 145.17 | 1446 | 1450 | 334.3 |
| C | 13 | 61 | 11748 | 30.81 | 1446 | 1450 | 334.3 |
| C | 3 | 202 | 3541 | 6.25 | 1446 | 1450 | 334.3 |
| D | 8 | 195 | 176088 | 491.89 | 1448 | 1403 | 355.1 |
| D | 2 | 14 | 117596 | 327.18 | 1448 | 1403 | 355.1 |
| D | 12 | 233 | 37124 | 100.59 | 1448 | 1403 | 355.1 |
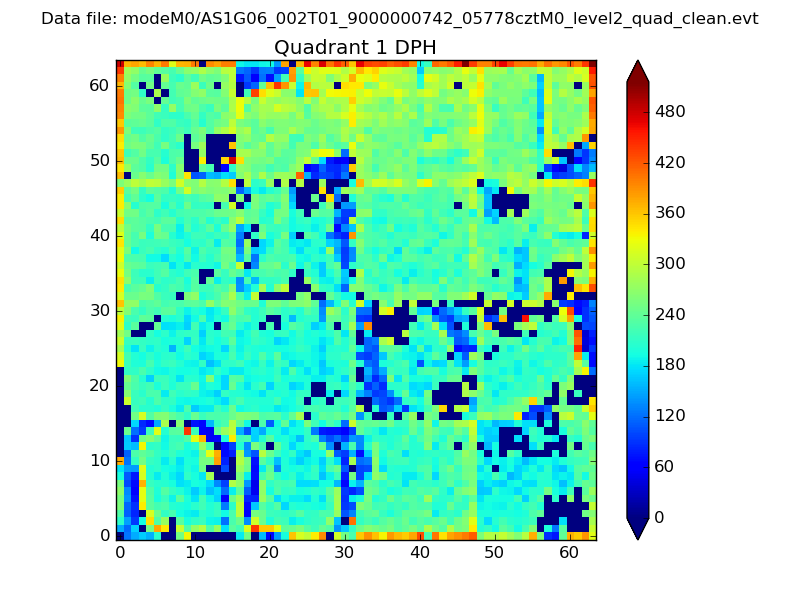
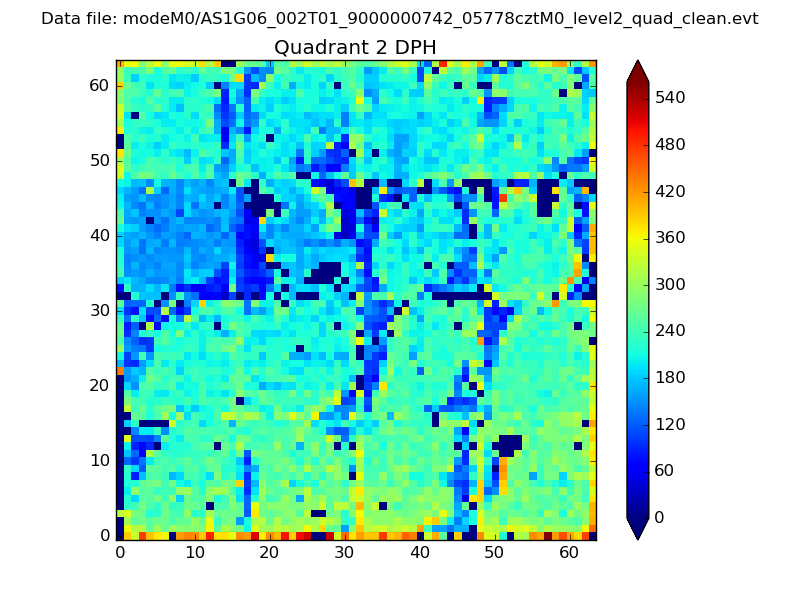
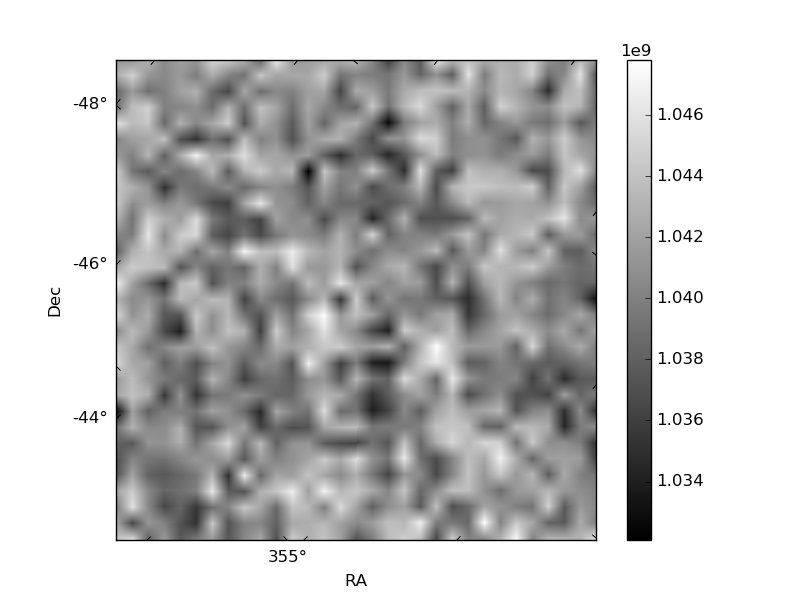
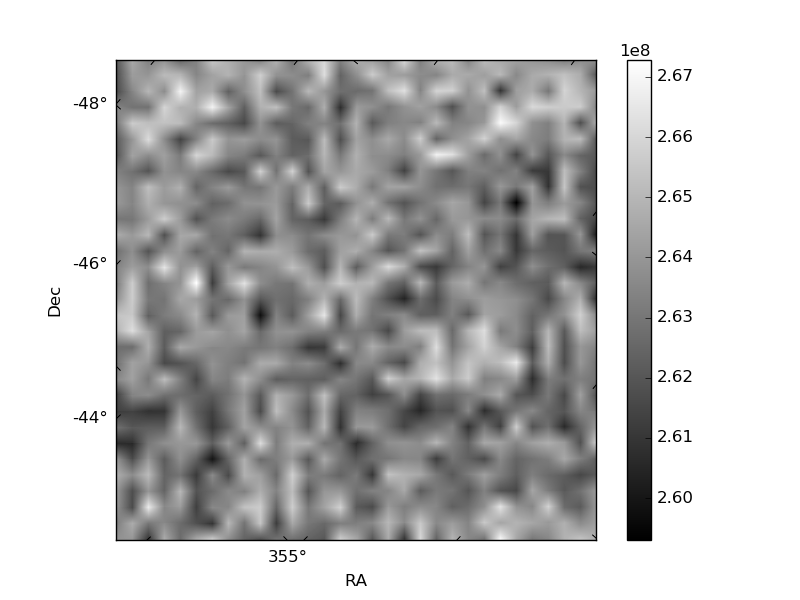
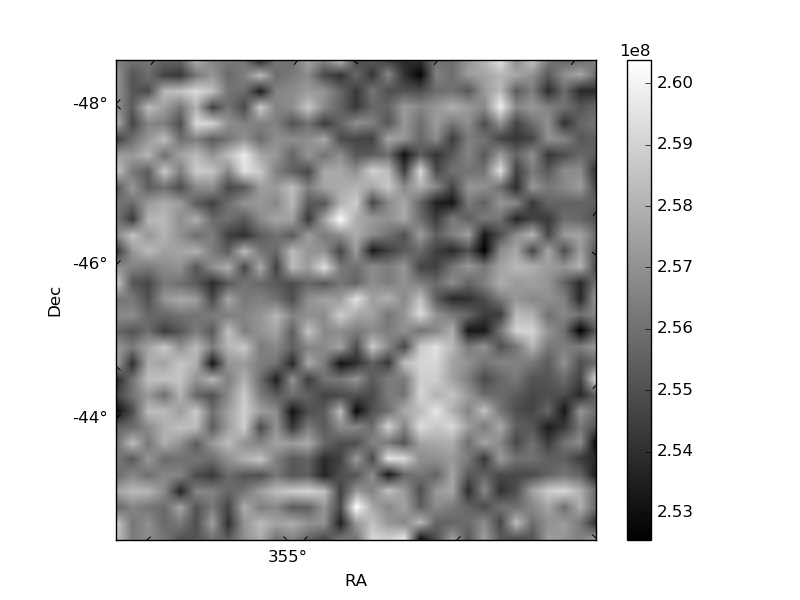
Histogram calculated using DETX and DETY for each event in the final _common_clean file
| Quadrant A | 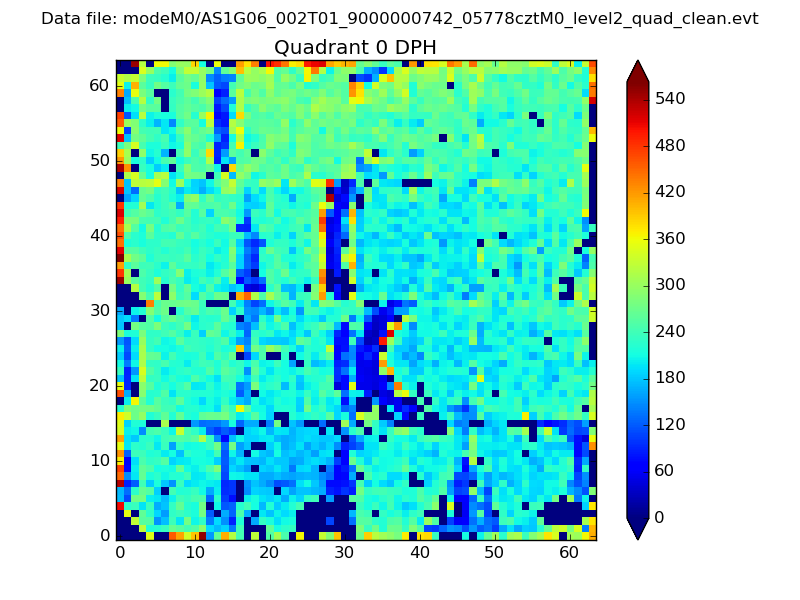 |
 |
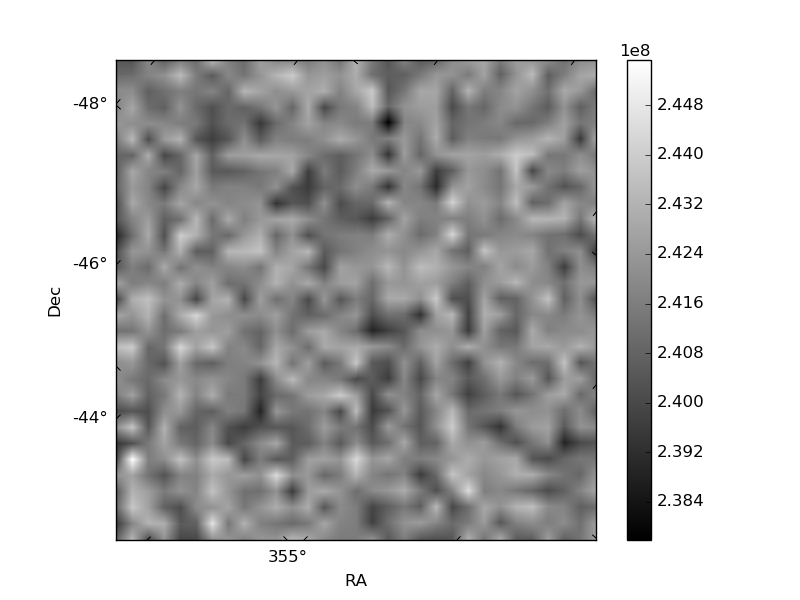
Quadrant B |
|---|---|---|---|
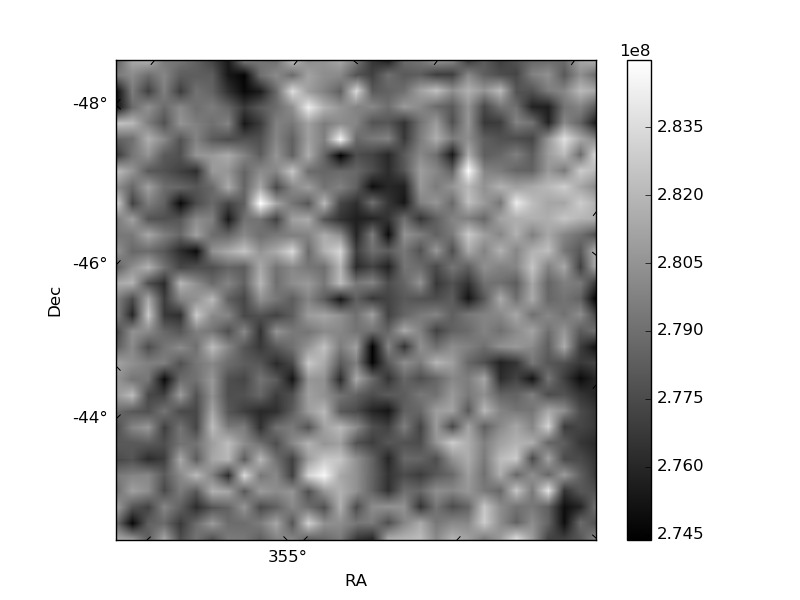
| Quadrant D | 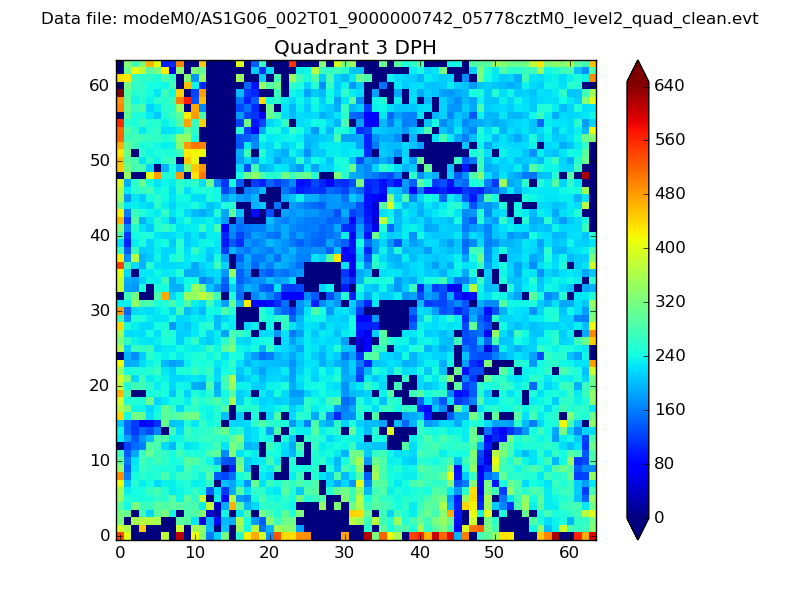 |
 |
Quadrant C |
| Plot type | Count rate plots | Images |
|---|---|---|
| Comparison with Poisson distribution Blue bars denote a histogram of data divided into 1 sec bins. Red curve is a Poisson curve with rate = median count rate of data. |
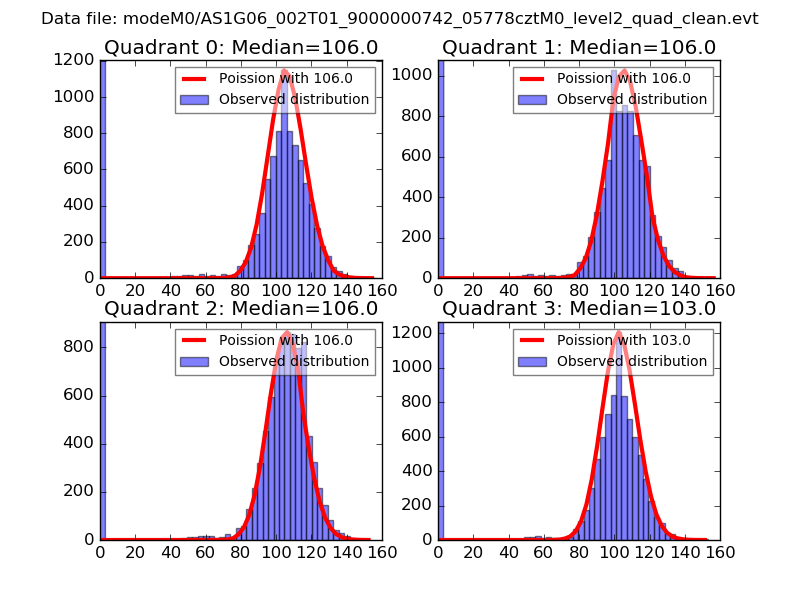 |
 |
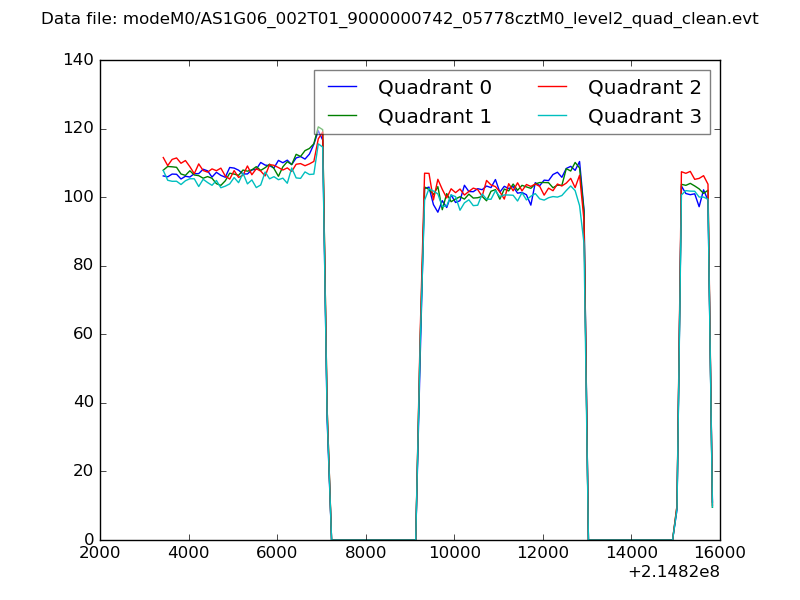
| Quadrant-wise count rates Data is divided into 100 sec bins |
 |
|
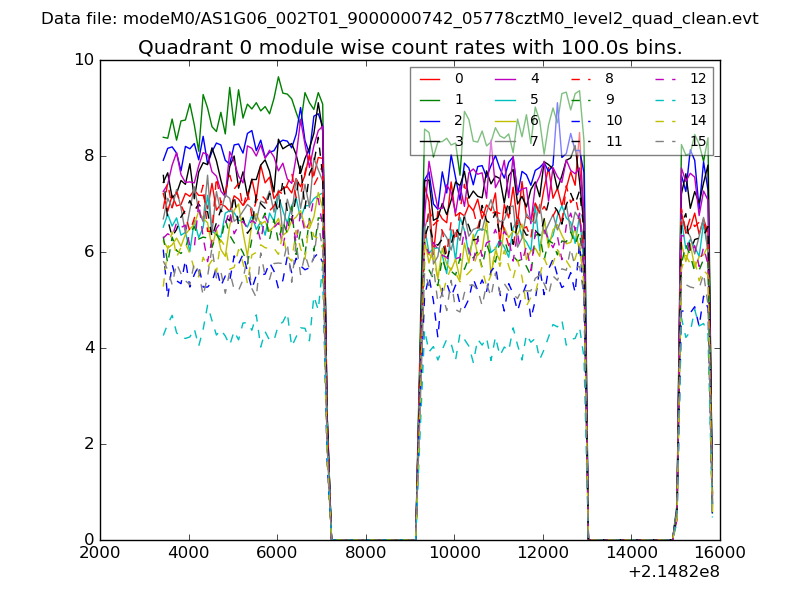
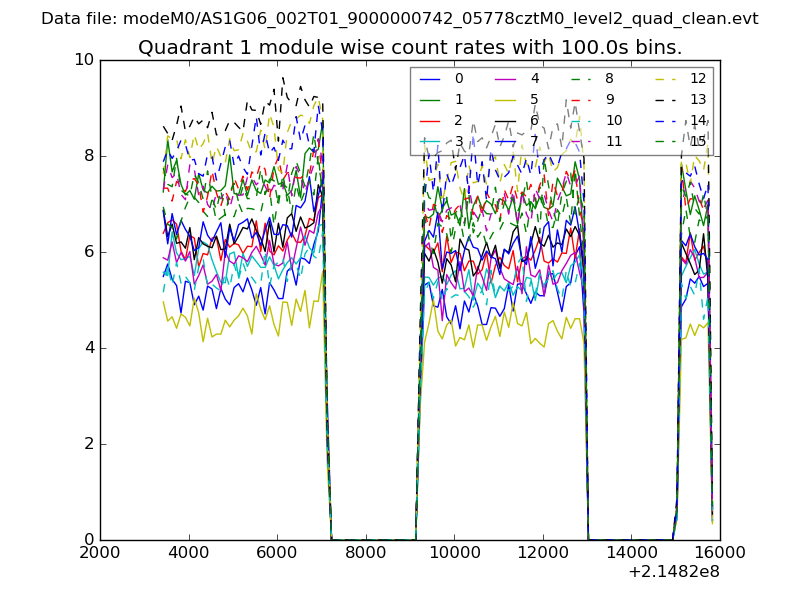
| Module-wise count rates for Quadrant A Data is divided into 100 sec bins |
 |
 |
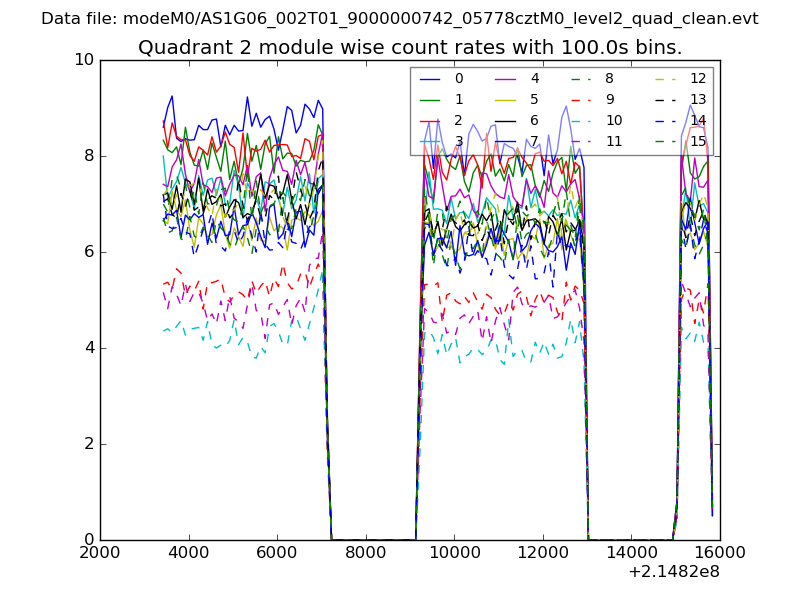
| Module-wise count rates for Quadrant B Data is divided into 100 sec bins |
 |
 |
| Module-wise count rates for Quadrant C Data is divided into 100 sec bins |
 |
 |
| Module-wise count rates for Quadrant D Data is divided into 100 sec bins |
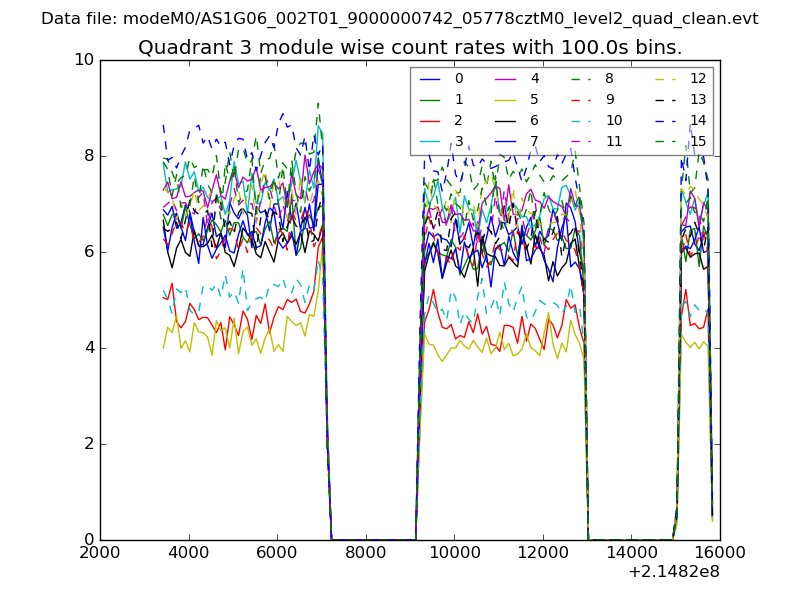 |
 |
| Parameter | Plot |
|---|---|
| CZT HV Monitor | 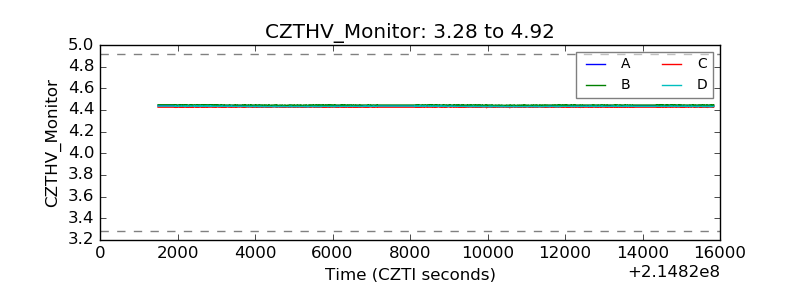 |
| D_VDD | 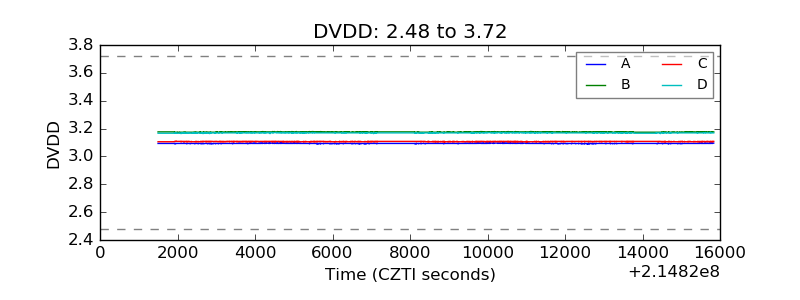 |
| Temperature 1 | 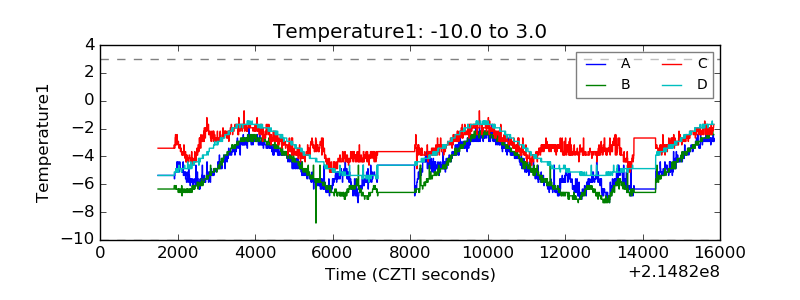 |
| Veto HV Monitor | 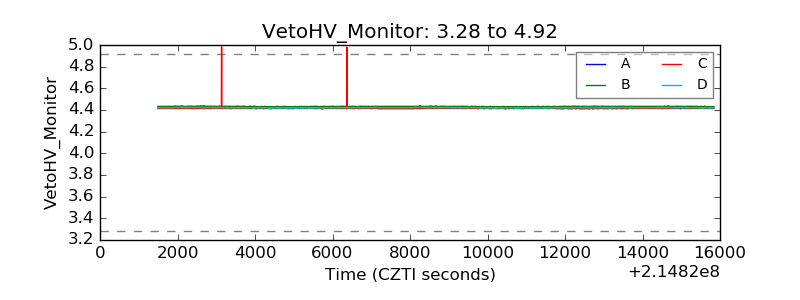 |
| Veto LLD | 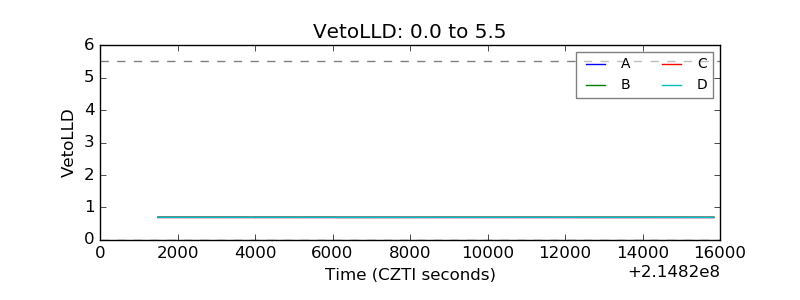 |
| Alpha Counter | 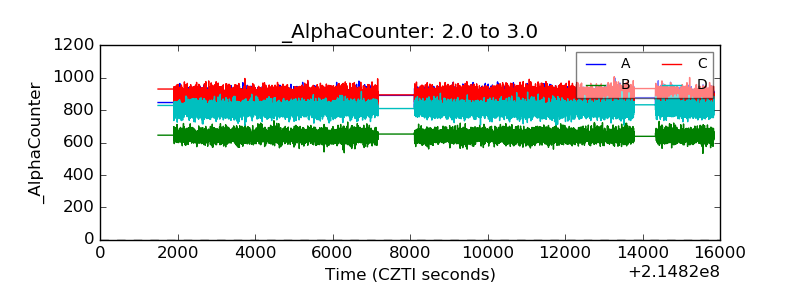 |
| _CPM_Rate | 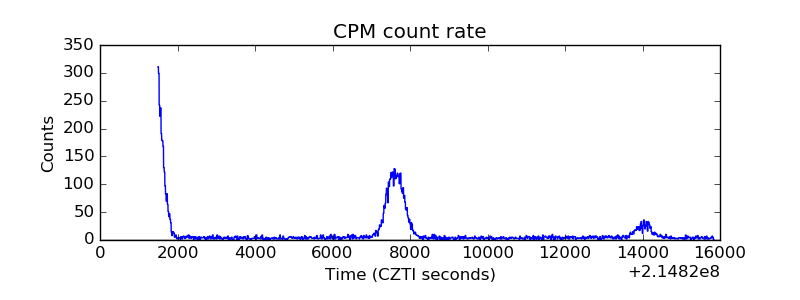 |
| CZT Counter | 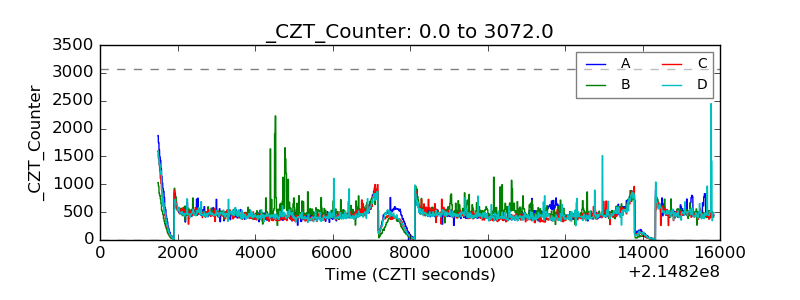 |
| +2.5 Volts monitor |  |
| +5 Volts monitor |  |
| _ROLL_ROT | 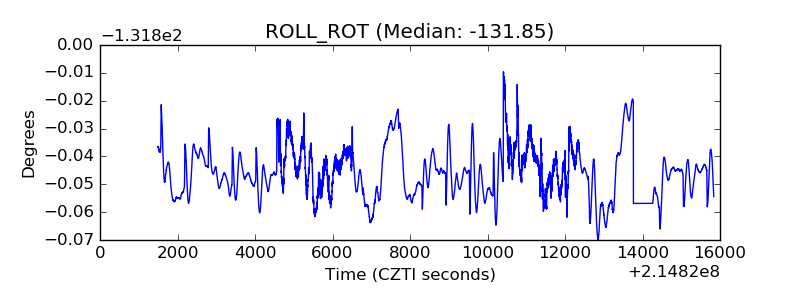 |
| _Roll_DEC |  |
| _Roll_RA | 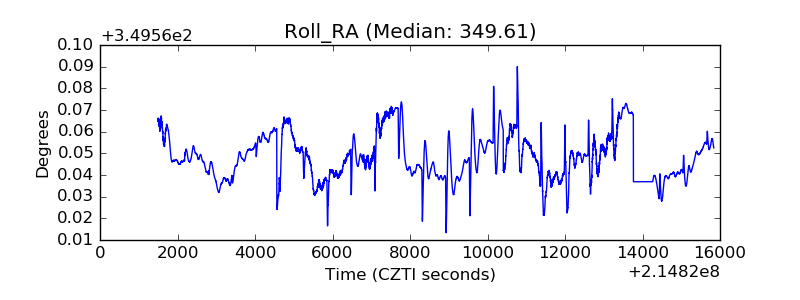 |
| Veto Counter | 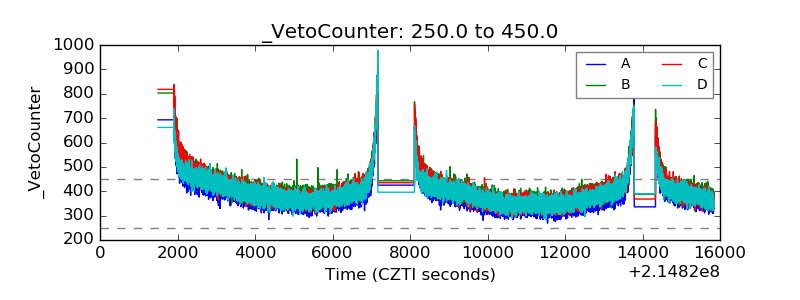 |