| Param | Original file | Final file |
|---|---|---|
| Filename | modeM0/AS1G06_002T01_9000000742_05779cztM0_level2.evt | modeM0/AS1G06_002T01_9000000742_05779cztM0_level2_quad_clean.evt |
| Size (bytes) | 464,558,400 | 80,899,200 |
| Size | 443.0 MB | 77.2 MB |
| Events in quadrant A | 3,492,222 | 489,443 |
| Events in quadrant B | 3,406,816 | 490,788 |
| Events in quadrant C | 3,258,607 | 491,185 |
| Events in quadrant D | 3,423,340 | 478,528 |
| Mode M0 | |||
|---|---|---|---|
| Quadrant | BADHDUFLAG | Total packets | Discarded packets |
| A | 0 | 15372 | 76 |
| B | 0 | 15010 | 78 |
| C | 0 | 14950 | 81 |
| D | 0 | 15363 | 63 |
| Mode M9 | |||
|---|---|---|---|
| Quadrant | BADHDUFLAG | Total packets | Discarded packets |
| A | 0 | 1 | 0 |
| B | 0 | 1 | 0 |
| C | 0 | 1 | 0 |
| D | 0 | 1 | 0 |
| Mode SS | |||
|---|---|---|---|
| Quadrant | BADHDUFLAG | Total packets | Discarded packets |
| A | 0 | 144 | 0 |
| B | 0 | 144 | 4 |
| C | 0 | 144 | 2 |
| D | 0 | 144 | 0 |
| Quadrant | Total seconds | Saturated seconds | Saturation percentage |
|---|---|---|---|
| A | 7187 | 160 | 2.226242% |
| B | 7186 | 160 | 2.226552% |
| C | 7184 | 70 | 0.974388% |
| D | 7194 | 50 | 0.695024% |
Noise dominated data is calculated using 1-second bins in cleaned event files. If a bin has >2000 counts, and if more than 50% of those come from <1% of pixels, then it is considered to be noise-dominated and hence unusable.
| Quadrant | # 1 sec bins | Bins with >0 counts | Bins with >2000 counts | High rate bins dominated by noise | Noise dominated (total time) | Noise dominated (detector-on time) | Marked lightcurve |
|---|---|---|---|---|---|---|---|
| A | 7239 | 7224 | 0 | 0 | 0.00% | 0.00% | 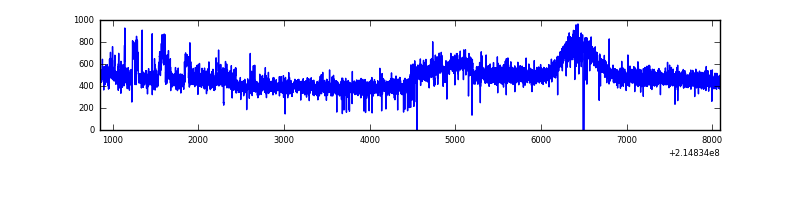 |
| B | 7238 | 7224 | 0 | 0 | 0.00% | 0.00% | 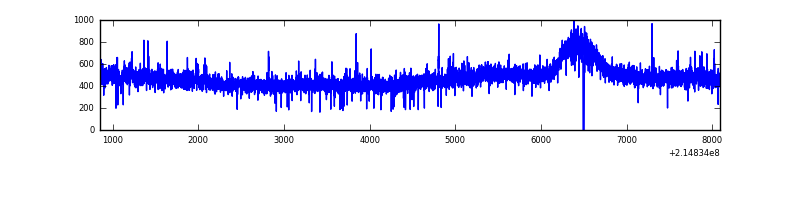 |
| C | 7239 | 7224 | 0 | 0 | 0.00% | 0.00% | 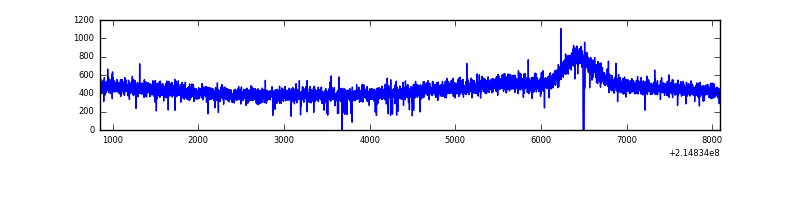 |
| D | 7239 | 7225 | 7 | 7 | 0.10% | 0.10% | 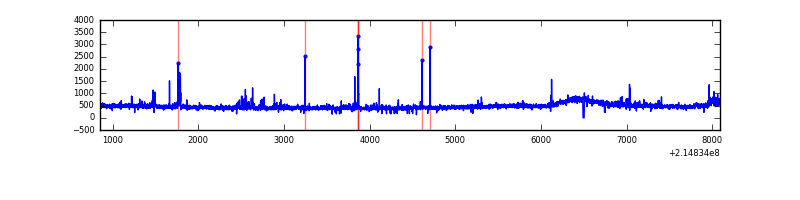 |
Top three noisy pixels from each quadrant. If the there are fewer than three noisy pixels in the level2.evt file, extra rows are filled as -1
| Pixel properties | Quadrant properties | ||||||
|---|---|---|---|---|---|---|---|
| Quadrant | DetID | PixID | Counts | Sigma | Mean | Median | Sigma |
| A | 15 | 79 | 123087 | 701.62 | 853 | 832 | 174.2 |
| A | 15 | 236 | 88296 | 501.96 | 853 | 832 | 174.2 |
| A | 12 | 194 | 8359 | 43.2 | 853 | 832 | 174.2 |
| B | 15 | 204 | 56063 | 330.5 | 861 | 840 | 167.1 |
| B | 12 | 111 | 16273 | 92.36 | 861 | 840 | 167.1 |
| B | 11 | 111 | 13039 | 73.01 | 861 | 840 | 167.1 |
| C | 13 | 61 | 6747 | 30.64 | 831 | 833 | 193.0 |
| C | 8 | 128 | 5455 | 23.95 | 831 | 833 | 193.0 |
| C | 8 | 222 | 4363 | 18.29 | 831 | 833 | 193.0 |
| D | 8 | 195 | 124747 | 600.95 | 836 | 809 | 206.2 |
| D | 10 | 15 | 40122 | 190.62 | 836 | 809 | 206.2 |
| D | 2 | 14 | 24423 | 114.5 | 836 | 809 | 206.2 |
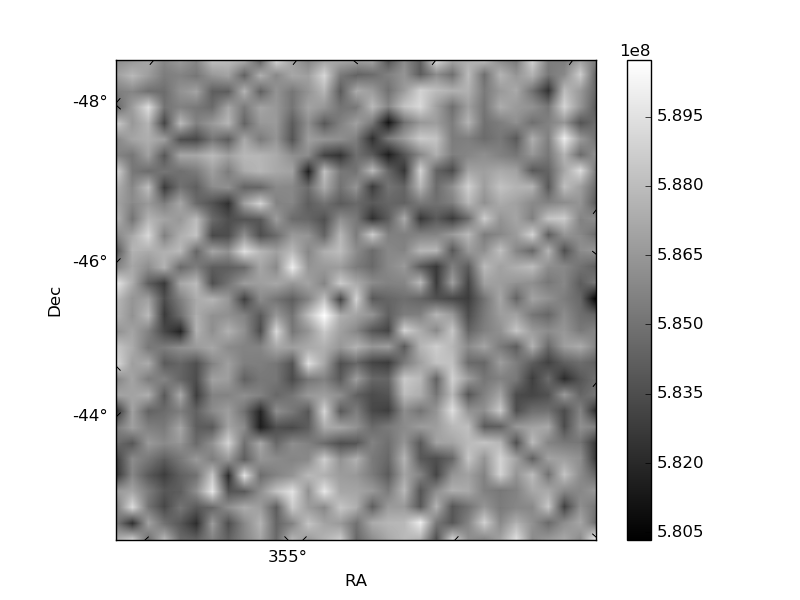
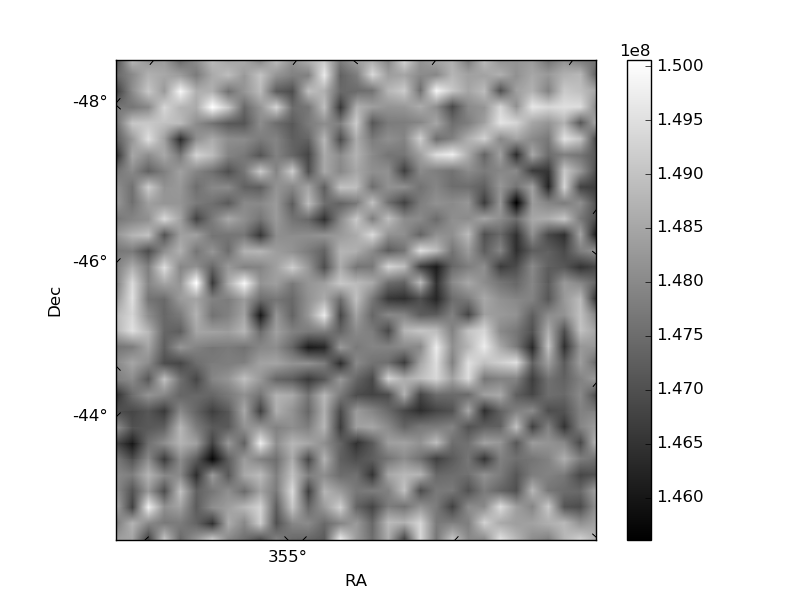
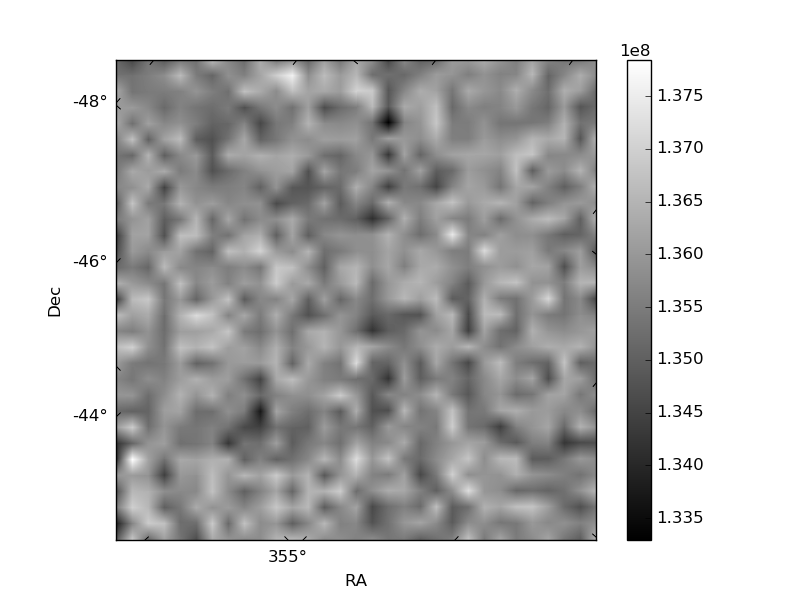
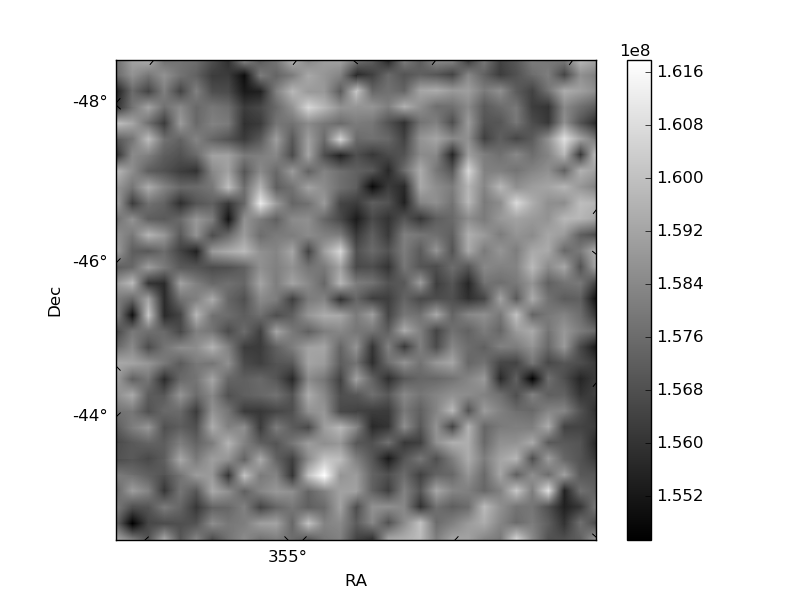
Histogram calculated using DETX and DETY for each event in the final _common_clean file
| Quadrant A | 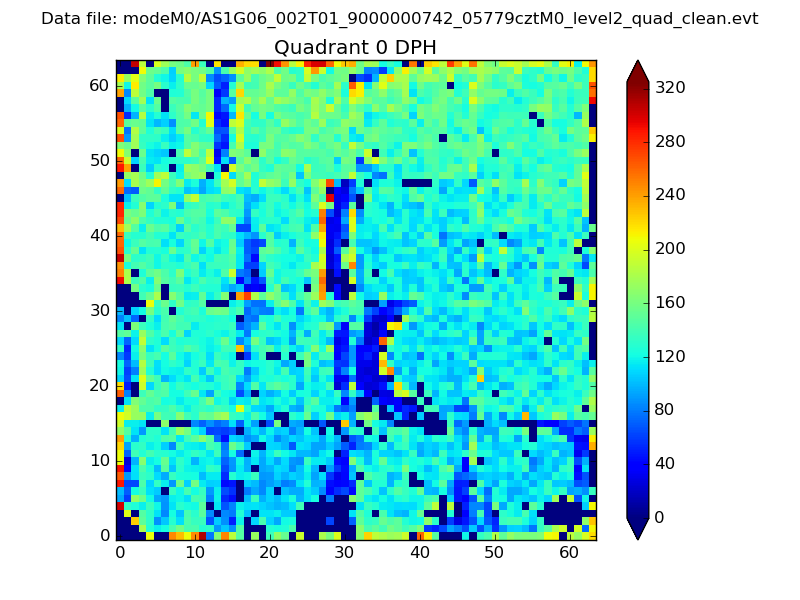 |
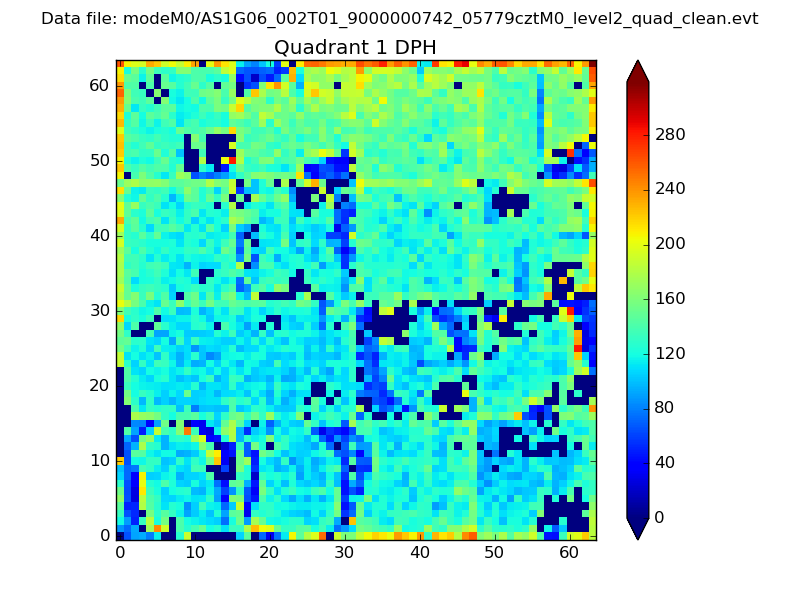 |
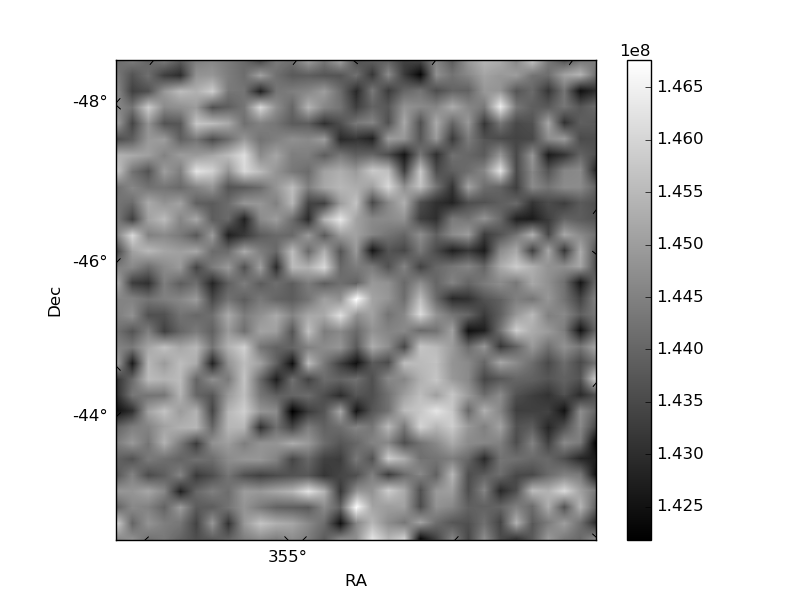
Quadrant B |
|---|---|---|---|
| Quadrant D | 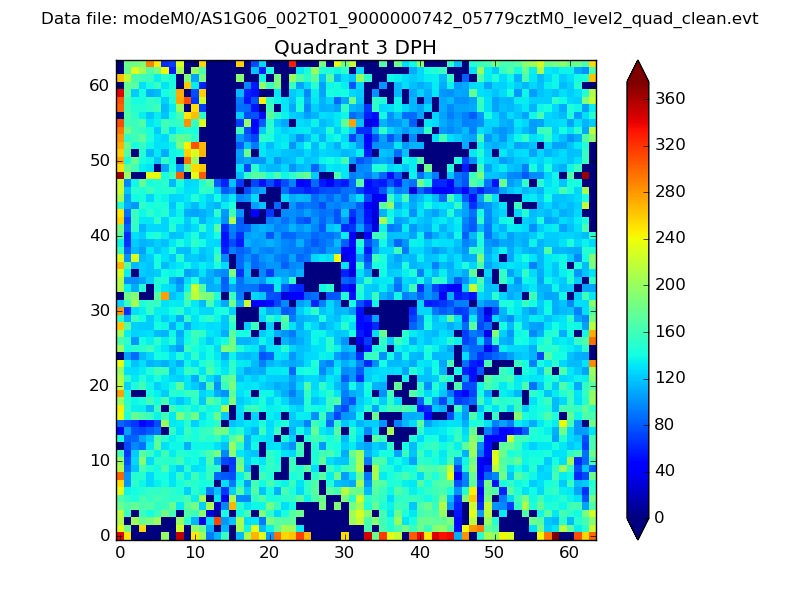 |
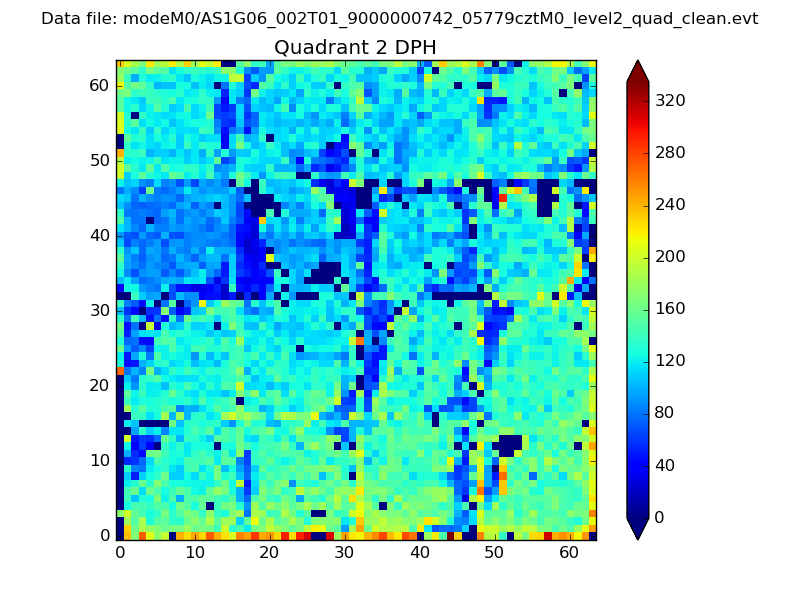 |
Quadrant C |
| Plot type | Count rate plots | Images |
|---|---|---|
| Comparison with Poisson distribution Blue bars denote a histogram of data divided into 1 sec bins. Red curve is a Poisson curve with rate = median count rate of data. |
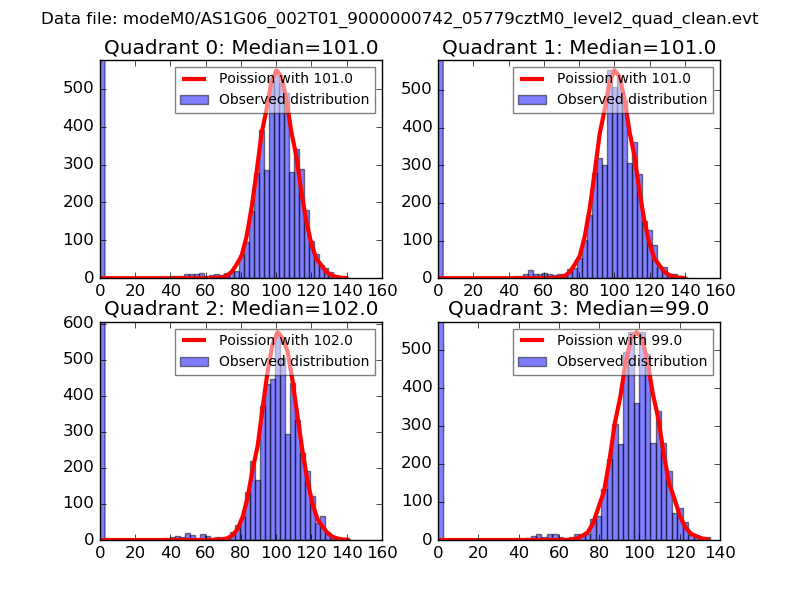 |
 |
| Quadrant-wise count rates Data is divided into 100 sec bins |
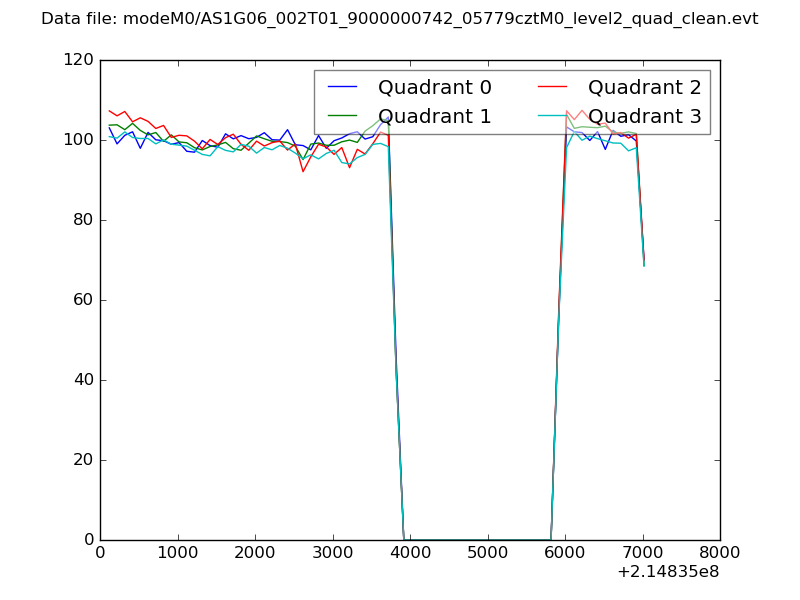 |
|
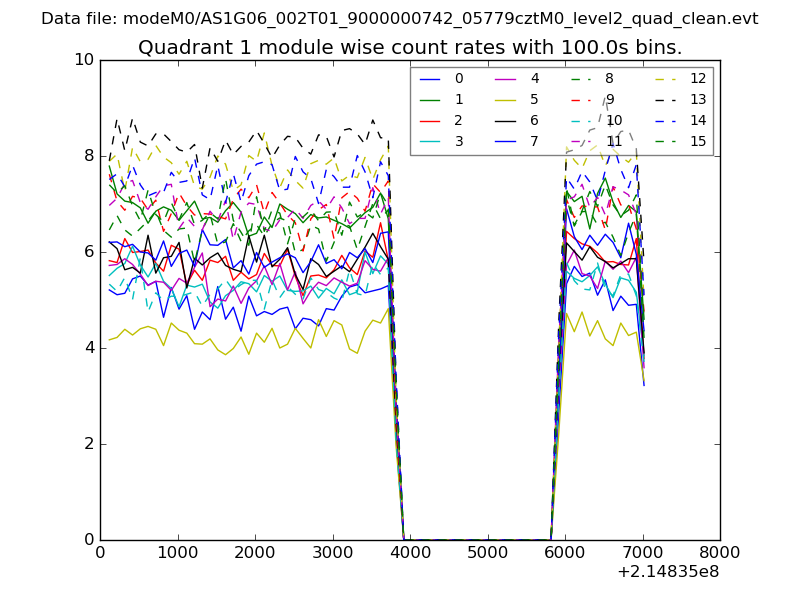
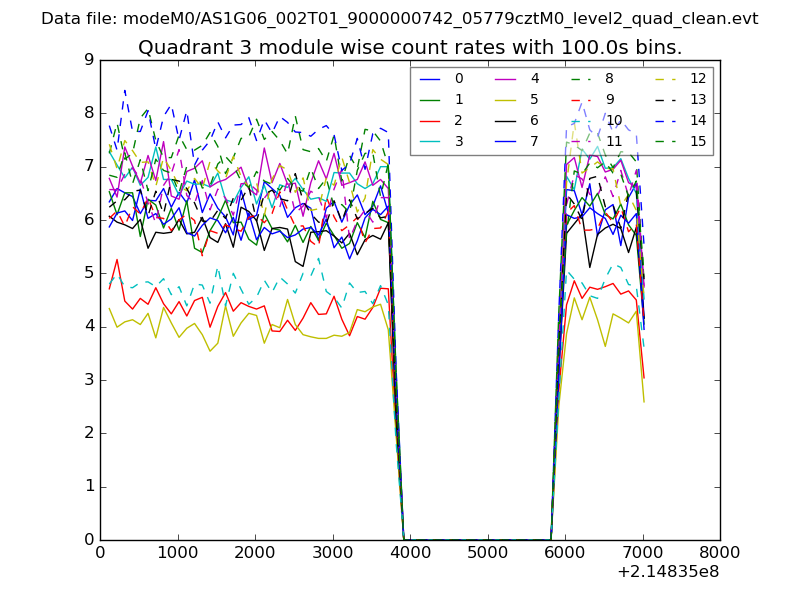
| Module-wise count rates for Quadrant A Data is divided into 100 sec bins |
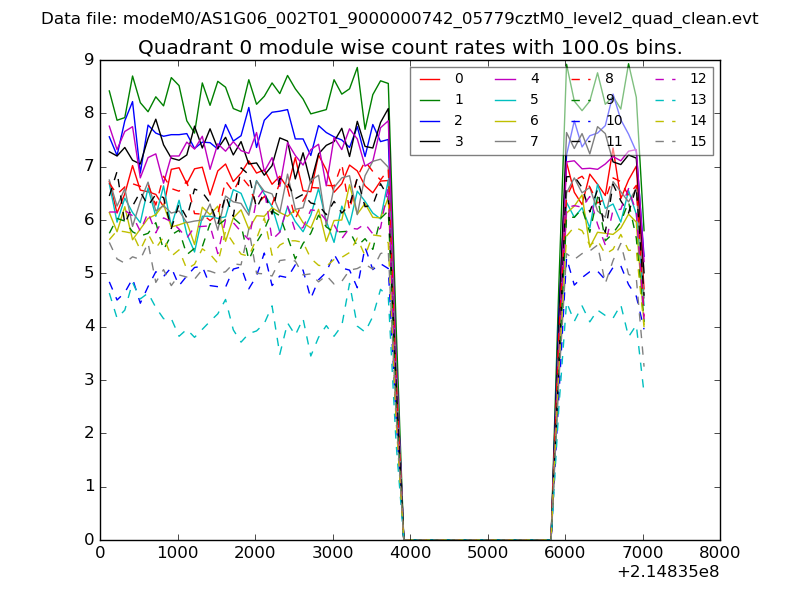 |
 |
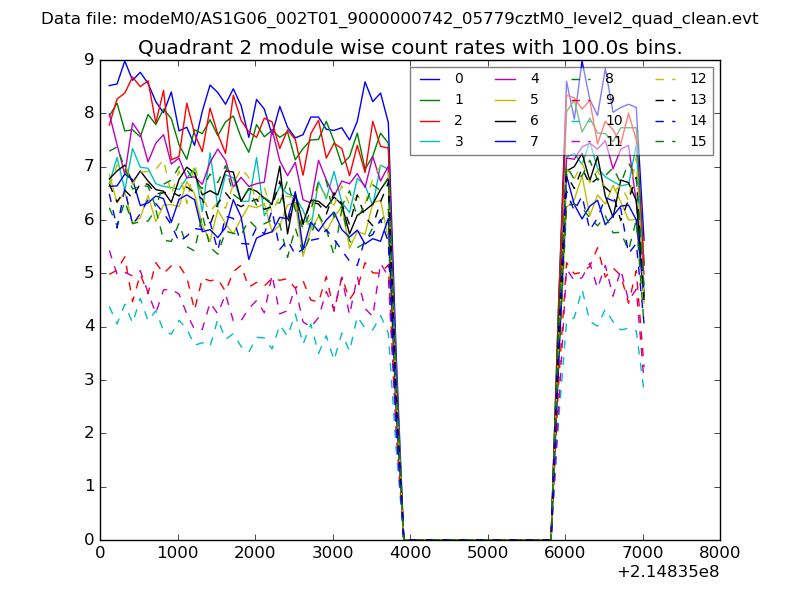
| Module-wise count rates for Quadrant B Data is divided into 100 sec bins |
 |
 |
| Module-wise count rates for Quadrant C Data is divided into 100 sec bins |
 |
 |
| Module-wise count rates for Quadrant D Data is divided into 100 sec bins |
 |
 |
| Parameter | Plot |
|---|---|
| CZT HV Monitor | 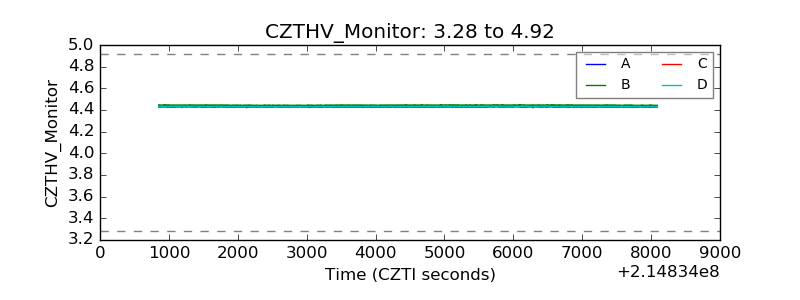 |
| D_VDD | 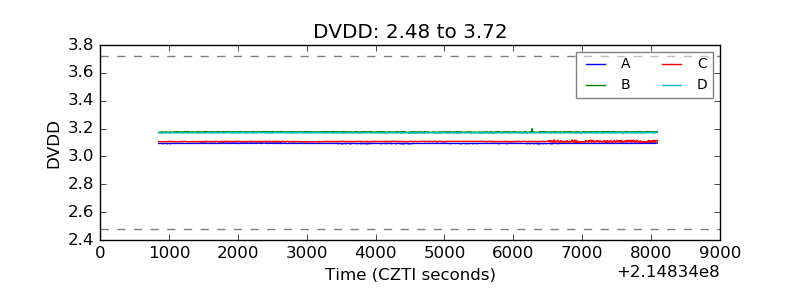 |
| Temperature 1 | 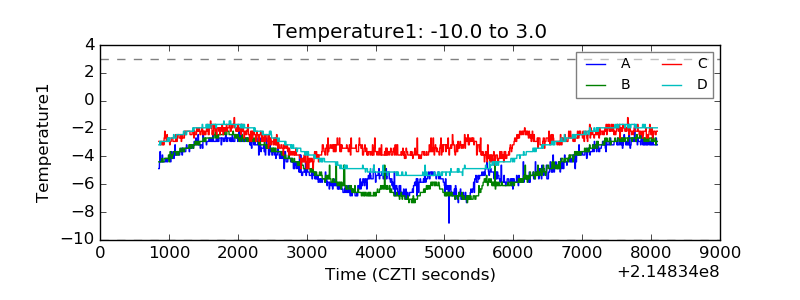 |
| Veto HV Monitor | 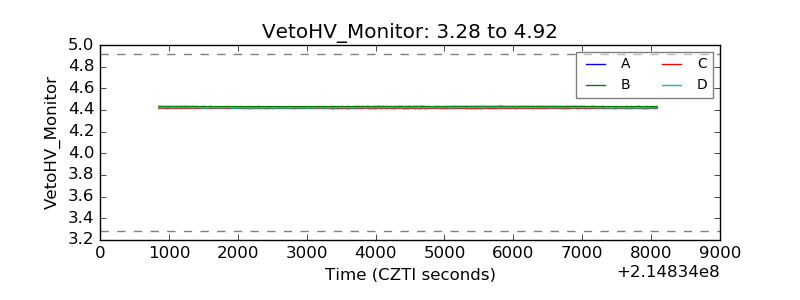 |
| Veto LLD | 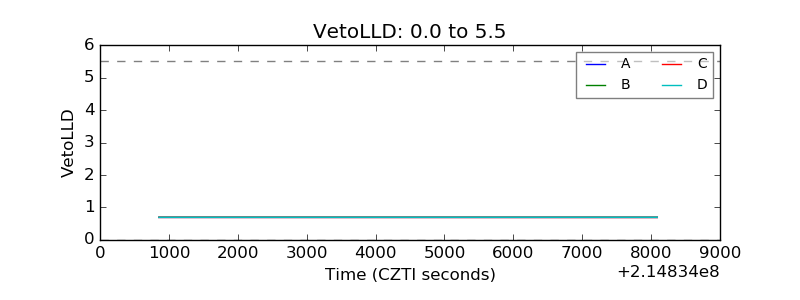 |
| Alpha Counter | 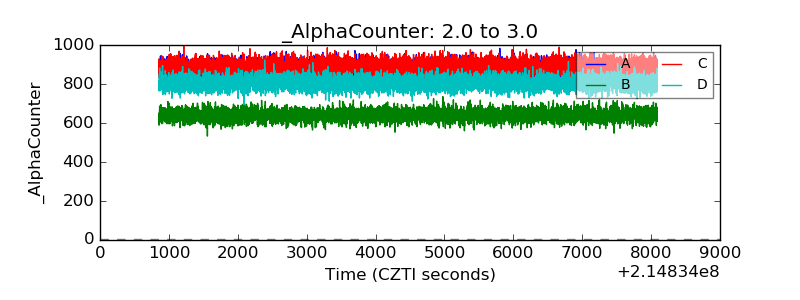 |
| _CPM_Rate | 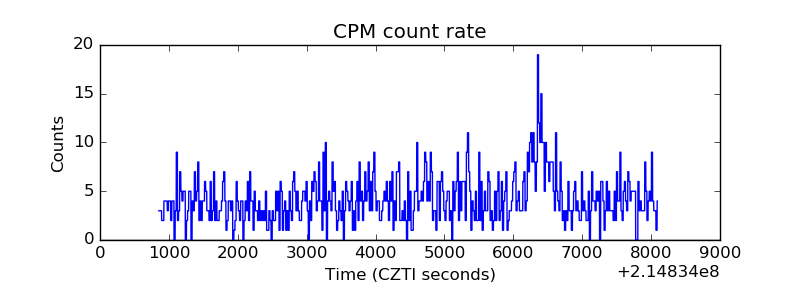 |
| CZT Counter | 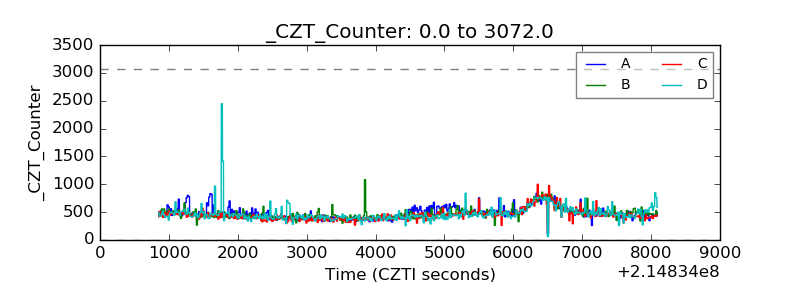 |
| +2.5 Volts monitor |  |
| +5 Volts monitor |  |
| _ROLL_ROT | 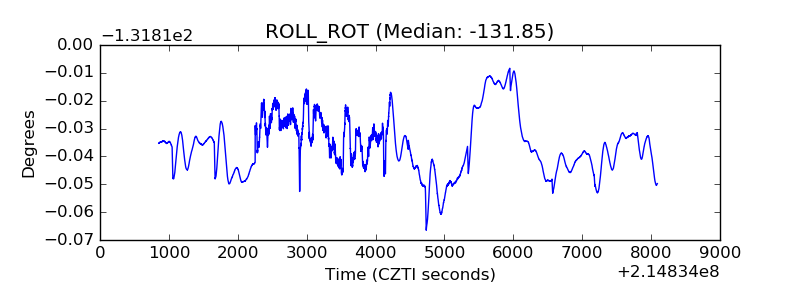 |
| _Roll_DEC | 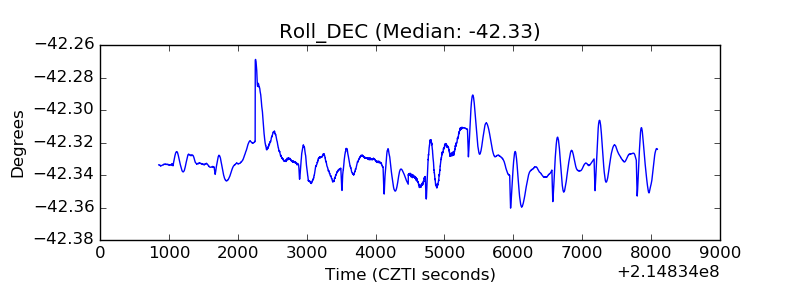 |
| _Roll_RA | 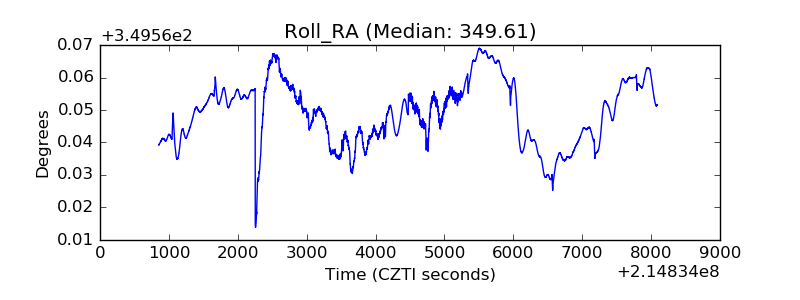 |
| Veto Counter | 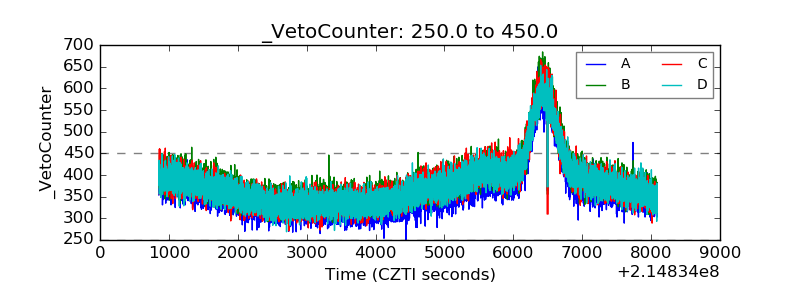 |