| Param | Original file | Final file |
|---|---|---|
| Filename | modeM0/AS1G06_002T01_9000000742_05780cztM0_level2.evt | modeM0/AS1G06_002T01_9000000742_05780cztM0_level2_quad_clean.evt |
| Size (bytes) | 220,668,480 | 41,883,840 |
| Size | 210.4 MB | 39.9 MB |
| Events in quadrant A | 1,567,060 | 258,088 |
| Events in quadrant B | 1,666,022 | 260,667 |
| Events in quadrant C | 1,538,933 | 260,981 |
| Events in quadrant D | 1,683,453 | 252,804 |
| Mode M0 | |||
|---|---|---|---|
| Quadrant | BADHDUFLAG | Total packets | Discarded packets |
| A | 0 | 7103 | 3 |
| B | 0 | 7196 | 3 |
| C | 0 | 7098 | 3 |
| D | 0 | 7350 | 5 |
| Mode M9 | |||
|---|---|---|---|
| Quadrant | BADHDUFLAG | Total packets | Discarded packets |
| A | 0 | 1 | 0 |
| B | 0 | 1 | 0 |
| C | 0 | 1 | 0 |
| D | 0 | 1 | 0 |
| Mode SS | |||
|---|---|---|---|
| Quadrant | BADHDUFLAG | Total packets | Discarded packets |
| A | 0 | 66 | 0 |
| B | 0 | 66 | 0 |
| C | 0 | 66 | 0 |
| D | 0 | 66 | 0 |
| Quadrant | Total seconds | Saturated seconds | Saturation percentage |
|---|---|---|---|
| A | 3323 | 153 | 4.604273% |
| B | 3323 | 157 | 4.724646% |
| C | 3323 | 67 | 2.016250% |
| D | 3322 | 41 | 1.234196% |
Noise dominated data is calculated using 1-second bins in cleaned event files. If a bin has >2000 counts, and if more than 50% of those come from <1% of pixels, then it is considered to be noise-dominated and hence unusable.
| Quadrant | # 1 sec bins | Bins with >0 counts | Bins with >2000 counts | High rate bins dominated by noise | Noise dominated (total time) | Noise dominated (detector-on time) | Marked lightcurve |
|---|---|---|---|---|---|---|---|
| A | 3339 | 3325 | 0 | 0 | 0.00% | 0.00% |  |
| B | 3339 | 3325 | 1 | 1 | 0.03% | 0.03% | 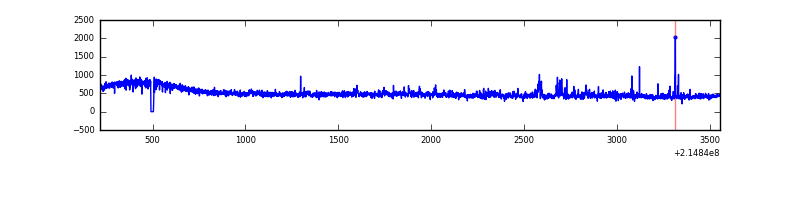 |
| C | 3339 | 3325 | 0 | 0 | 0.00% | 0.00% | 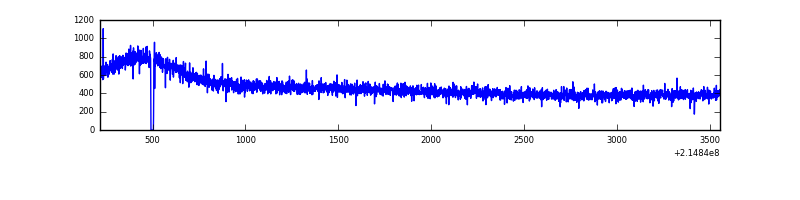 |
| D | 3339 | 3325 | 0 | 0 | 0.00% | 0.00% | 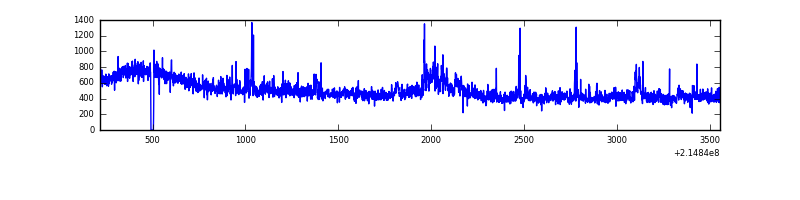 |
Top three noisy pixels from each quadrant. If the there are fewer than three noisy pixels in the level2.evt file, extra rows are filled as -1
| Pixel properties | Quadrant properties | ||||||
|---|---|---|---|---|---|---|---|
| Quadrant | DetID | PixID | Counts | Sigma | Mean | Median | Sigma |
| A | 12 | 194 | 3916 | 41.33 | 406 | 395 | 85.2 |
| A | 0 | 226 | 3872 | 40.81 | 406 | 395 | 85.2 |
| A | 15 | 79 | 2235 | 21.6 | 406 | 395 | 85.2 |
| B | 15 | 204 | 65828 | 804.68 | 407 | 396 | 81.3 |
| B | 12 | 111 | 7793 | 90.97 | 407 | 396 | 81.3 |
| B | 4 | 81 | 7633 | 89.0 | 407 | 396 | 81.3 |
| C | 8 | 128 | 8787 | 91.81 | 389 | 389 | 91.5 |
| C | 1 | 16 | 3965 | 39.09 | 389 | 389 | 91.5 |
| C | 8 | 112 | 3842 | 37.75 | 389 | 389 | 91.5 |
| D | 8 | 195 | 150661 | 1530.12 | 393 | 378 | 98.2 |
| D | 10 | 15 | 26494 | 265.9 | 393 | 378 | 98.2 |
| D | 2 | 136 | 14980 | 148.67 | 393 | 378 | 98.2 |
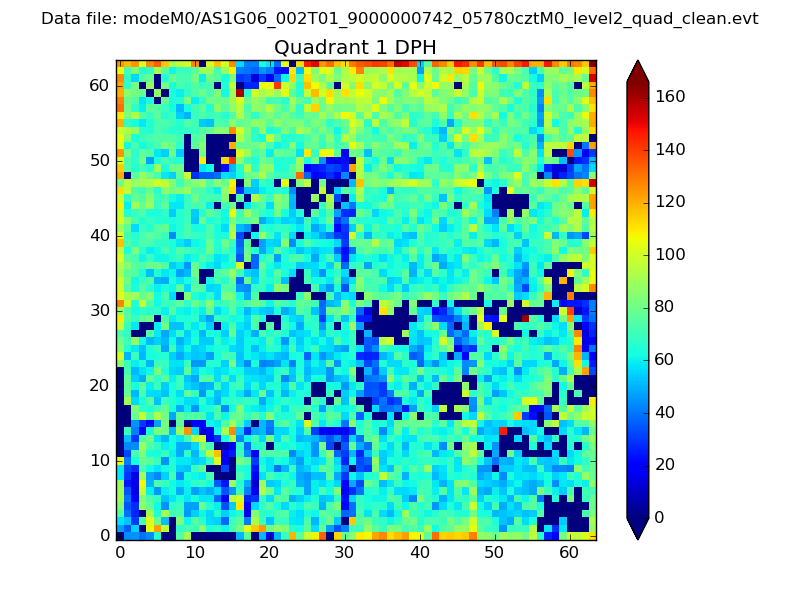
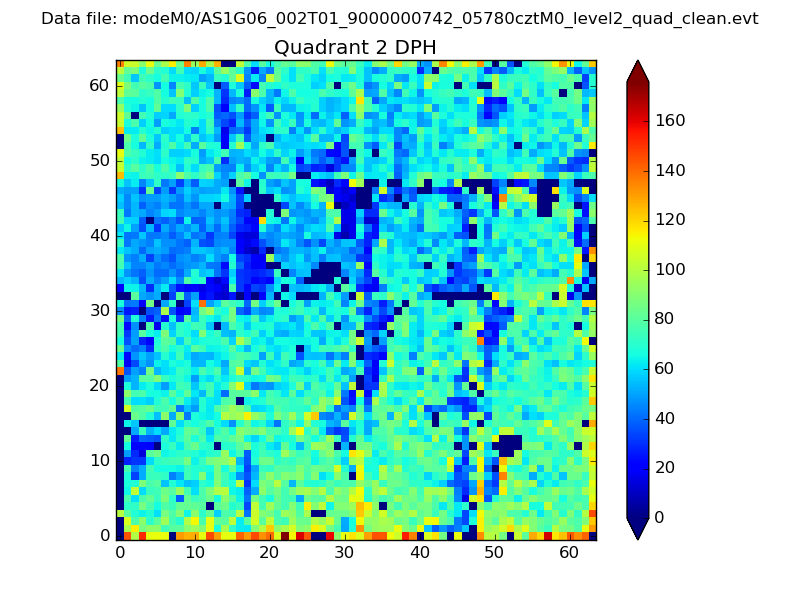
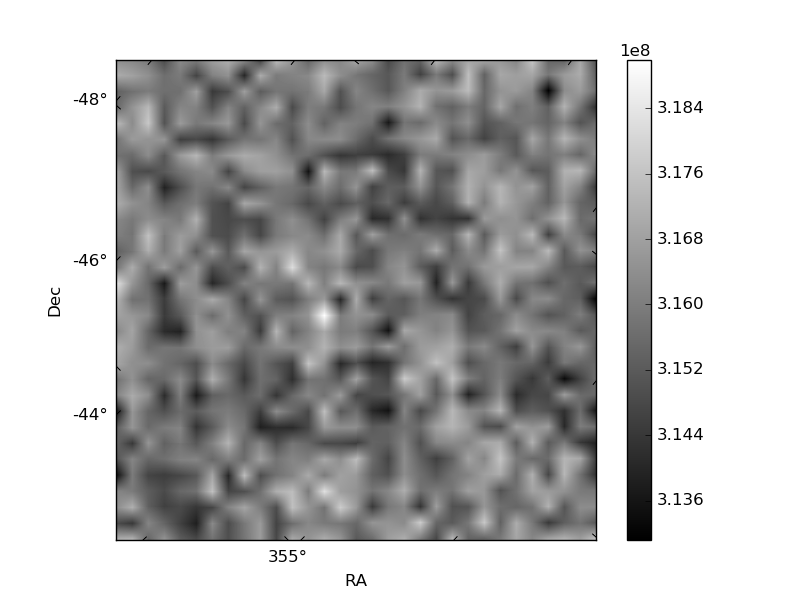
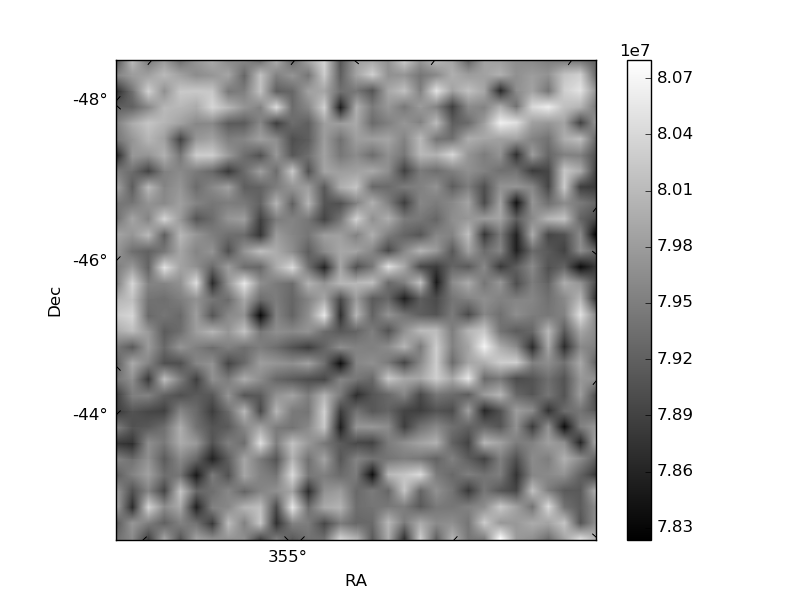
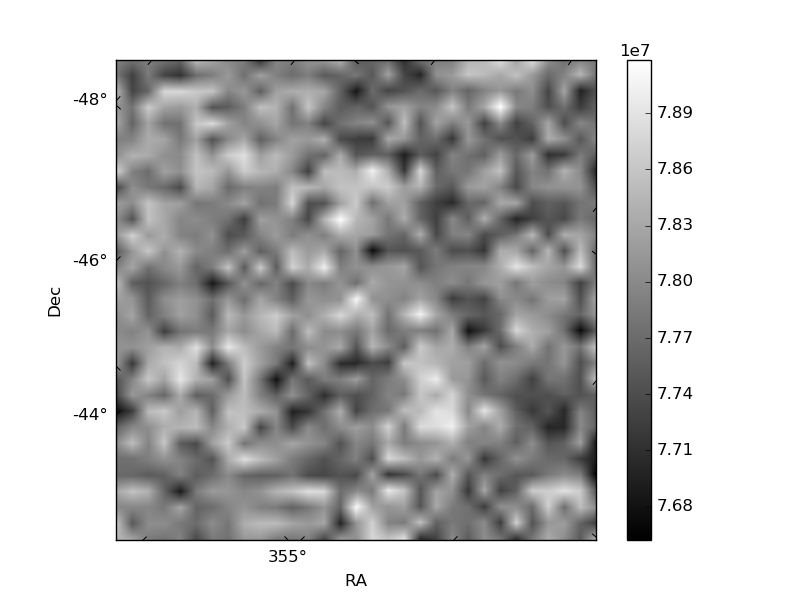
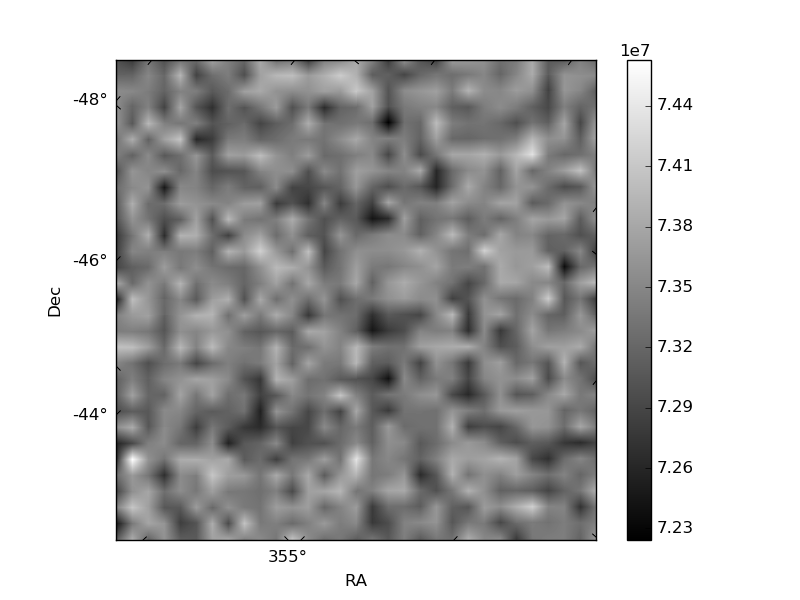
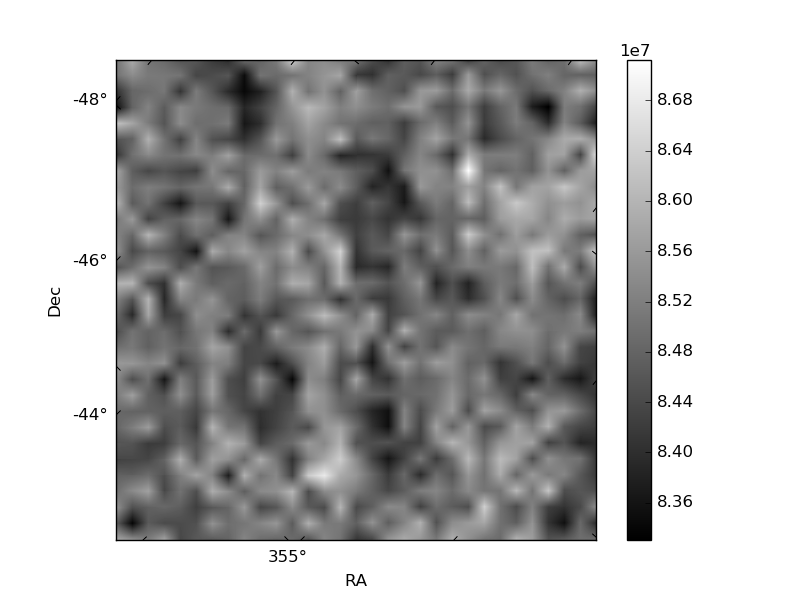
Histogram calculated using DETX and DETY for each event in the final _common_clean file
| Quadrant A | 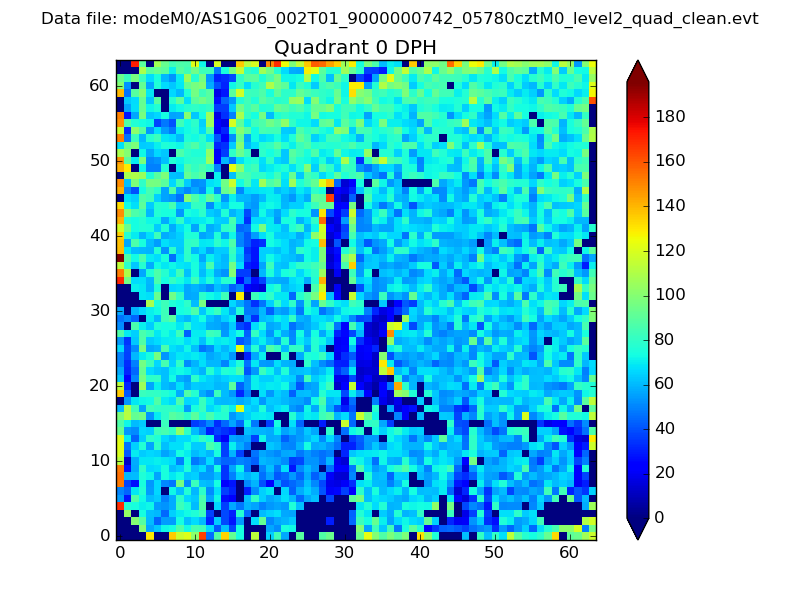 |
 |
Quadrant B |
|---|---|---|---|
| Quadrant D | 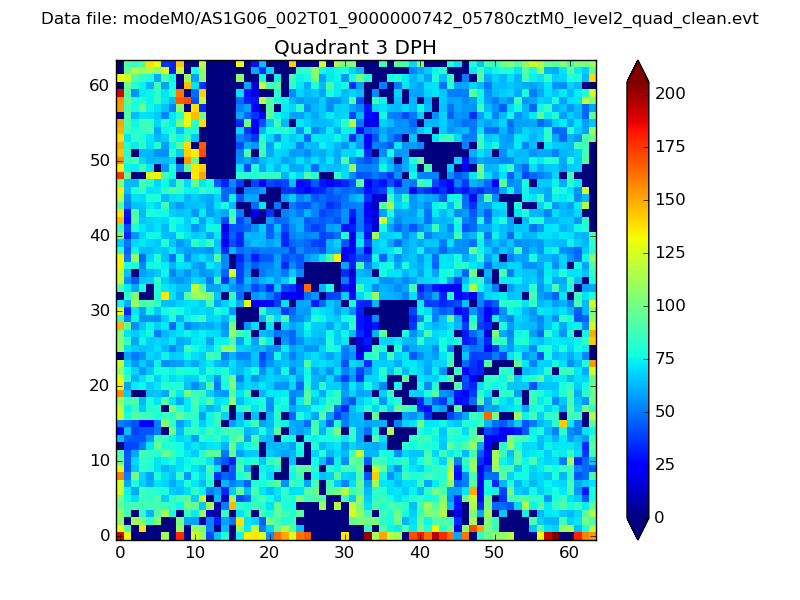 |
 |
Quadrant C |
| Plot type | Count rate plots | Images |
|---|---|---|
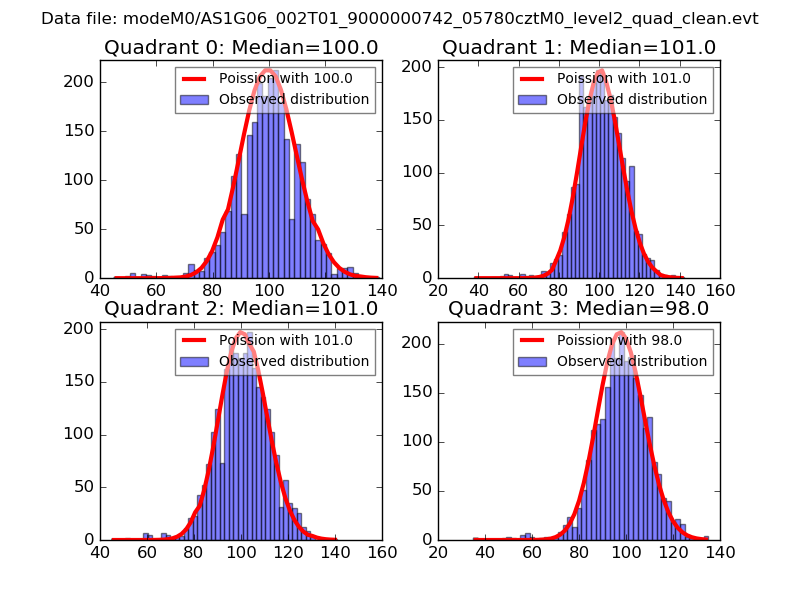
| Comparison with Poisson distribution Blue bars denote a histogram of data divided into 1 sec bins. Red curve is a Poisson curve with rate = median count rate of data. |
 |
 |
| Quadrant-wise count rates Data is divided into 100 sec bins |
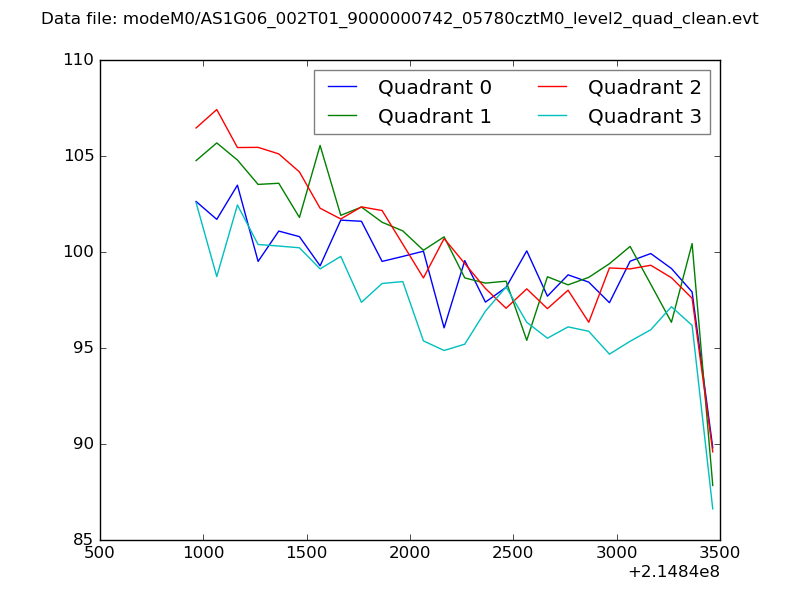 |
|
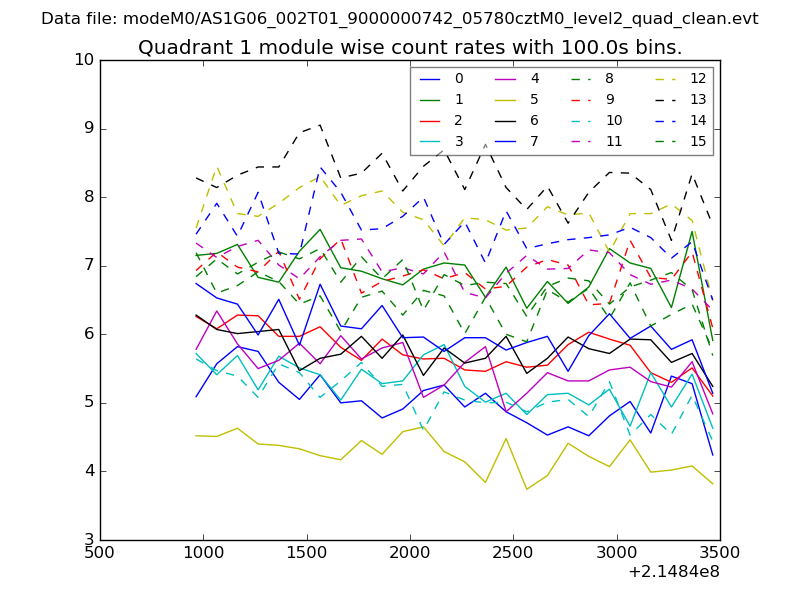
| Module-wise count rates for Quadrant A Data is divided into 100 sec bins |
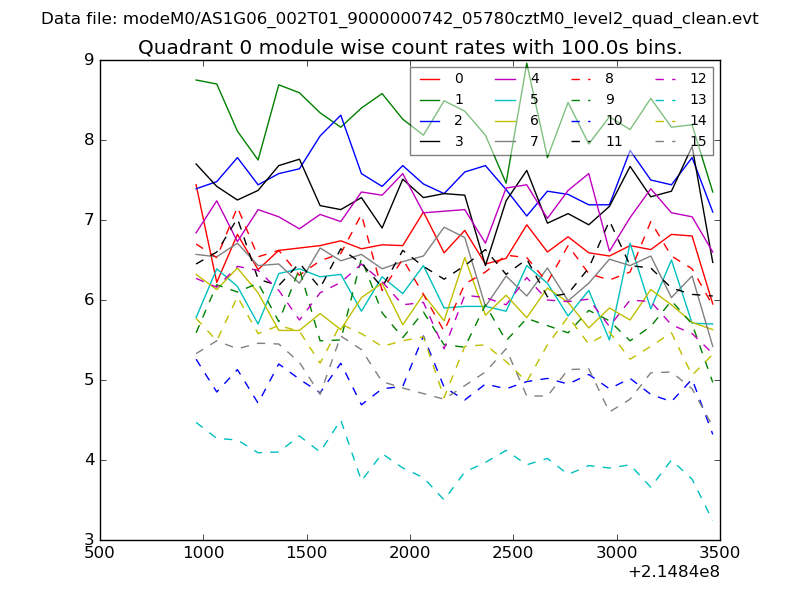 |
 |
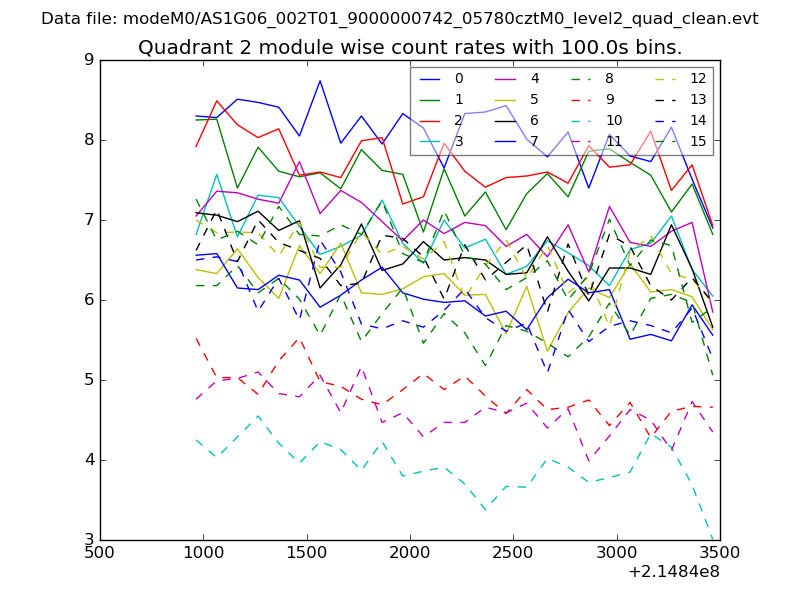
| Module-wise count rates for Quadrant B Data is divided into 100 sec bins |
 |
 |
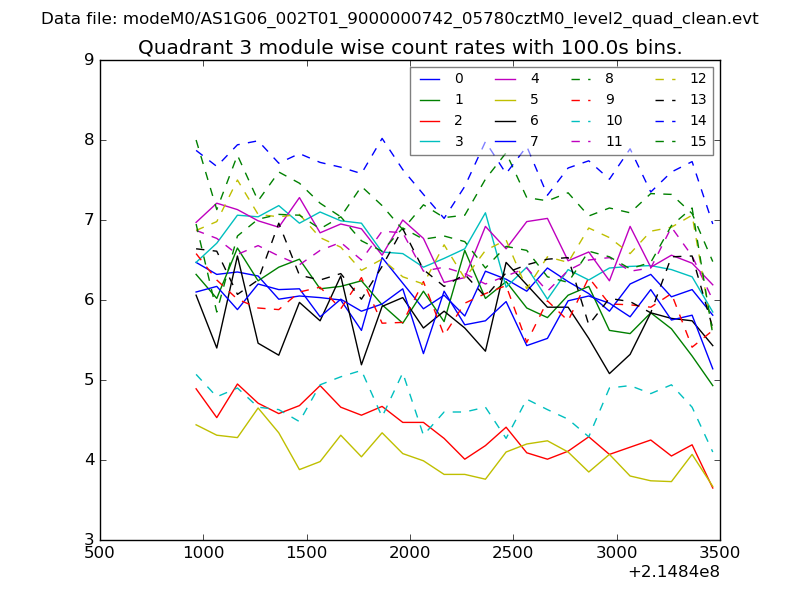
| Module-wise count rates for Quadrant C Data is divided into 100 sec bins |
 |
 |
| Module-wise count rates for Quadrant D Data is divided into 100 sec bins |
 |
 |
| Parameter | Plot |
|---|---|
| CZT HV Monitor | 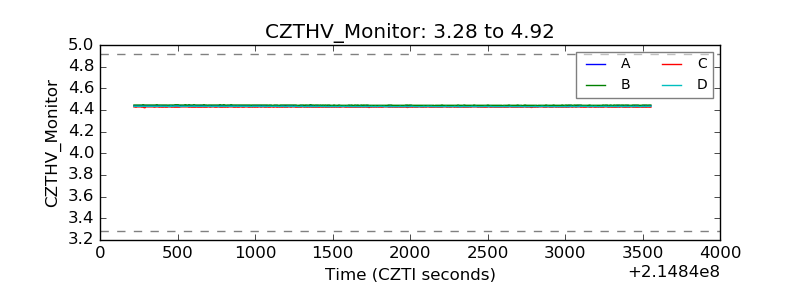 |
| D_VDD |  |
| Temperature 1 | 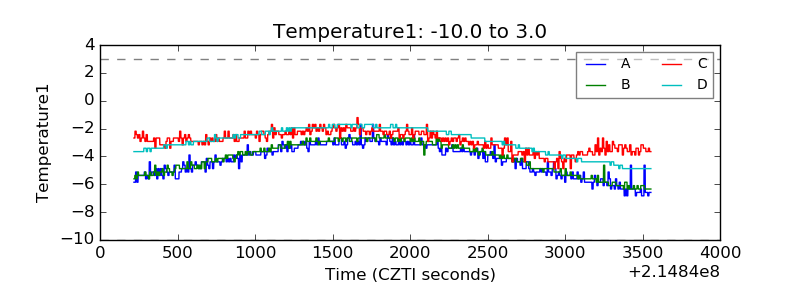 |
| Veto HV Monitor | 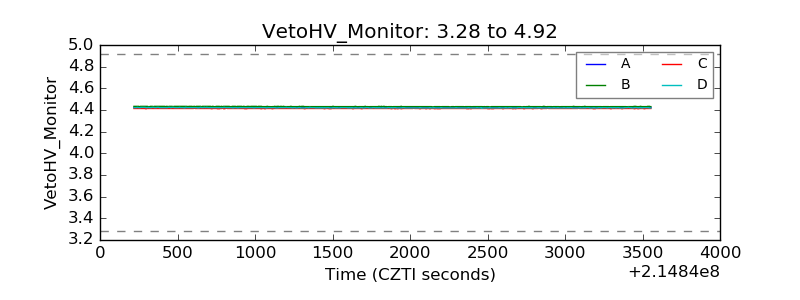 |
| Veto LLD | 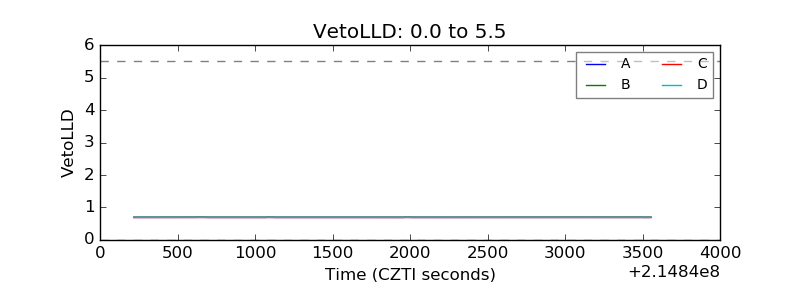 |
| Alpha Counter | 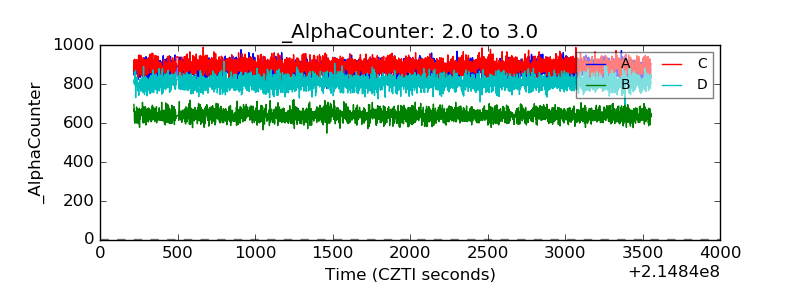 |
| _CPM_Rate | 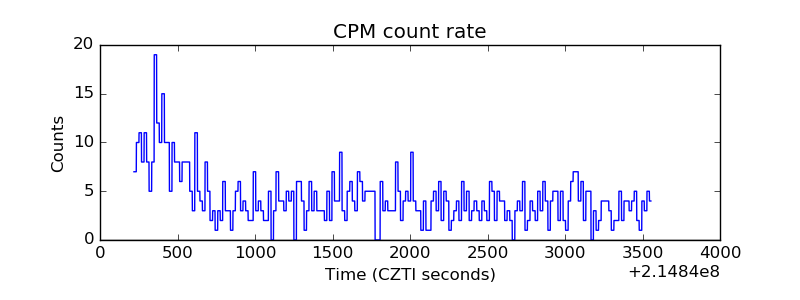 |
| CZT Counter | 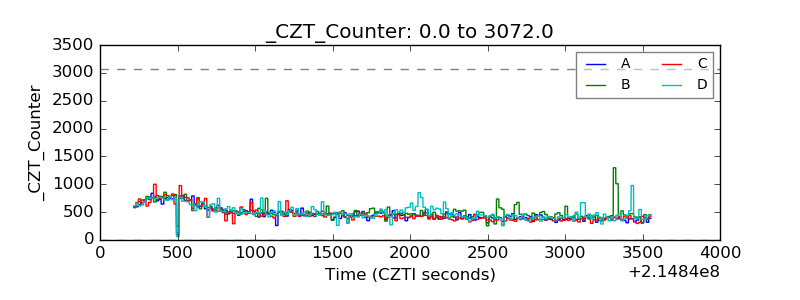 |
| +2.5 Volts monitor |  |
| +5 Volts monitor |  |
| _ROLL_ROT | 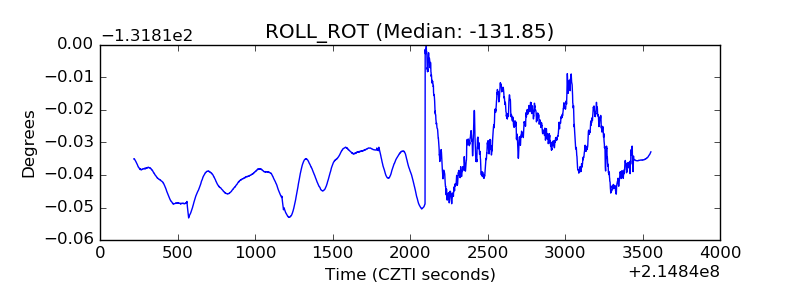 |
| _Roll_DEC | 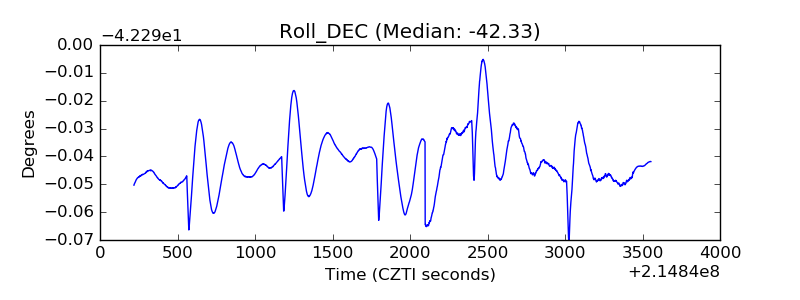 |
| _Roll_RA | 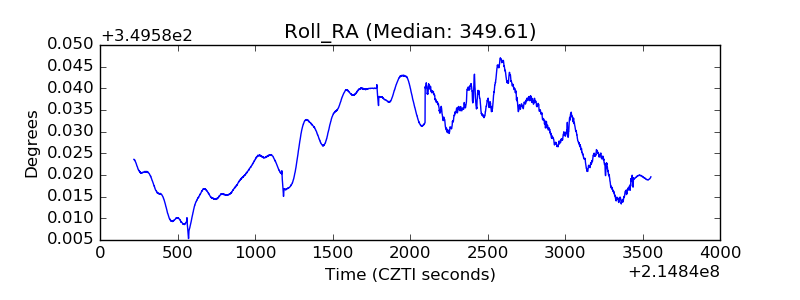 |
| Veto Counter | 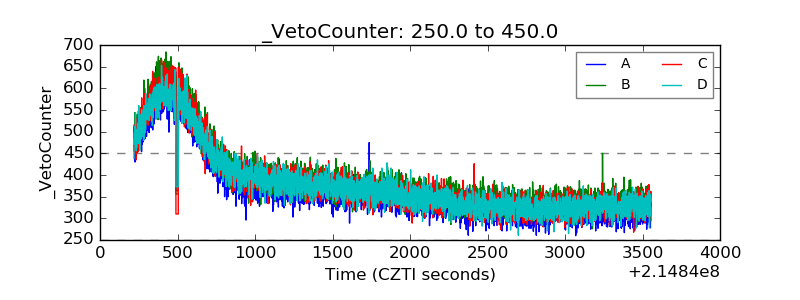 |