| Param | Original file | Final file |
|---|---|---|
| Filename | modeM0/AS1A02_106T01_9000000744cztM0_level2.fits | modeM0/AS1A02_106T01_9000000744cztM0_level2_quad_clean.evt |
| Size (bytes) | 944,000,640 | 918,648,000 |
| Size | 900.3 MB | 876.1 MB |
| Events in quadrant A | 5,649,676 | 5,376,967 |
| Events in quadrant B | 5,543,826 | 5,497,083 |
| Events in quadrant C | 5,593,208 | 5,181,856 |
| Events in quadrant D | 4,772,006 | 4,736,806 |
| Mode M9 | |||
|---|---|---|---|
| Quadrant | BADHDUFLAG | Total packets | Discarded packets |
| A | 0 | 140 | 0 |
| B | 0 | 140 | 0 |
| C | 0 | 140 | 0 |
| D | 0 | 140 | 0 |
| Mode M0 | |||
|---|---|---|---|
| Quadrant | BADHDUFLAG | Total packets | Discarded packets |
| A | 0 | 211316 | 0 |
| B | 0 | 215099 | 0 |
| C | 0 | 209905 | 0 |
| D | 0 | 224984 | 0 |
| Mode SS | |||
|---|---|---|---|
| Quadrant | BADHDUFLAG | Total packets | Discarded packets |
| A | 0 | 2086 | 0 |
| B | 0 | 2086 | 0 |
| C | 0 | 2084 | 0 |
| D | 0 | 2086 | 0 |
| Quadrant | Total seconds | Saturated seconds | Saturation percentage |
|---|---|---|---|
| A | 102541 | 1335 | 1.301918% |
| B | 102559 | 1388 | 1.353367% |
| C | 102562 | 881 | 0.858993% |
| D | 102580 | 1950 | 1.900955% |
Noise dominated data is calculated using 1-second bins in cleaned event files. If a bin has >2000 counts, and if more than 50% of those come from <1% of pixels, then it is considered to be noise-dominated and hence unusable.
| Quadrant | # 1 sec bins | Bins with >0 counts | Bins with >2000 counts | High rate bins dominated by noise | Noise dominated (total time) | Noise dominated (detector-on time) | Marked lightcurve |
|---|---|---|---|---|---|---|---|
| A | 116845 | 102802 | 0 | 0 | 0.00% | 0.00% |  |
| B | 116845 | 102805 | 0 | 0 | 0.00% | 0.00% | 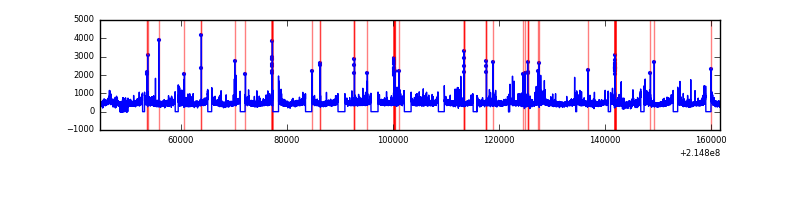 |
| C | 116845 | 102807 | 0 | 0 | 0.00% | 0.00% |  |
| D | 116845 | 102808 | 0 | 0 | 0.00% | 0.00% |  |
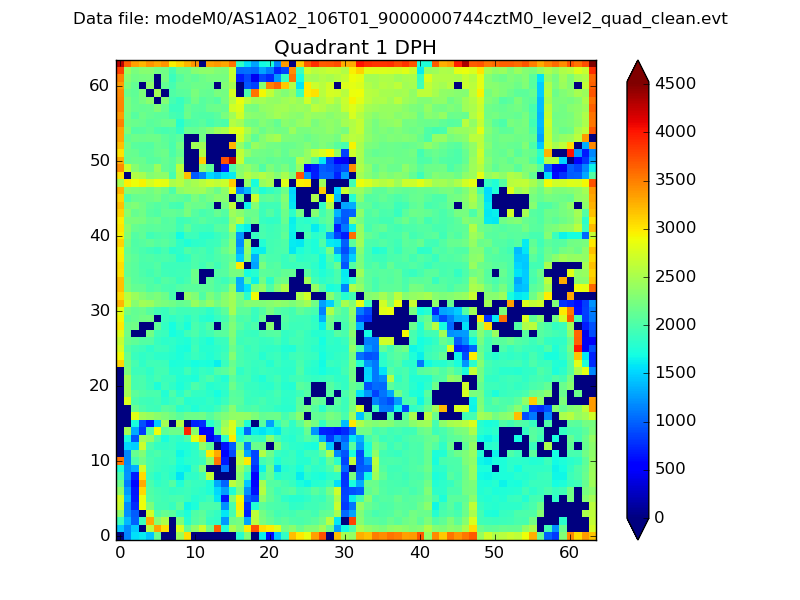
Top three noisy pixels from each quadrant. If the there are fewer than three noisy pixels in the level2.evt file, extra rows are filled as -1
| Pixel properties | Quadrant properties | ||||||
|---|---|---|---|---|---|---|---|
| Quadrant | DetID | PixID | Counts | Sigma | Mean | Median | Sigma |
| A | 14 | 188 | 5500 | 11.04 | 1467 | 1368 | 374.2 |
| A | 0 | 29 | 5233 | 10.33 | 1467 | 1368 | 374.2 |
| A | 14 | 204 | 4845 | 9.29 | 1467 | 1368 | 374.2 |
| B | 2 | 9 | 4760 | 11.68 | 1457 | 1383 | 289.2 |
| B | 12 | 226 | 3989 | 9.01 | 1457 | 1383 | 289.2 |
| B | 14 | 254 | 3841 | 8.5 | 1457 | 1383 | 289.2 |
| C | 1 | 80 | 3987 | 6.6 | 1477 | 1360 | 398.2 |
| C | 12 | 241 | 3965 | 6.54 | 1477 | 1360 | 398.2 |
| C | 1 | 81 | 3941 | 6.48 | 1477 | 1360 | 398.2 |
| D | 11 | 82 | 3707 | 6.8 | 1360 | 1230 | 364.0 |
| D | 3 | 14 | 3687 | 6.75 | 1360 | 1230 | 364.0 |
| D | 6 | 231 | 3570 | 6.43 | 1360 | 1230 | 364.0 |
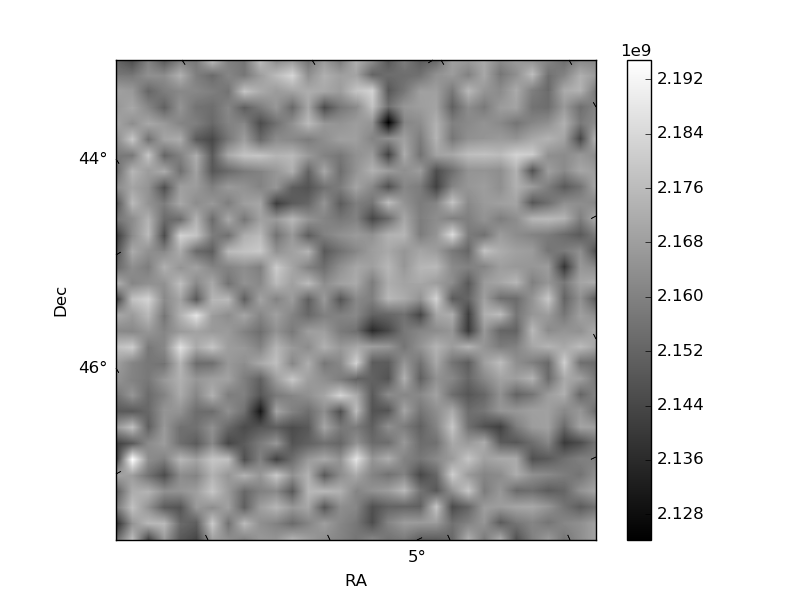
Histogram calculated using DETX and DETY for each event in the final _common_clean file
| Quadrant A | 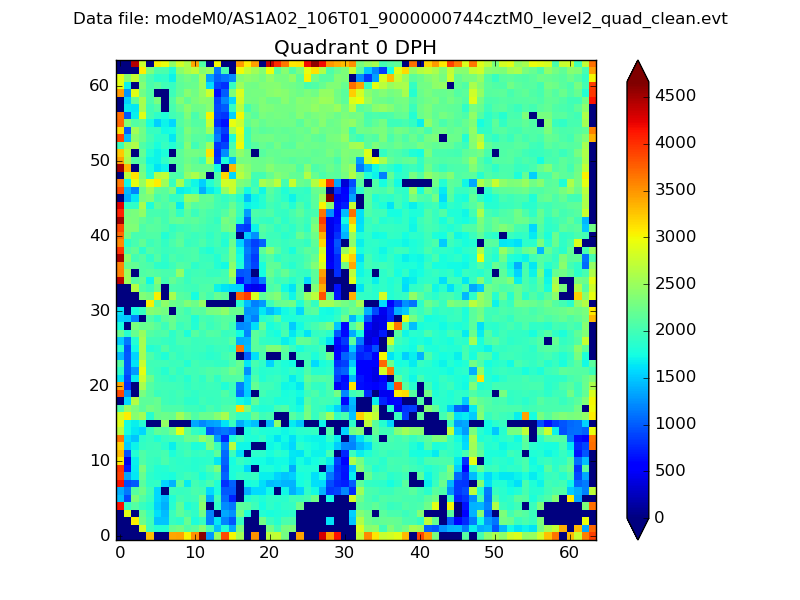 |
 |
Quadrant B |
|---|---|---|---|
| Quadrant D | 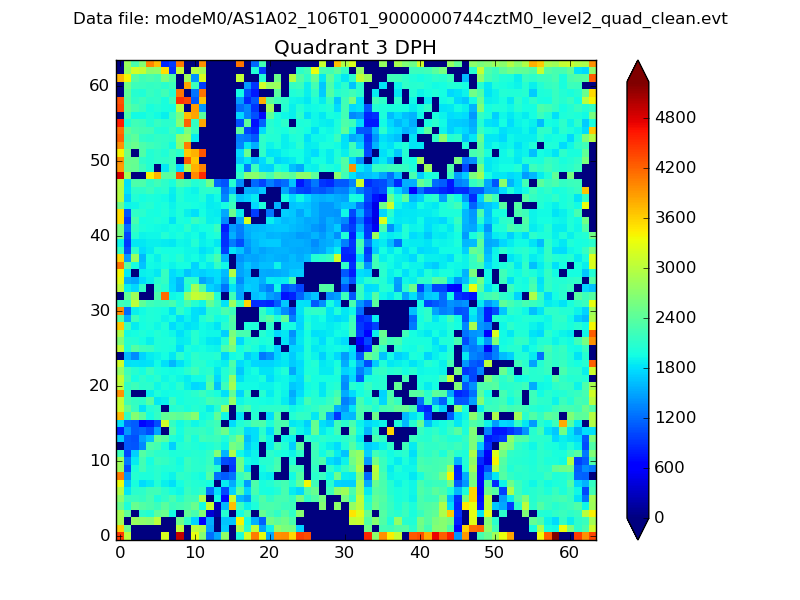 |
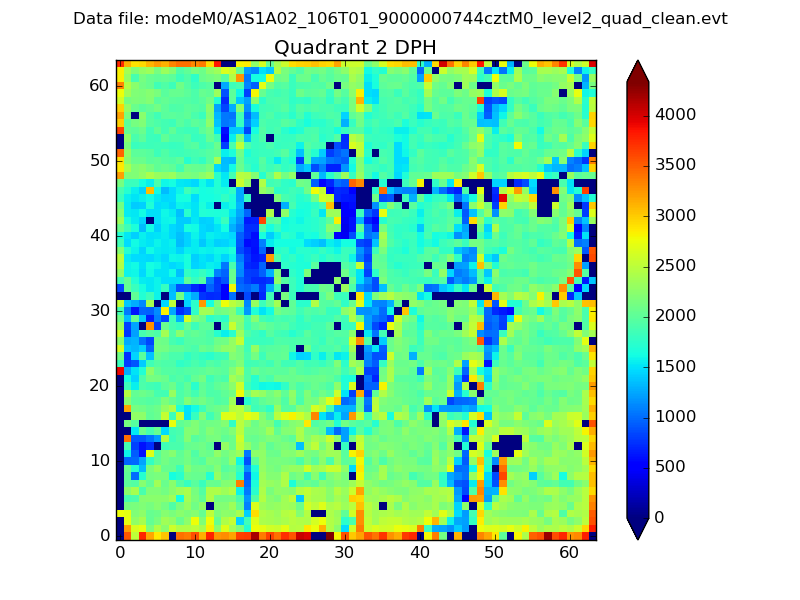 |
Quadrant C |
| Plot type | Count rate plots | Images |
|---|---|---|
| Comparison with Poisson distribution Blue bars denote a histogram of data divided into 1 sec bins. Red curve is a Poisson curve with rate = median count rate of data. |
 |
 |
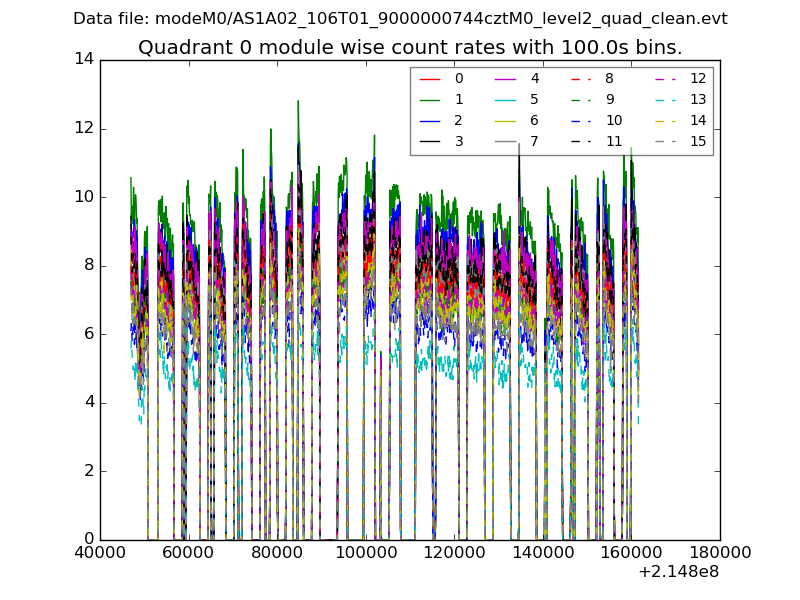
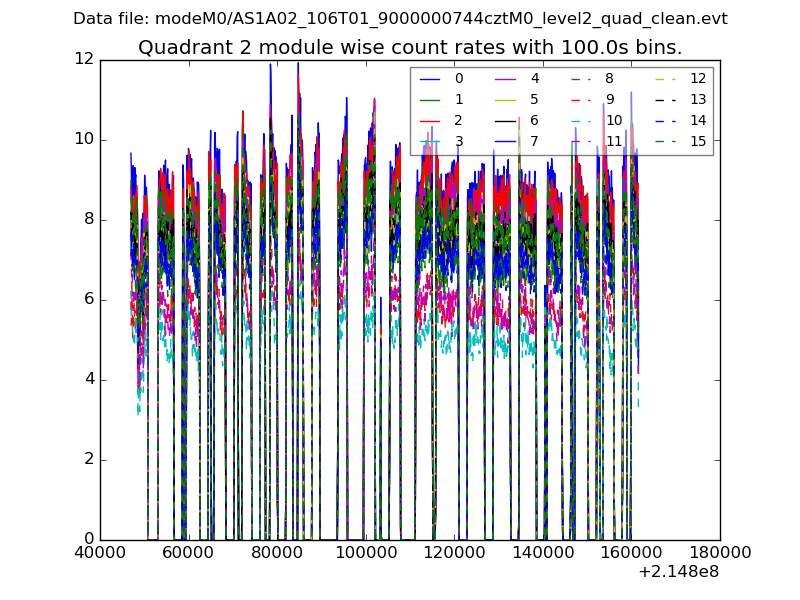
| Quadrant-wise count rates Data is divided into 100 sec bins |
 |
|
| Module-wise count rates for Quadrant A Data is divided into 100 sec bins |
 |
 |
| Module-wise count rates for Quadrant B Data is divided into 100 sec bins |
 |
 |
| Module-wise count rates for Quadrant C Data is divided into 100 sec bins |
 |
 |
| Module-wise count rates for Quadrant D Data is divided into 100 sec bins |
 |
 |
| Parameter | Plot |
|---|---|
| CZT HV Monitor |  |
| D_VDD | 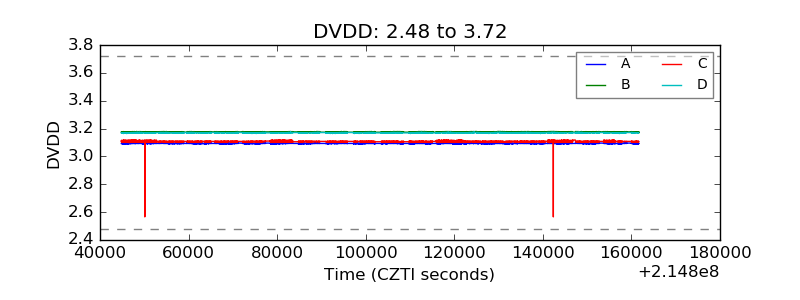 |
| Temperature 1 |  |
| Veto HV Monitor | 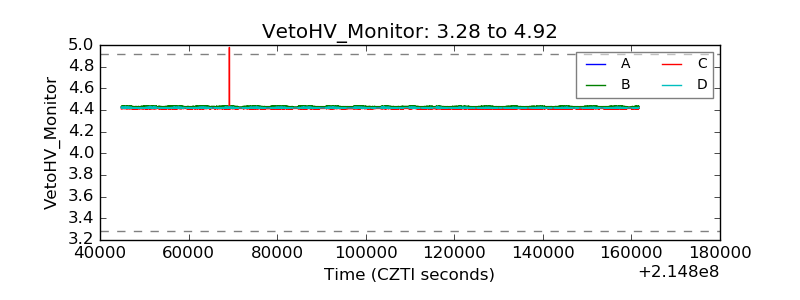 |
| Veto LLD |  |
| Alpha Counter |  |
| _CPM_Rate | 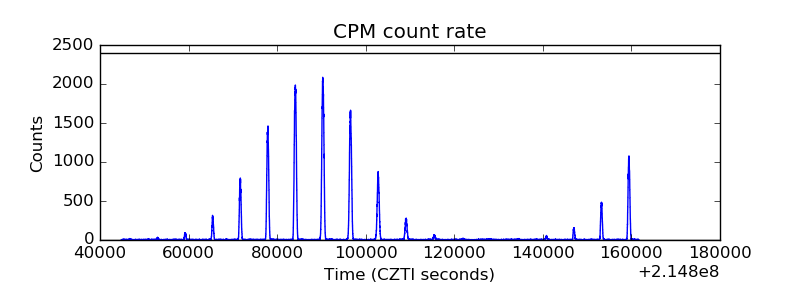 |
| CZT Counter |  |
| +2.5 Volts monitor | 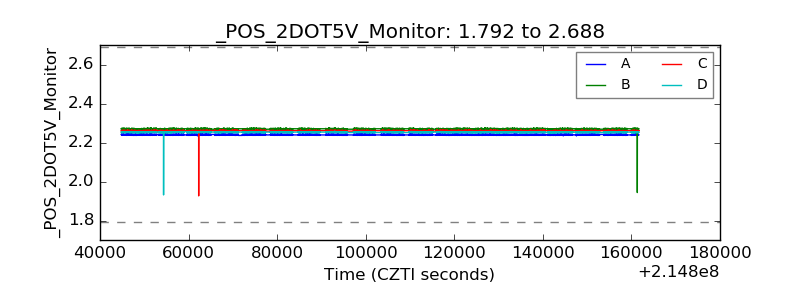 |
| +5 Volts monitor | 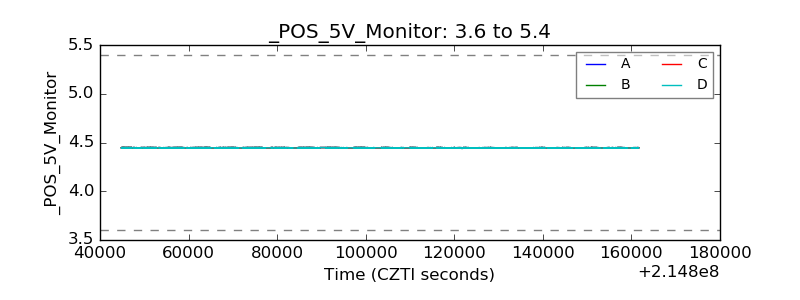 |
| _ROLL_ROT |  |
| _Roll_DEC | 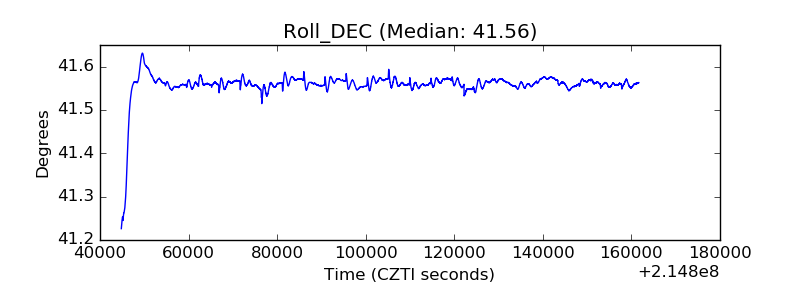 |
| _Roll_RA | 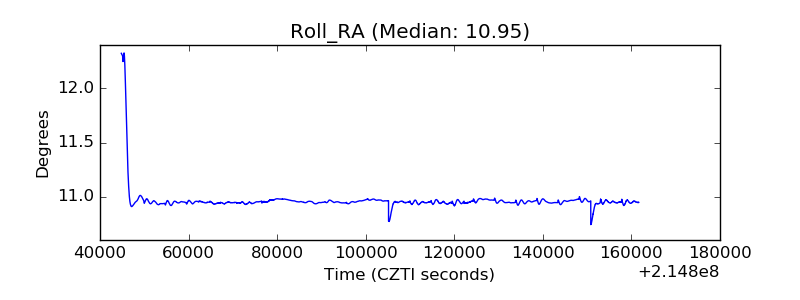 |
| Veto Counter |  |