| Param | Original file | Final file |
|---|---|---|
| Filename | modeM0/AS1A02_106T01_9000000744_05781cztM0_level2.evt | modeM0/AS1A02_106T01_9000000744_05781cztM0_level2_quad_clean.evt |
| Size (bytes) | 161,991,360 | 40,821,120 |
| Size | 154.5 MB | 38.9 MB |
| Events in quadrant A | 1,108,874 | 263,110 |
| Events in quadrant B | 1,201,841 | 273,682 |
| Events in quadrant C | 1,130,142 | 259,798 |
| Events in quadrant D | 1,284,620 | 252,028 |
| Mode M0 | |||
|---|---|---|---|
| Quadrant | BADHDUFLAG | Total packets | Discarded packets |
| A | 0 | 5956 | 774 |
| B | 0 | 6013 | 736 |
| C | 0 | 5958 | 761 |
| D | 0 | 6230 | 736 |
| Mode SS | |||
|---|---|---|---|
| Quadrant | BADHDUFLAG | Total packets | Discarded packets |
| A | 0 | 60 | 8 |
| B | 0 | 60 | 4 |
| C | 0 | 60 | 6 |
| D | 0 | 60 | 8 |
| Quadrant | Total seconds | Saturated seconds | Saturation percentage |
|---|---|---|---|
| A | 2585 | 4 | 0.154739% |
| B | 2610 | 2 | 0.076628% |
| C | 2593 | 0 | 0.000000% |
| D | 2625 | 3 | 0.114286% |
Noise dominated data is calculated using 1-second bins in cleaned event files. If a bin has >2000 counts, and if more than 50% of those come from <1% of pixels, then it is considered to be noise-dominated and hence unusable.
| Quadrant | # 1 sec bins | Bins with >0 counts | Bins with >2000 counts | High rate bins dominated by noise | Noise dominated (total time) | Noise dominated (detector-on time) | Marked lightcurve |
|---|---|---|---|---|---|---|---|
| A | 2975 | 2887 | 0 | 0 | 0.00% | 0.00% | 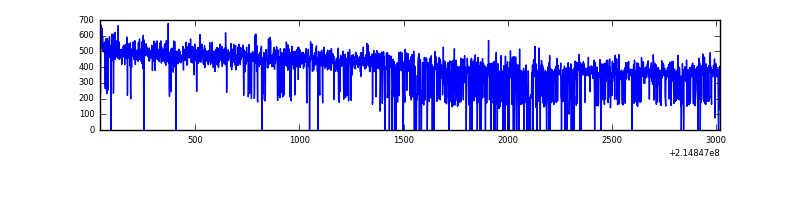 |
| B | 2975 | 2903 | 0 | 0 | 0.00% | 0.00% | 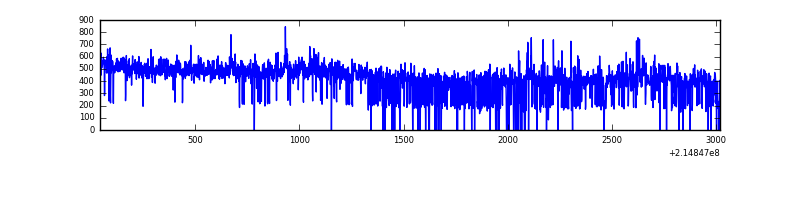 |
| C | 2975 | 2895 | 0 | 0 | 0.00% | 0.00% | 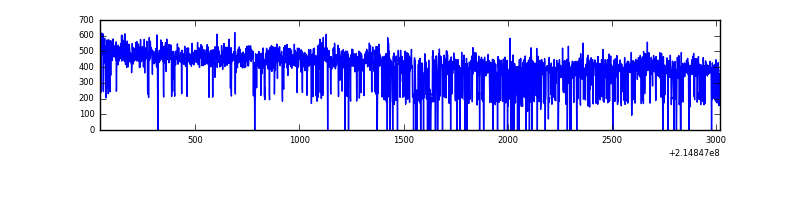 |
| D | 2975 | 2909 | 0 | 0 | 0.00% | 0.00% | 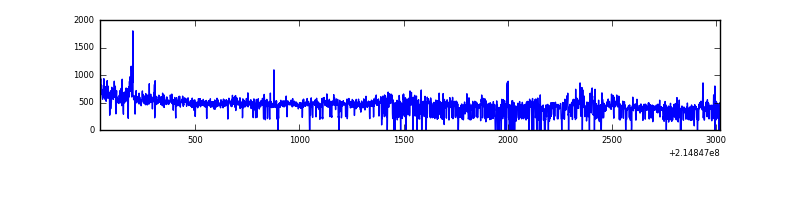 |
Top three noisy pixels from each quadrant. If the there are fewer than three noisy pixels in the level2.evt file, extra rows are filled as -1
| Pixel properties | Quadrant properties | ||||||
|---|---|---|---|---|---|---|---|
| Quadrant | DetID | PixID | Counts | Sigma | Mean | Median | Sigma |
| A | 0 | 226 | 2821 | 42.16 | 287 | 281 | 60.3 |
| A | 12 | 194 | 2770 | 41.31 | 287 | 281 | 60.3 |
| A | 0 | 12 | 2244 | 32.58 | 287 | 281 | 60.3 |
| B | 15 | 204 | 40262 | 689.86 | 295 | 288 | 57.9 |
| B | 0 | 219 | 10157 | 170.32 | 295 | 288 | 57.9 |
| B | 12 | 111 | 5061 | 82.37 | 295 | 288 | 57.9 |
| C | 1 | 16 | 7408 | 105.75 | 284 | 285 | 67.4 |
| C | 8 | 128 | 6415 | 91.01 | 284 | 285 | 67.4 |
| C | 8 | 112 | 3280 | 44.47 | 284 | 285 | 67.4 |
| D | 8 | 195 | 153723 | 2131.55 | 288 | 279 | 72.0 |
| D | 12 | 233 | 10119 | 136.69 | 288 | 279 | 72.0 |
| D | 1 | 20 | 8896 | 119.7 | 288 | 279 | 72.0 |
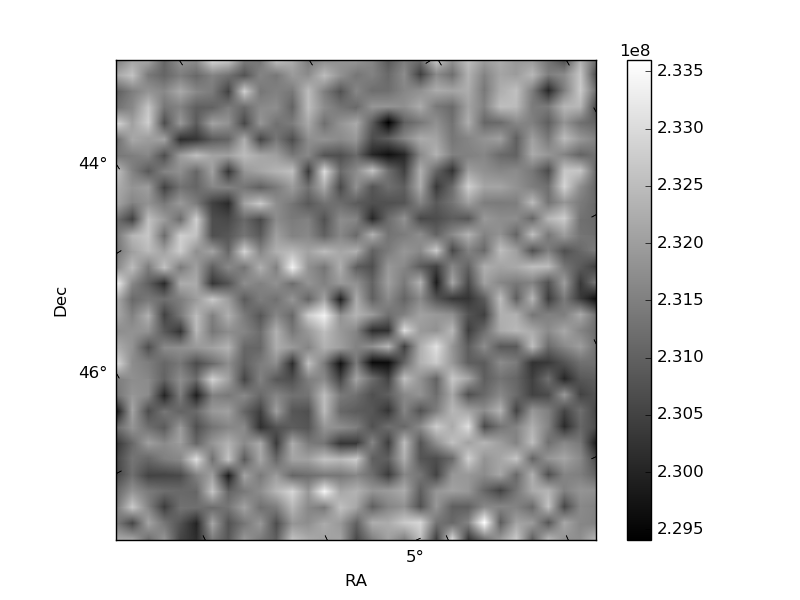
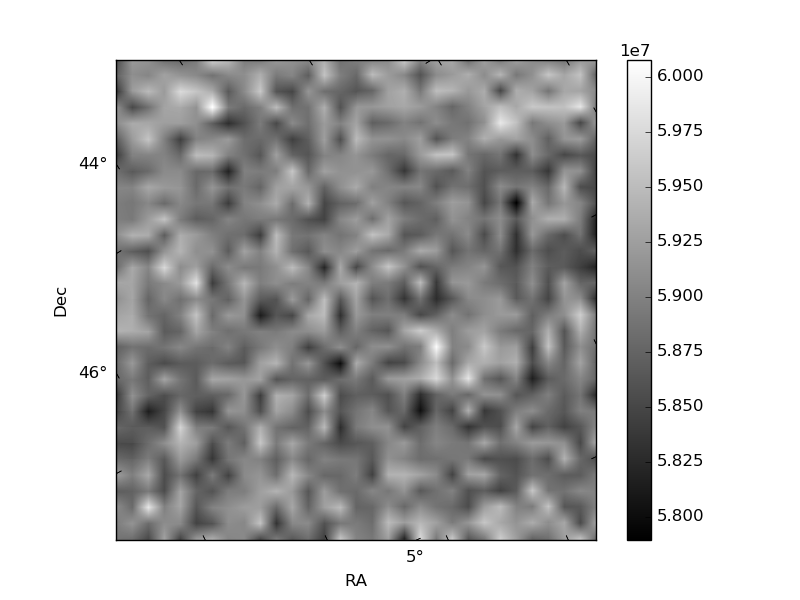
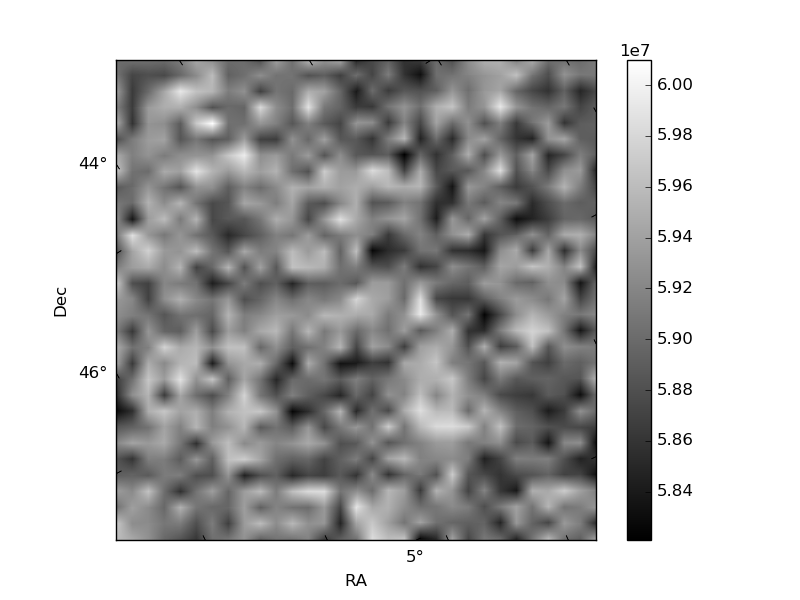
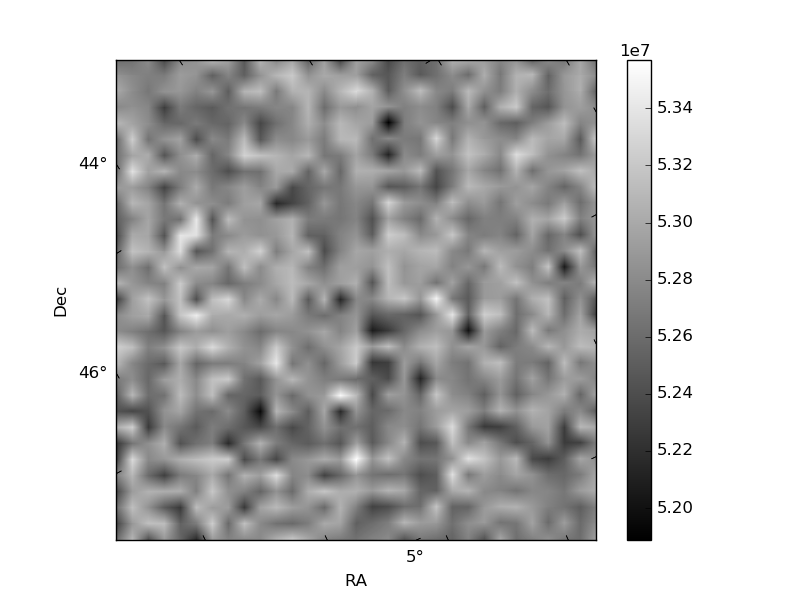
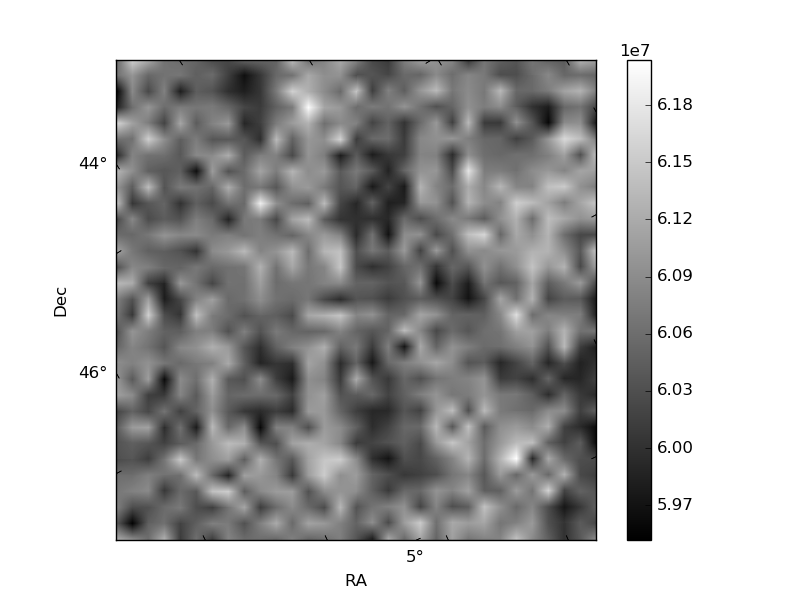
Histogram calculated using DETX and DETY for each event in the final _common_clean file
| Quadrant A | 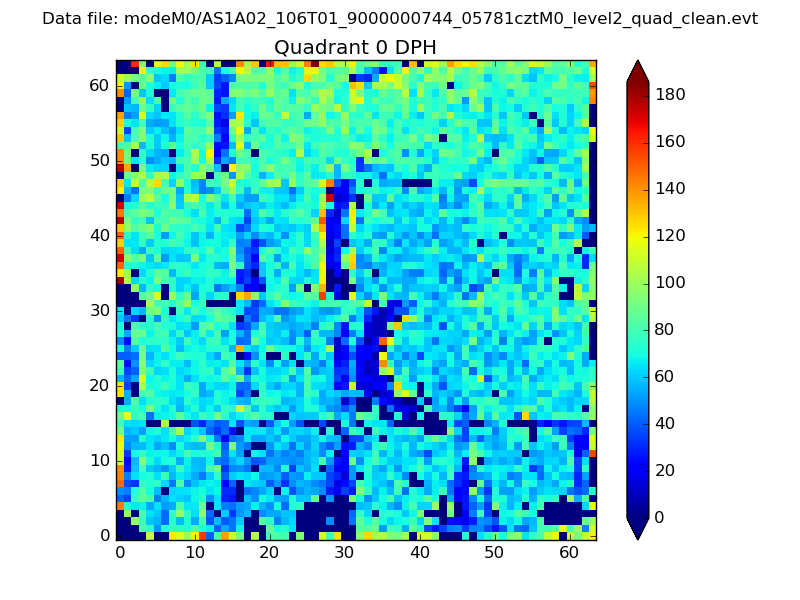 |
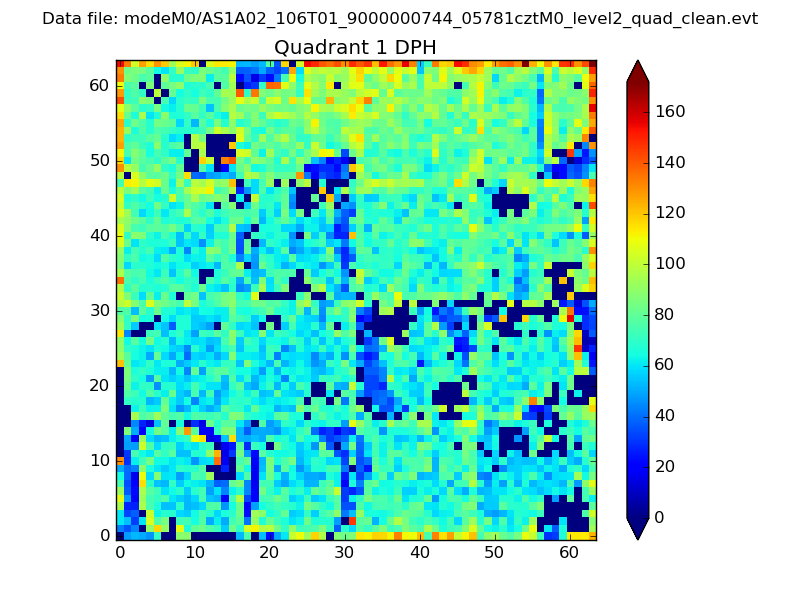 |
Quadrant B |
|---|---|---|---|
| Quadrant D | 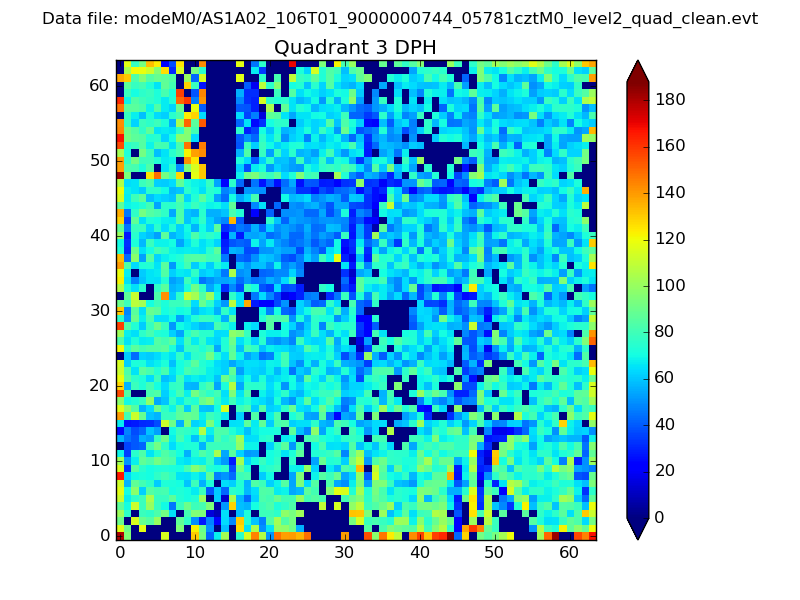 |
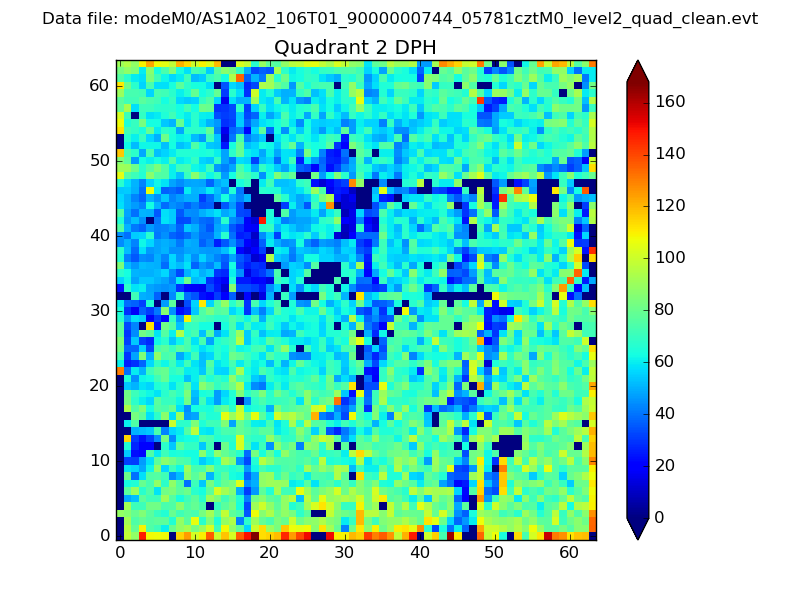 |
Quadrant C |
| Plot type | Count rate plots | Images |
|---|---|---|
| Comparison with Poisson distribution Blue bars denote a histogram of data divided into 1 sec bins. Red curve is a Poisson curve with rate = median count rate of data. |
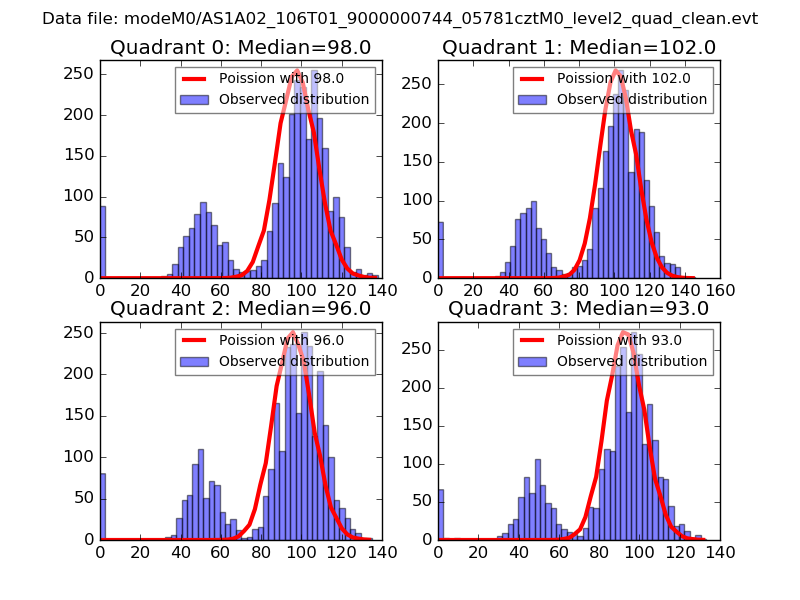 |
 |
| Quadrant-wise count rates Data is divided into 100 sec bins |
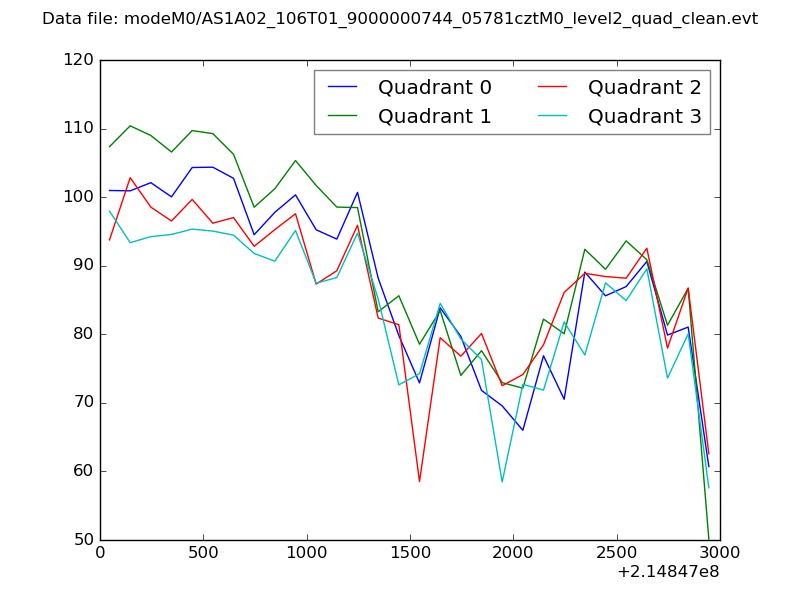 |
|
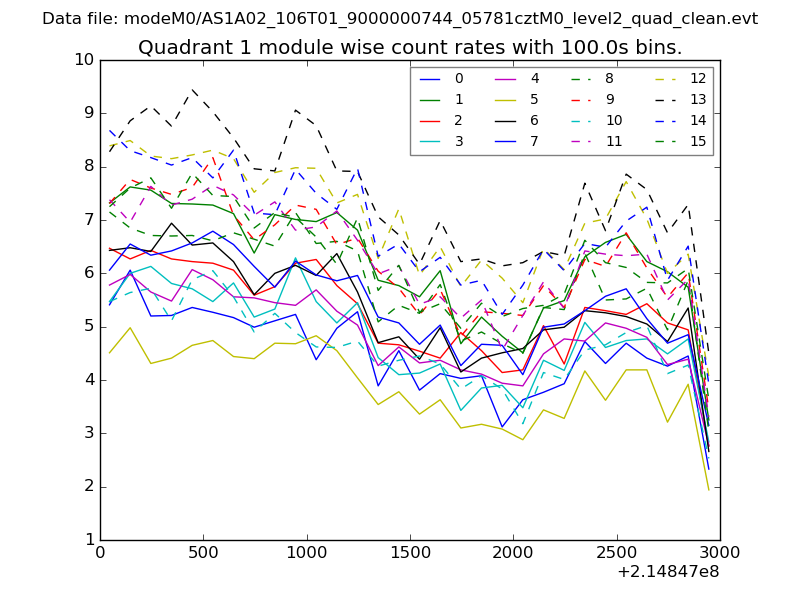
| Module-wise count rates for Quadrant A Data is divided into 100 sec bins |
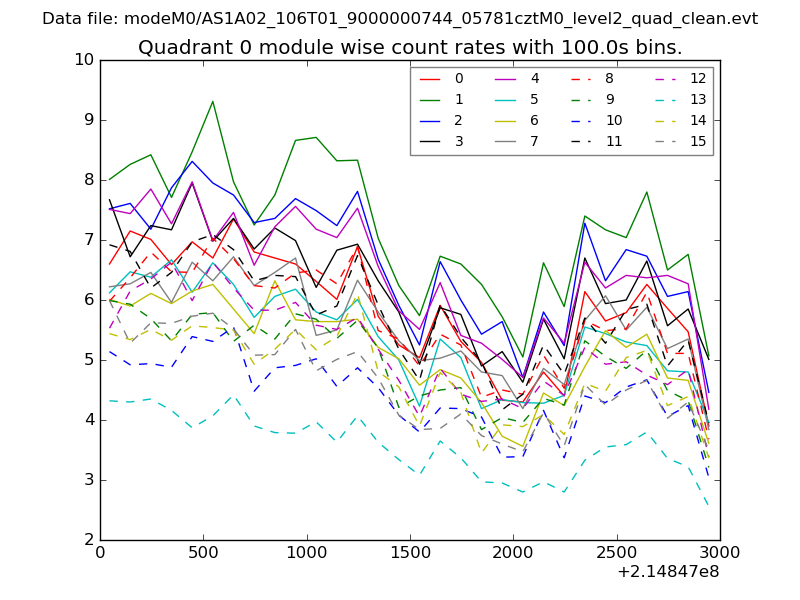 |
 |
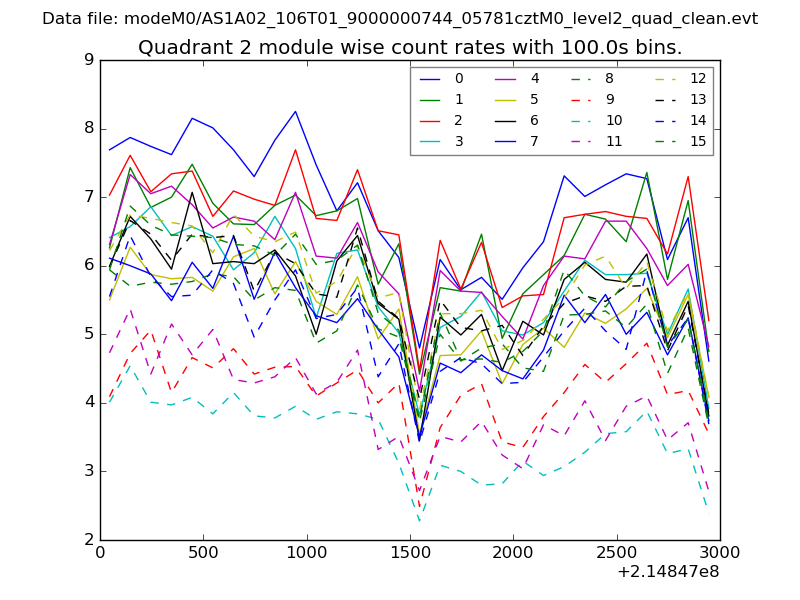
| Module-wise count rates for Quadrant B Data is divided into 100 sec bins |
 |
 |
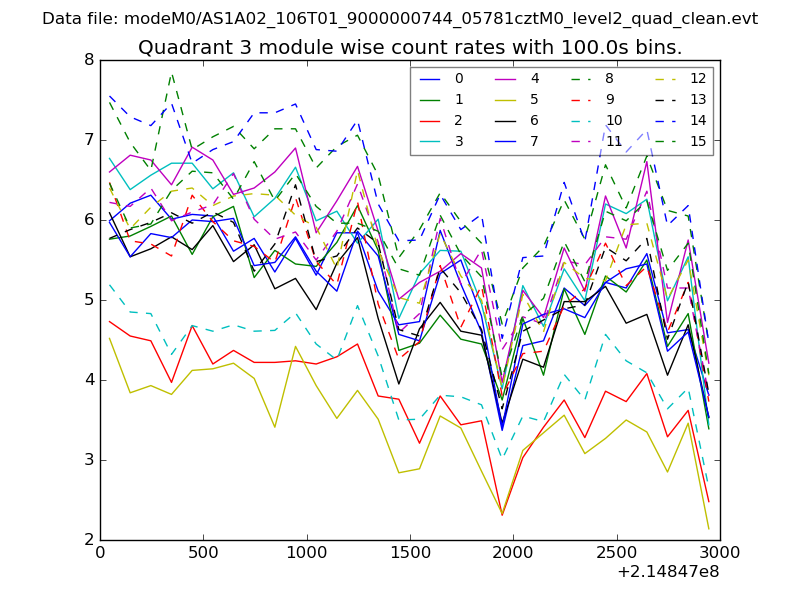
| Module-wise count rates for Quadrant C Data is divided into 100 sec bins |
 |
 |
| Module-wise count rates for Quadrant D Data is divided into 100 sec bins |
 |
 |
| Parameter | Plot |
|---|---|
| CZT HV Monitor | 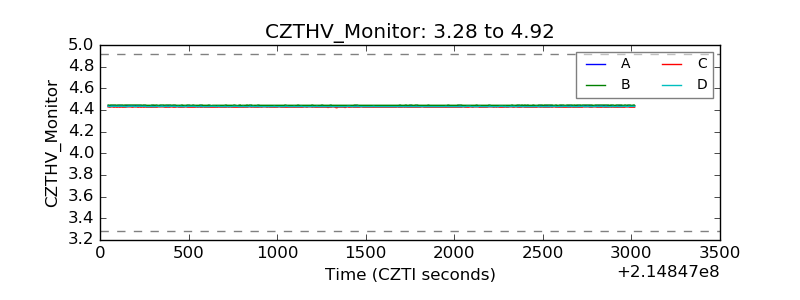 |
| D_VDD | 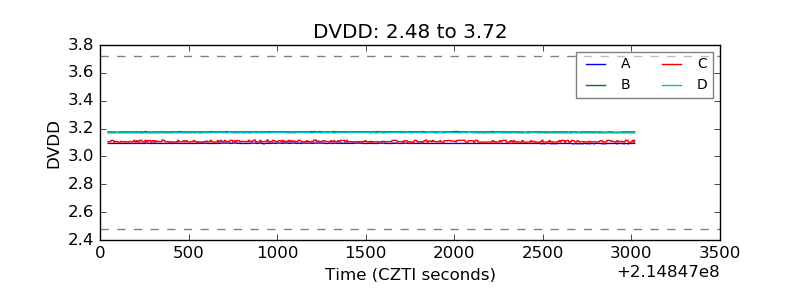 |
| Temperature 1 |  |
| Veto HV Monitor | 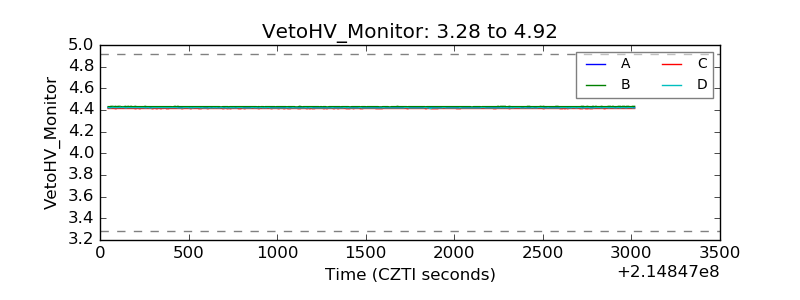 |
| Veto LLD | 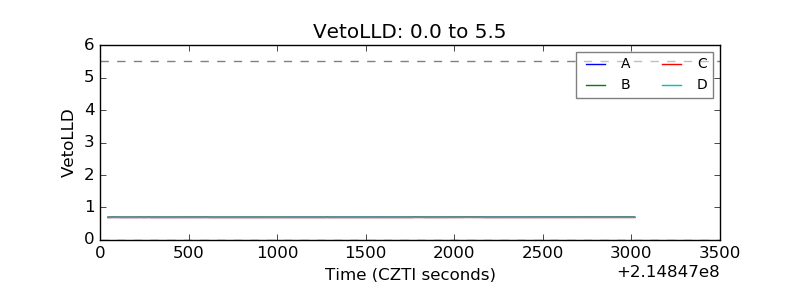 |
| Alpha Counter | 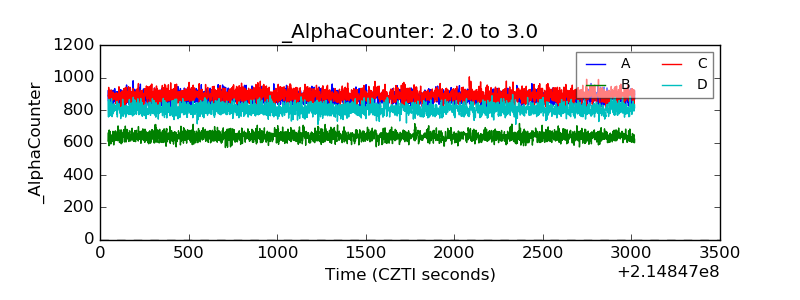 |
| _CPM_Rate | 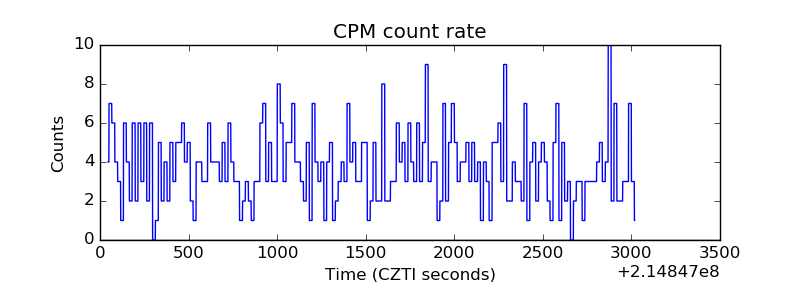 |
| CZT Counter | 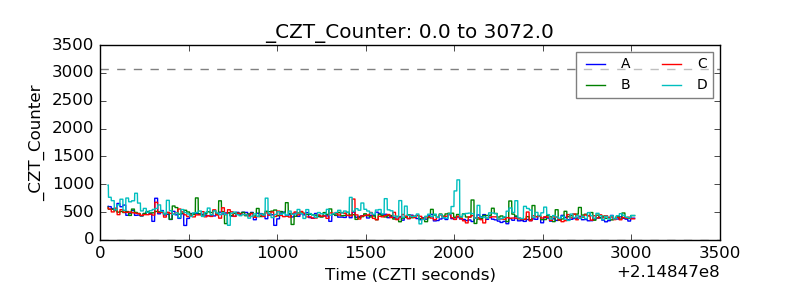 |
| +2.5 Volts monitor |  |
| +5 Volts monitor |  |
| _ROLL_ROT | 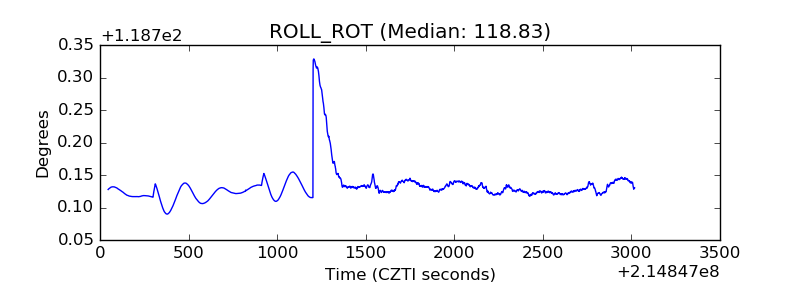 |
| _Roll_DEC |  |
| _Roll_RA | 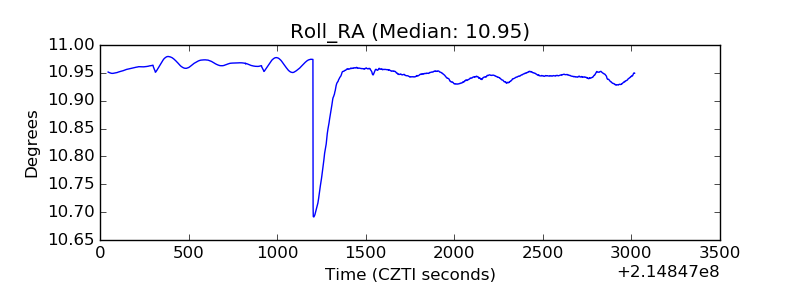 |
| Veto Counter |  |