| Param | Original file | Final file |
|---|---|---|
| Filename | modeM0/AS1A02_106T01_9000000744_05785cztM0_level2.evt | modeM0/AS1A02_106T01_9000000744_05785cztM0_level2_quad_clean.evt |
| Size (bytes) | 426,720,960 | 82,935,360 |
| Size | 407.0 MB | 79.1 MB |
| Events in quadrant A | 3,085,755 | 511,783 |
| Events in quadrant B | 3,300,377 | 525,895 |
| Events in quadrant C | 2,983,111 | 515,304 |
| Events in quadrant D | 3,099,357 | 492,561 |
| Mode M9 | |||
|---|---|---|---|
| Quadrant | BADHDUFLAG | Total packets | Discarded packets |
| A | 0 | 20 | 0 |
| B | 0 | 20 | 0 |
| C | 0 | 20 | 0 |
| D | 0 | 20 | 0 |
| Mode M0 | |||
|---|---|---|---|
| Quadrant | BADHDUFLAG | Total packets | Discarded packets |
| A | 0 | 13890 | 5 |
| B | 0 | 14297 | 4 |
| C | 0 | 13603 | 7 |
| D | 0 | 14294 | 6 |
| Mode SS | |||
|---|---|---|---|
| Quadrant | BADHDUFLAG | Total packets | Discarded packets |
| A | 0 | 138 | 0 |
| B | 0 | 138 | 0 |
| C | 0 | 138 | 0 |
| D | 0 | 138 | 0 |
| Quadrant | Total seconds | Saturated seconds | Saturation percentage |
|---|---|---|---|
| A | 6682 | 75 | 1.122418% |
| B | 6682 | 57 | 0.853038% |
| C | 6681 | 23 | 0.344260% |
| D | 6681 | 41 | 0.613681% |
Noise dominated data is calculated using 1-second bins in cleaned event files. If a bin has >2000 counts, and if more than 50% of those come from <1% of pixels, then it is considered to be noise-dominated and hence unusable.
| Quadrant | # 1 sec bins | Bins with >0 counts | Bins with >2000 counts | High rate bins dominated by noise | Noise dominated (total time) | Noise dominated (detector-on time) | Marked lightcurve |
|---|---|---|---|---|---|---|---|
| A | 8693 | 6685 | 17 | 17 | 0.20% | 0.25% | 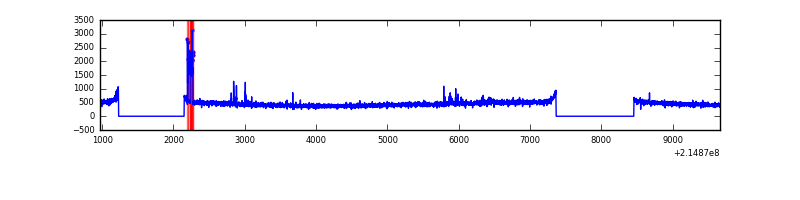 |
| B | 8693 | 6685 | 9 | 9 | 0.10% | 0.13% | 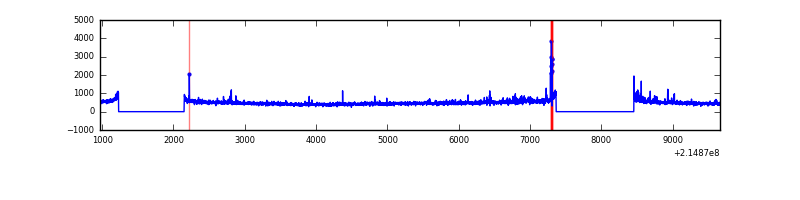 |
| C | 8693 | 6685 | 0 | 0 | 0.00% | 0.00% | 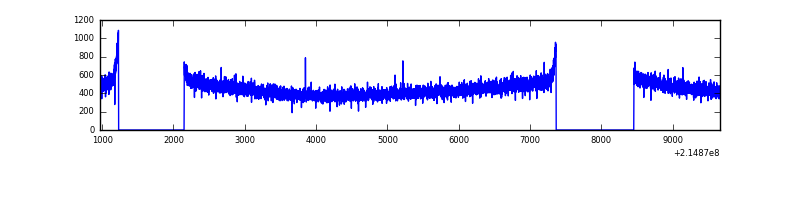 |
| D | 8693 | 6685 | 21 | 21 | 0.24% | 0.31% | 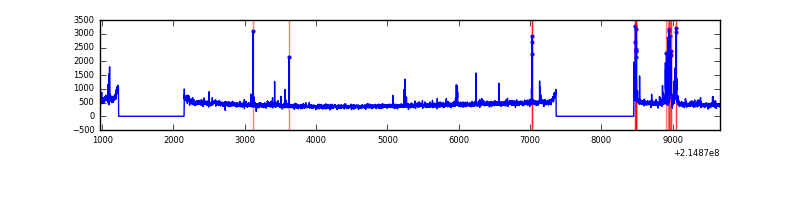 |
Top three noisy pixels from each quadrant. If the there are fewer than three noisy pixels in the level2.evt file, extra rows are filled as -1
| Pixel properties | Quadrant properties | ||||||
|---|---|---|---|---|---|---|---|
| Quadrant | DetID | PixID | Counts | Sigma | Mean | Median | Sigma |
| A | 15 | 236 | 81616 | 513.31 | 772 | 756 | 157.5 |
| A | 15 | 79 | 18383 | 111.9 | 772 | 756 | 157.5 |
| A | 15 | 174 | 13232 | 79.2 | 772 | 756 | 157.5 |
| B | 15 | 204 | 158473 | 1036.7 | 787 | 765 | 152.1 |
| B | 4 | 81 | 35716 | 229.75 | 787 | 765 | 152.1 |
| B | 4 | 48 | 28129 | 179.88 | 787 | 765 | 152.1 |
| C | 13 | 61 | 6010 | 29.51 | 762 | 766 | 177.7 |
| C | 8 | 128 | 5087 | 24.32 | 762 | 766 | 177.7 |
| C | 8 | 112 | 2871 | 11.85 | 762 | 766 | 177.7 |
| D | 12 | 233 | 156550 | 851.53 | 752 | 730 | 183.0 |
| D | 8 | 195 | 37239 | 199.52 | 752 | 730 | 183.0 |
| D | 2 | 14 | 22151 | 117.06 | 752 | 730 | 183.0 |
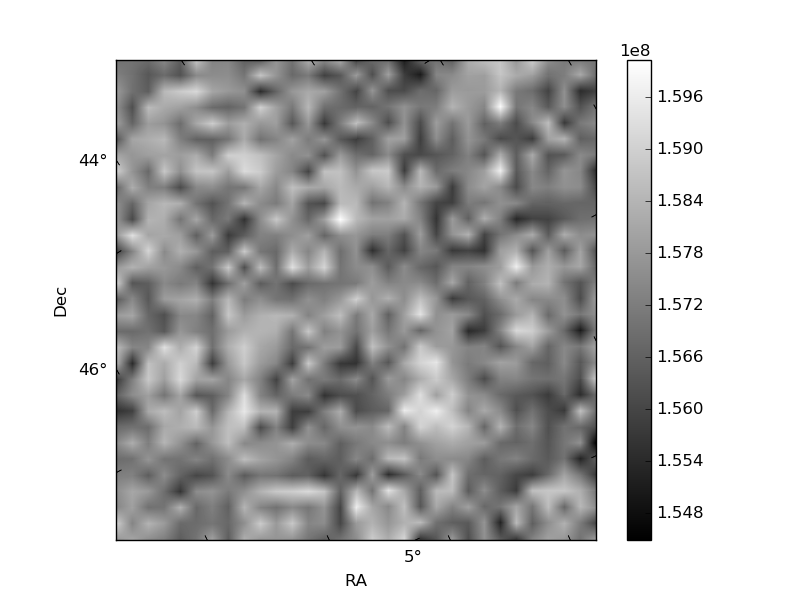
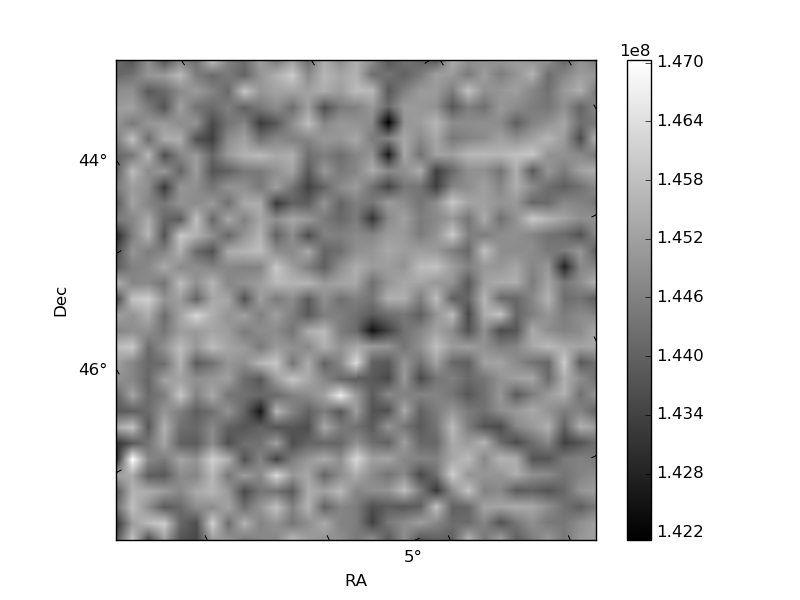
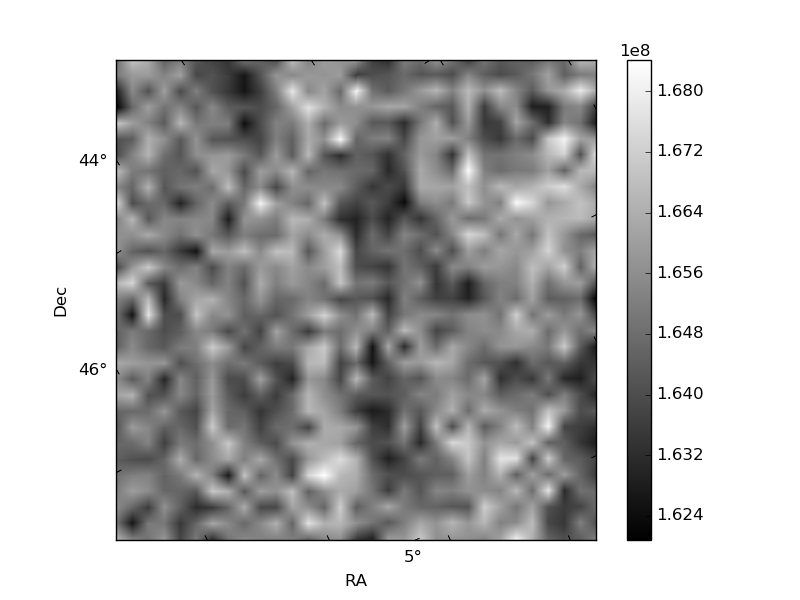
Histogram calculated using DETX and DETY for each event in the final _common_clean file
| Quadrant A | 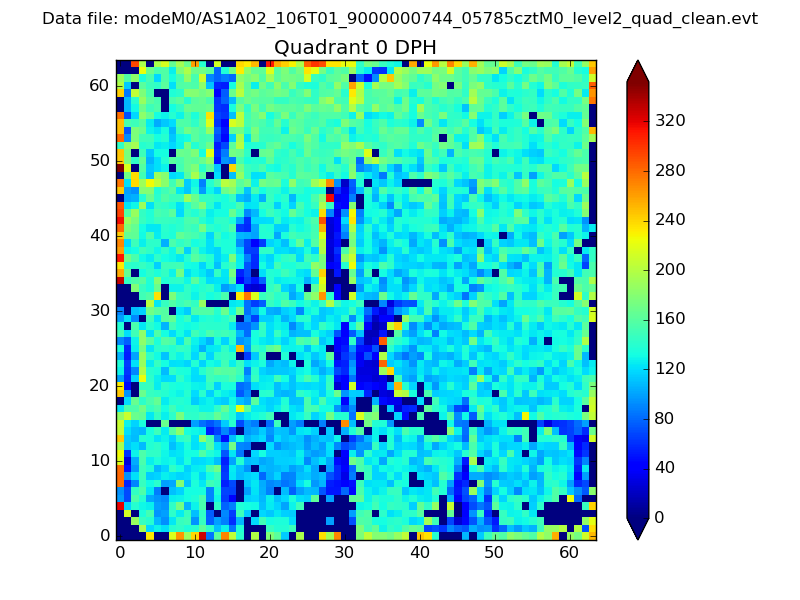 |
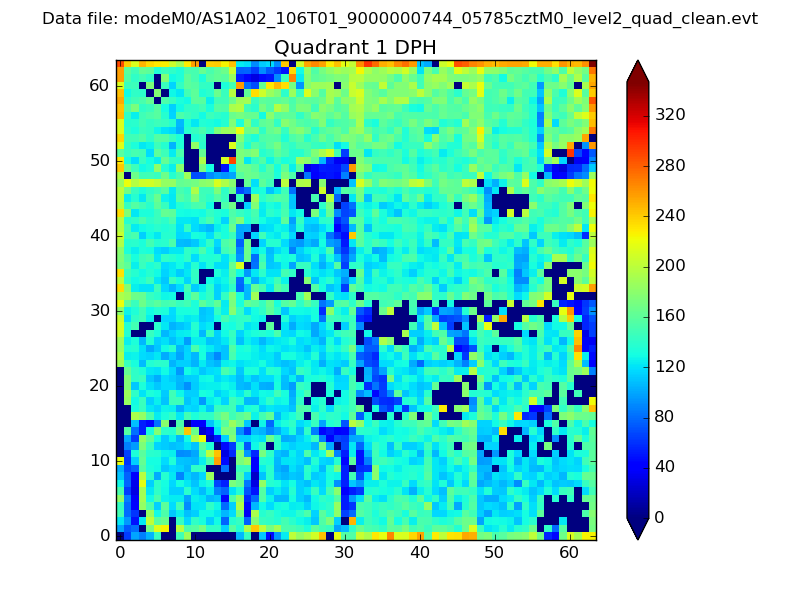 |
Quadrant B |
|---|---|---|---|
| Quadrant D | 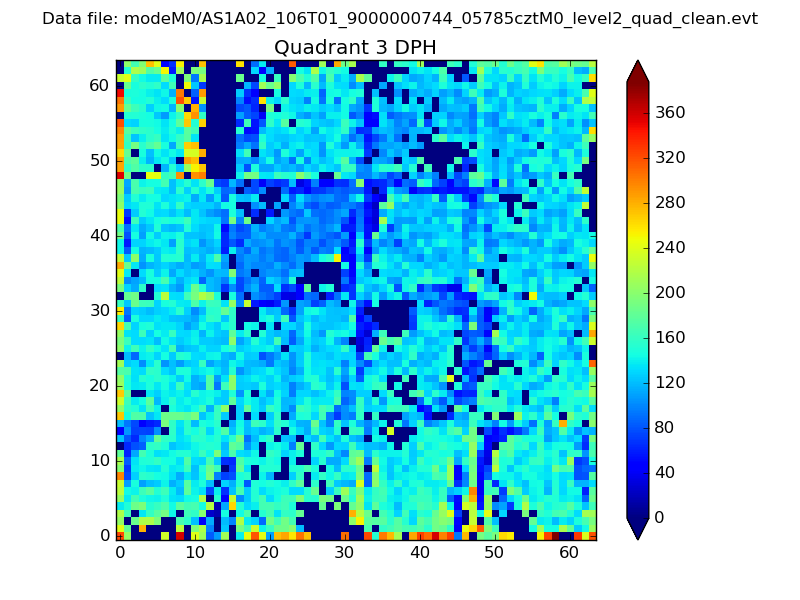 |
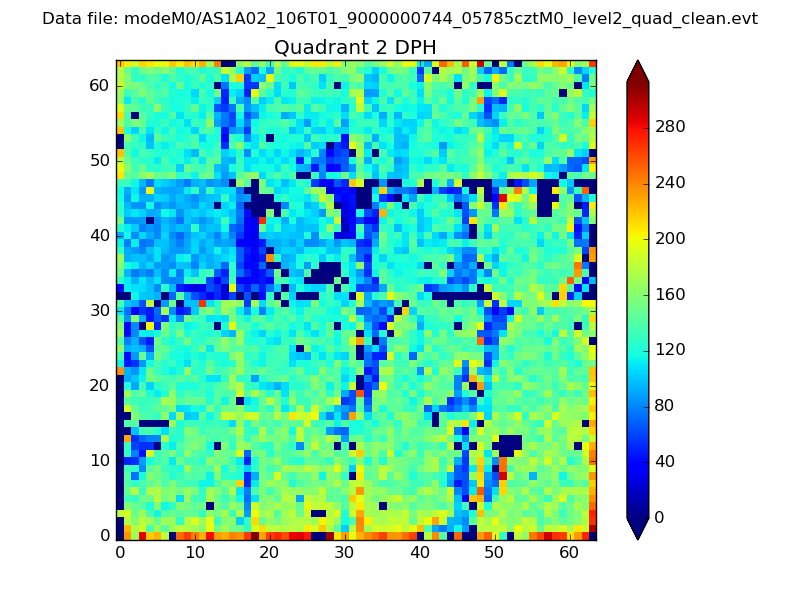 |
Quadrant C |
| Plot type | Count rate plots | Images |
|---|---|---|
| Comparison with Poisson distribution Blue bars denote a histogram of data divided into 1 sec bins. Red curve is a Poisson curve with rate = median count rate of data. |
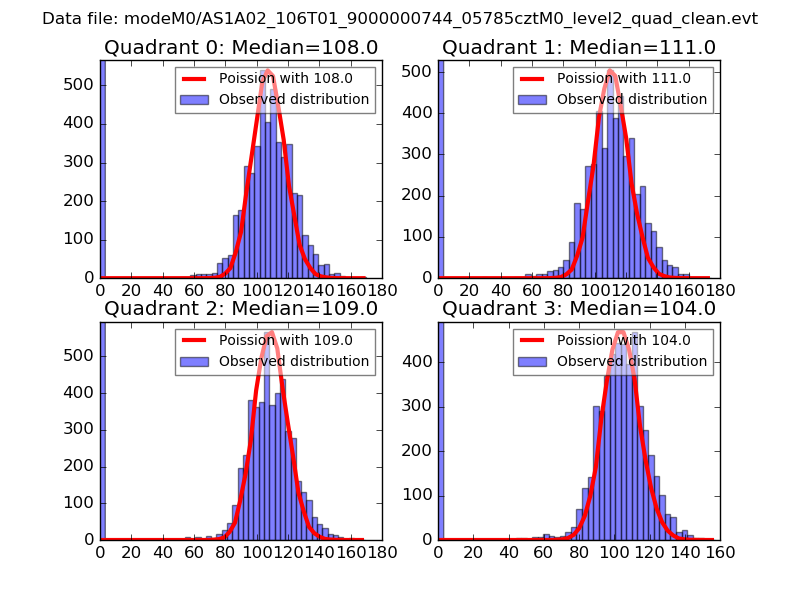 |
 |
| Quadrant-wise count rates Data is divided into 100 sec bins |
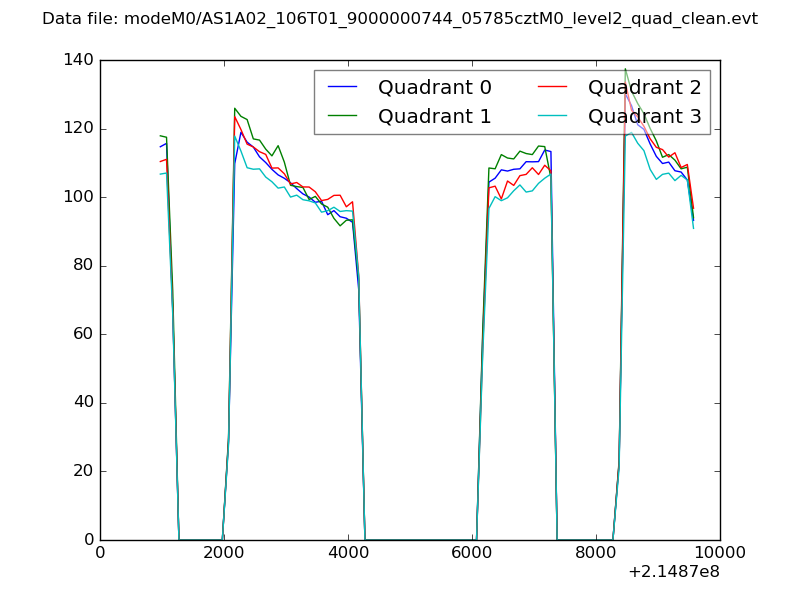 |
|
| Module-wise count rates for Quadrant A Data is divided into 100 sec bins |
 |
 |
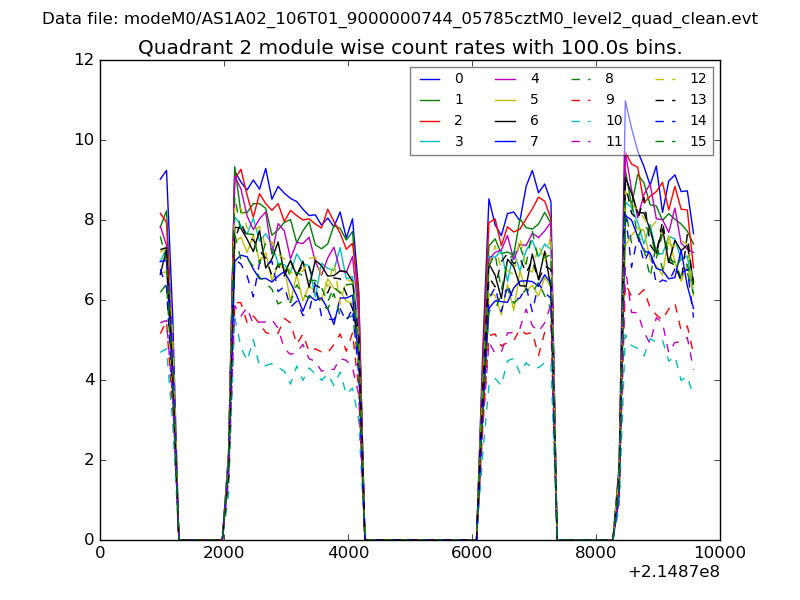
| Module-wise count rates for Quadrant B Data is divided into 100 sec bins |
 |
 |
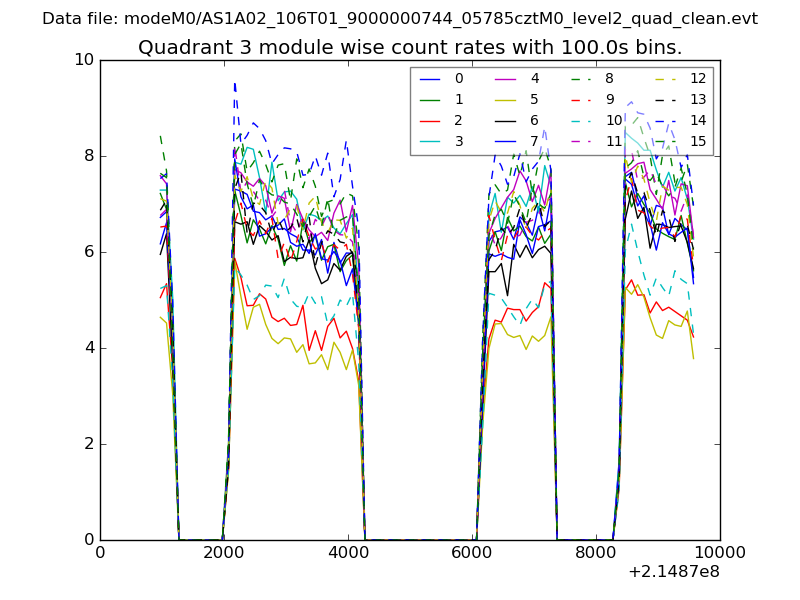
| Module-wise count rates for Quadrant C Data is divided into 100 sec bins |
 |
 |
| Module-wise count rates for Quadrant D Data is divided into 100 sec bins |
 |
 |
| Parameter | Plot |
|---|---|
| CZT HV Monitor | 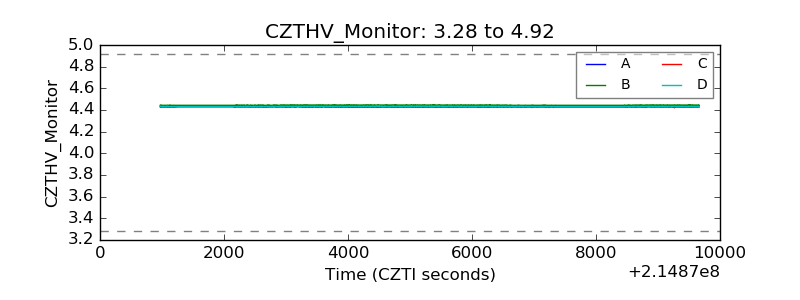 |
| D_VDD | 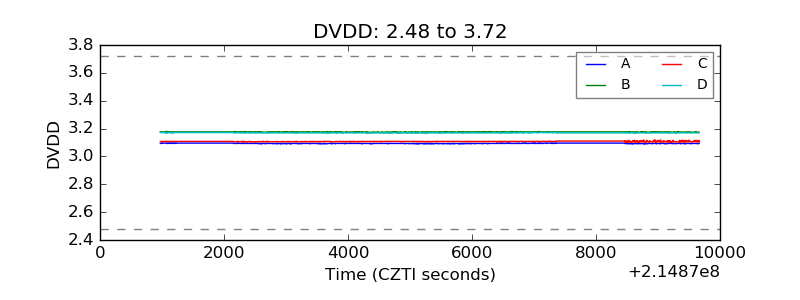 |
| Temperature 1 | 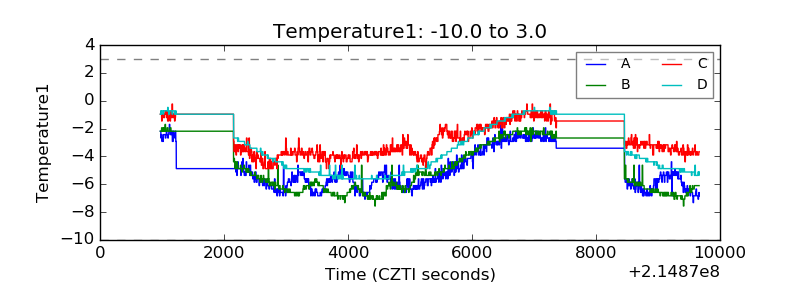 |
| Veto HV Monitor | 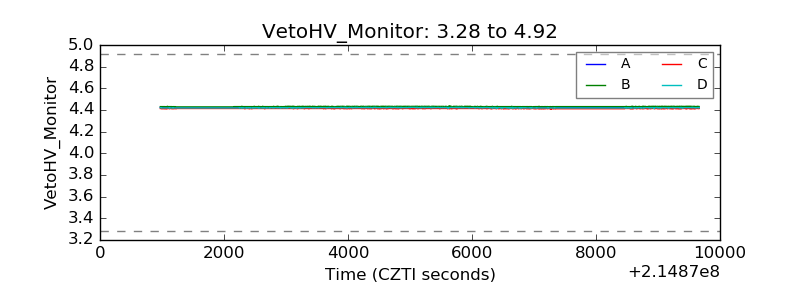 |
| Veto LLD | 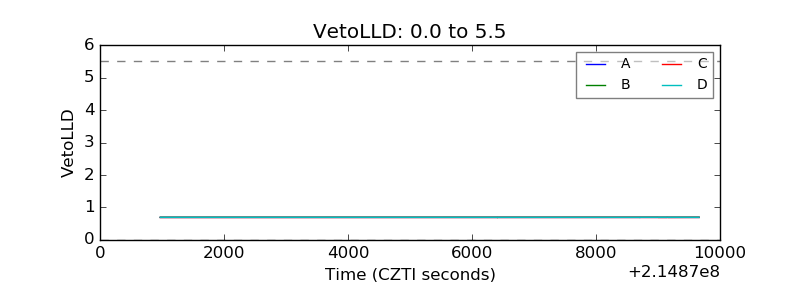 |
| Alpha Counter | 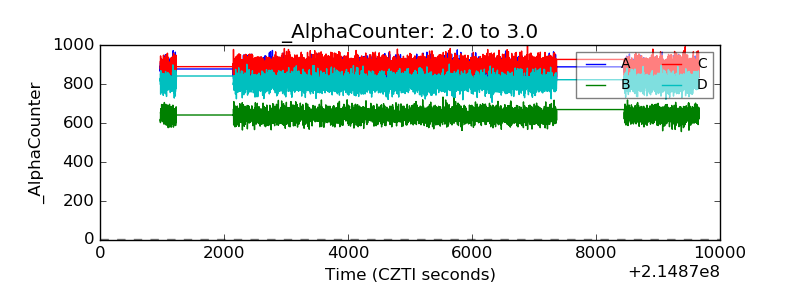 |
| _CPM_Rate | 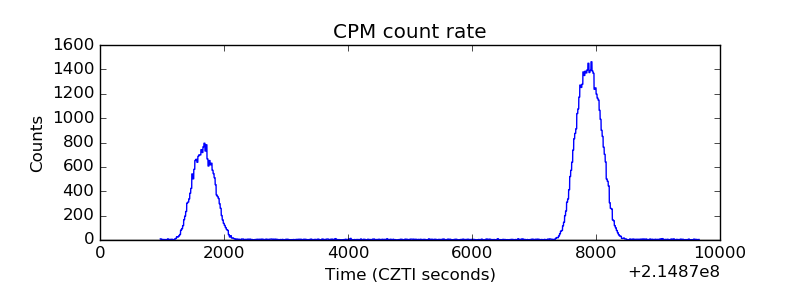 |
| CZT Counter | 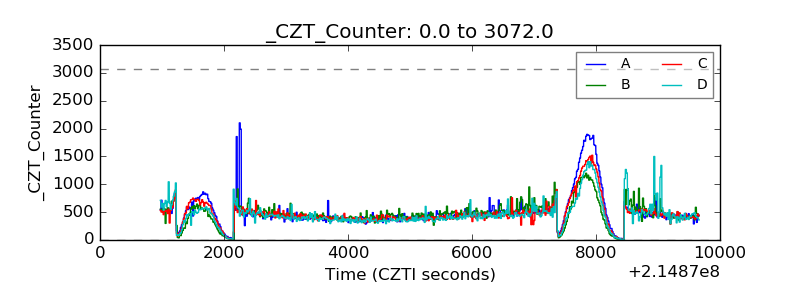 |
| +2.5 Volts monitor |  |
| +5 Volts monitor |  |
| _ROLL_ROT | 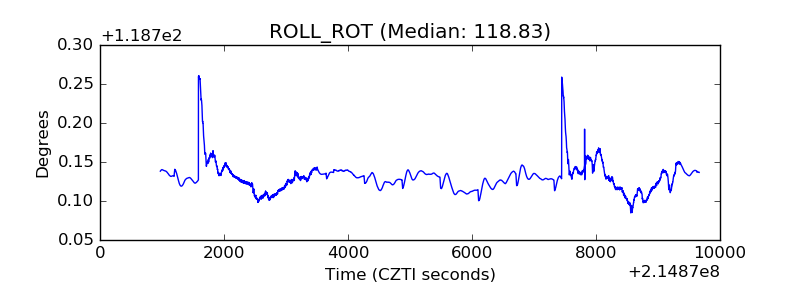 |
| _Roll_DEC | 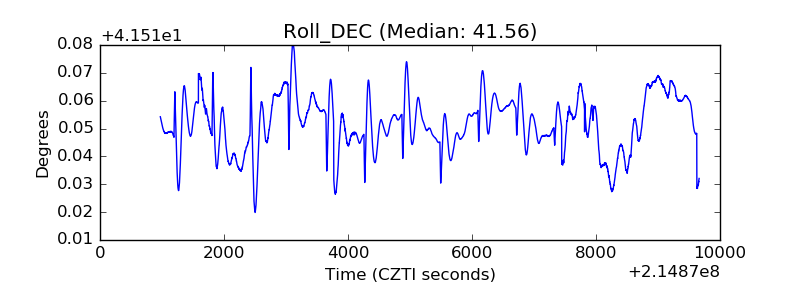 |
| _Roll_RA | 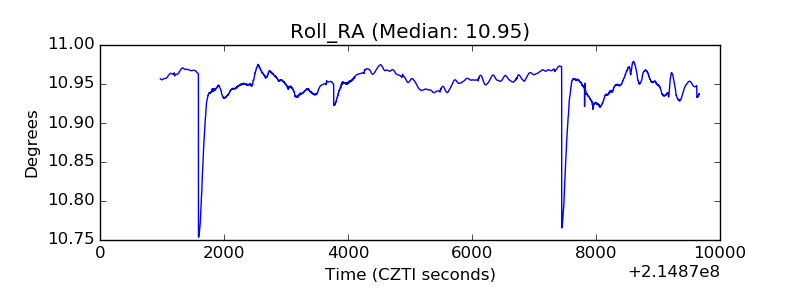 |
| Veto Counter | 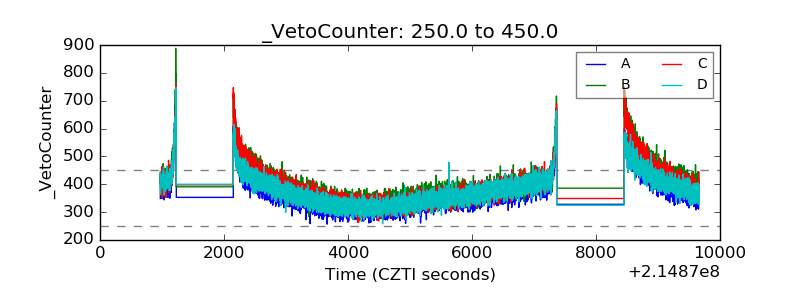 |