| Param | Original file | Final file |
|---|---|---|
| Filename | modeM0/AS1A02_106T01_9000000744_05787cztM0_level2.evt | modeM0/AS1A02_106T01_9000000744_05787cztM0_level2_quad_clean.evt |
| Size (bytes) | 410,273,280 | 79,617,600 |
| Size | 391.3 MB | 75.9 MB |
| Events in quadrant A | 3,067,268 | 492,013 |
| Events in quadrant B | 3,054,430 | 508,570 |
| Events in quadrant C | 2,882,288 | 494,664 |
| Events in quadrant D | 2,987,128 | 470,563 |
| Mode M9 | |||
|---|---|---|---|
| Quadrant | BADHDUFLAG | Total packets | Discarded packets |
| A | 0 | 16 | 0 |
| B | 0 | 16 | 0 |
| C | 0 | 16 | 0 |
| D | 0 | 17 | 0 |
| Mode M0 | |||
|---|---|---|---|
| Quadrant | BADHDUFLAG | Total packets | Discarded packets |
| A | 0 | 13359 | 11 |
| B | 0 | 13319 | 11 |
| C | 0 | 12964 | 6 |
| D | 0 | 13536 | 10 |
| Mode SS | |||
|---|---|---|---|
| Quadrant | BADHDUFLAG | Total packets | Discarded packets |
| A | 0 | 130 | 0 |
| B | 0 | 130 | 0 |
| C | 0 | 130 | 0 |
| D | 0 | 130 | 0 |
| Quadrant | Total seconds | Saturated seconds | Saturation percentage |
|---|---|---|---|
| A | 6377 | 29 | 0.454759% |
| B | 6377 | 27 | 0.423397% |
| C | 6379 | 22 | 0.344882% |
| D | 6377 | 41 | 0.642936% |
Noise dominated data is calculated using 1-second bins in cleaned event files. If a bin has >2000 counts, and if more than 50% of those come from <1% of pixels, then it is considered to be noise-dominated and hence unusable.
| Quadrant | # 1 sec bins | Bins with >0 counts | Bins with >2000 counts | High rate bins dominated by noise | Noise dominated (total time) | Noise dominated (detector-on time) | Marked lightcurve |
|---|---|---|---|---|---|---|---|
| A | 7566 | 6382 | 1 | 1 | 0.01% | 0.02% | 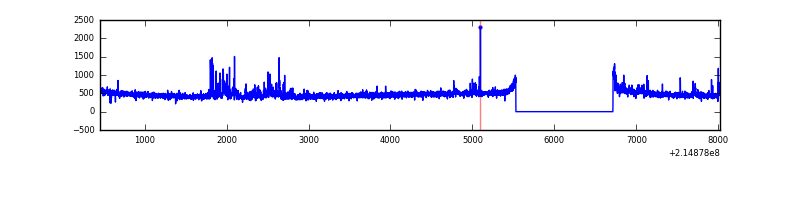 |
| B | 7566 | 6382 | 1 | 1 | 0.01% | 0.02% | 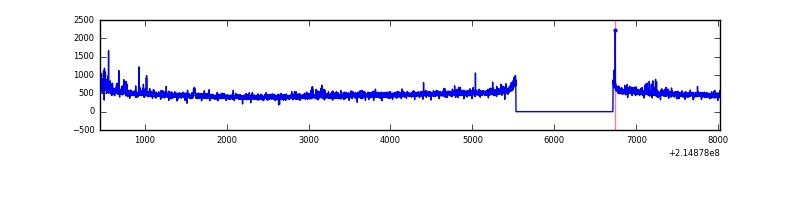 |
| C | 7566 | 6382 | 0 | 0 | 0.00% | 0.00% | 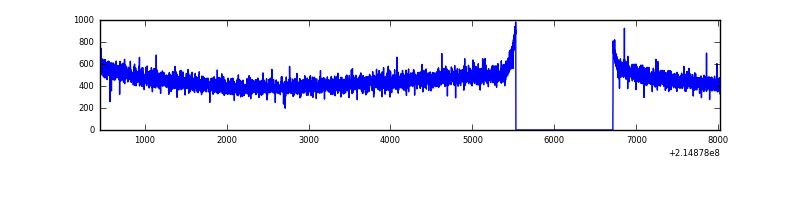 |
| D | 7566 | 6382 | 25 | 25 | 0.33% | 0.39% | 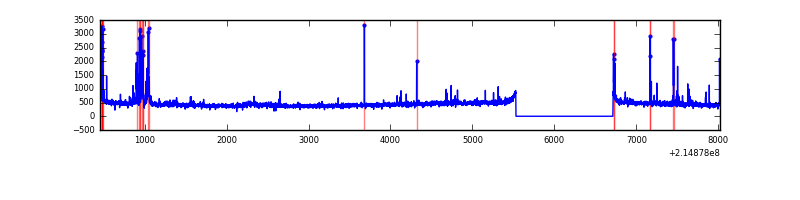 |
Top three noisy pixels from each quadrant. If the there are fewer than three noisy pixels in the level2.evt file, extra rows are filled as -1
| Pixel properties | Quadrant properties | ||||||
|---|---|---|---|---|---|---|---|
| Quadrant | DetID | PixID | Counts | Sigma | Mean | Median | Sigma |
| A | 15 | 79 | 128952 | 848.45 | 745 | 730 | 151.1 |
| A | 15 | 236 | 34727 | 224.96 | 745 | 730 | 151.1 |
| A | 8 | 15 | 17358 | 110.03 | 745 | 730 | 151.1 |
| B | 4 | 81 | 55648 | 378.09 | 761 | 743 | 145.2 |
| B | 15 | 204 | 36465 | 245.99 | 761 | 743 | 145.2 |
| B | 12 | 111 | 13361 | 86.89 | 761 | 743 | 145.2 |
| C | 8 | 128 | 14680 | 82.3 | 731 | 734 | 169.5 |
| C | 8 | 112 | 7398 | 39.32 | 731 | 734 | 169.5 |
| C | 13 | 61 | 5881 | 30.37 | 731 | 734 | 169.5 |
| D | 12 | 233 | 182520 | 1034.22 | 720 | 700 | 175.8 |
| D | 12 | 110 | 34297 | 191.1 | 720 | 700 | 175.8 |
| D | 2 | 14 | 22163 | 122.08 | 720 | 700 | 175.8 |
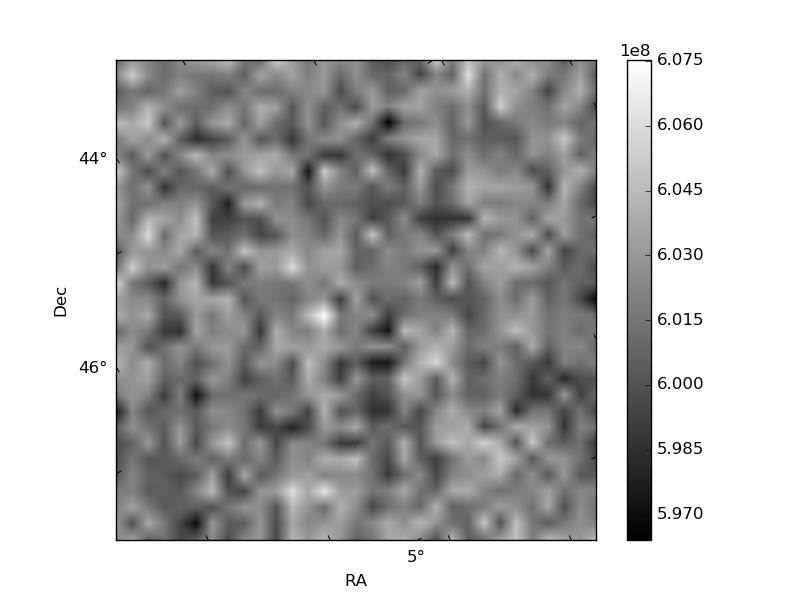
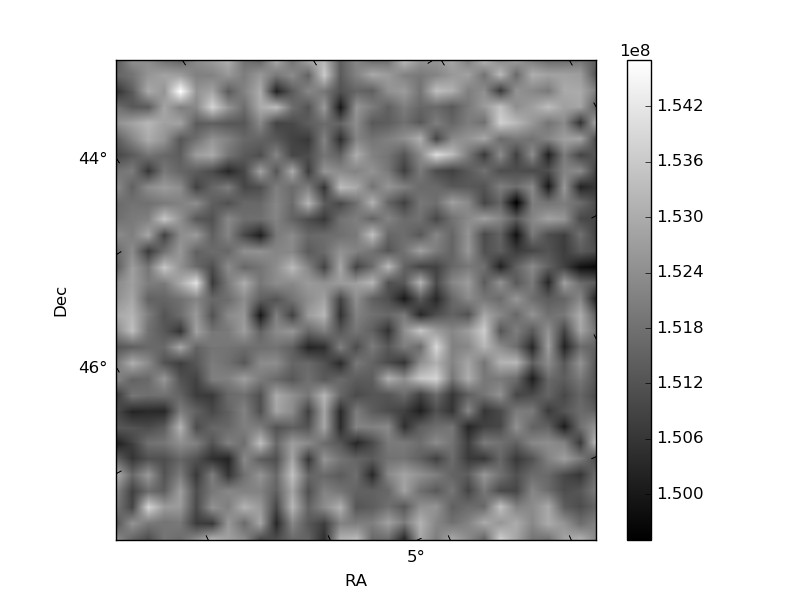
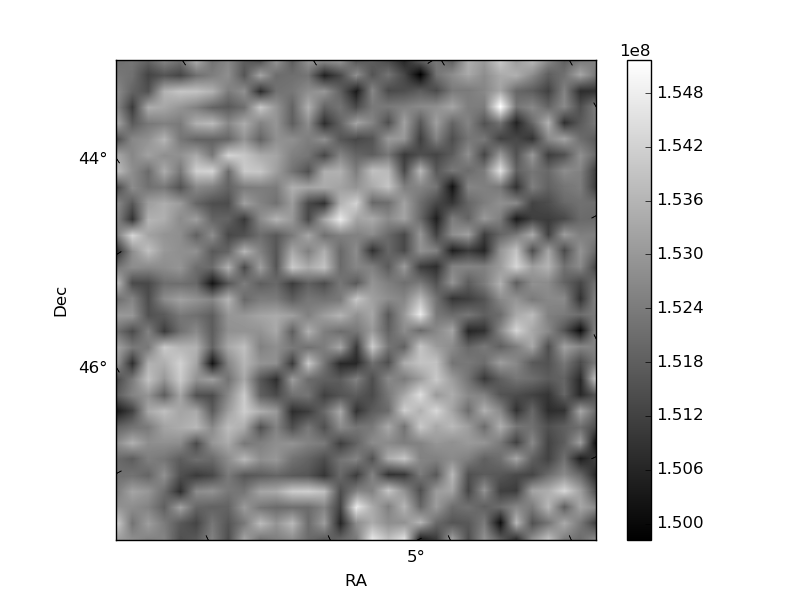
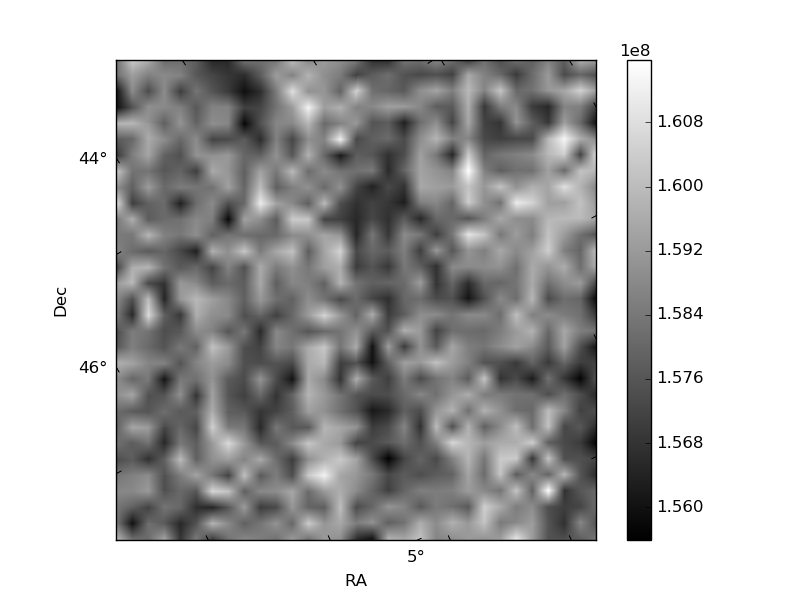
Histogram calculated using DETX and DETY for each event in the final _common_clean file
| Quadrant A | 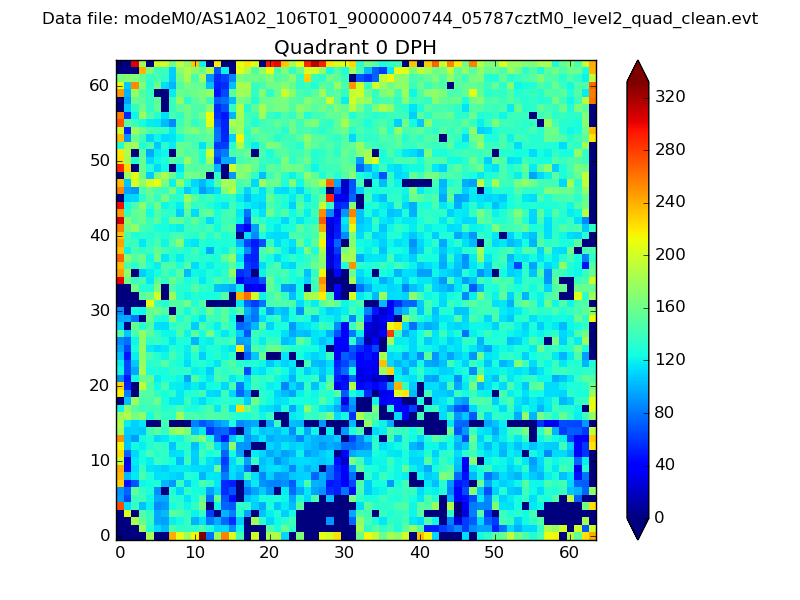 |
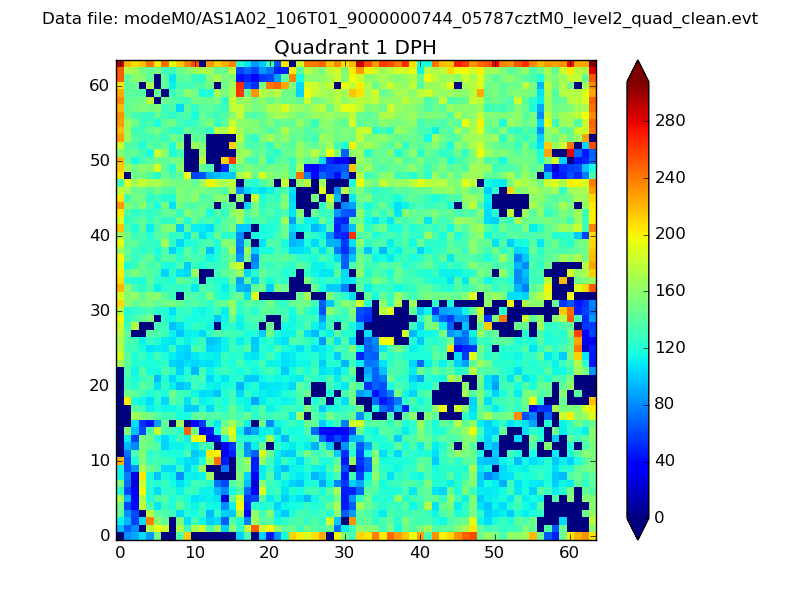 |
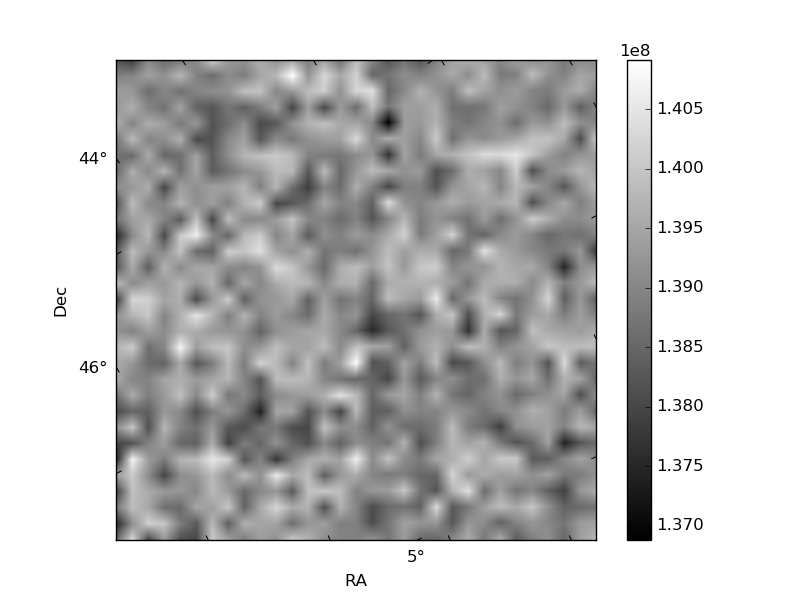
Quadrant B |
|---|---|---|---|
| Quadrant D | 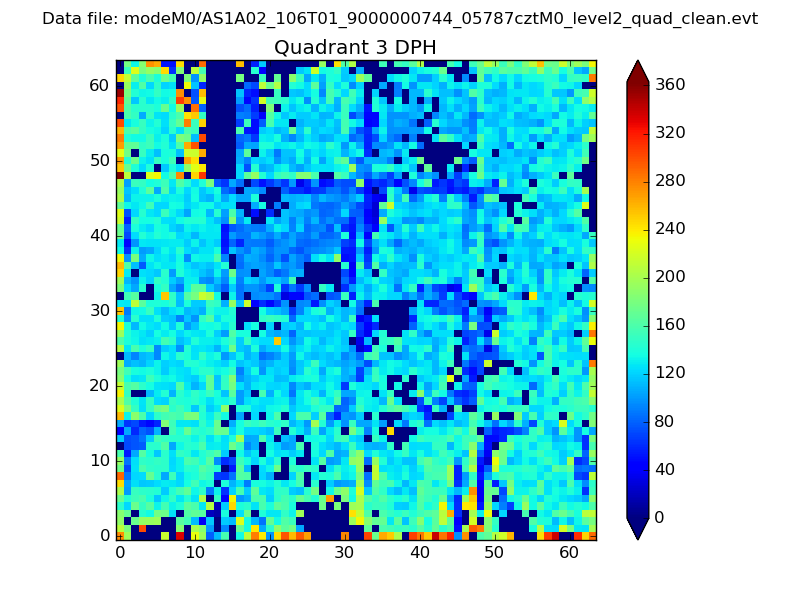 |
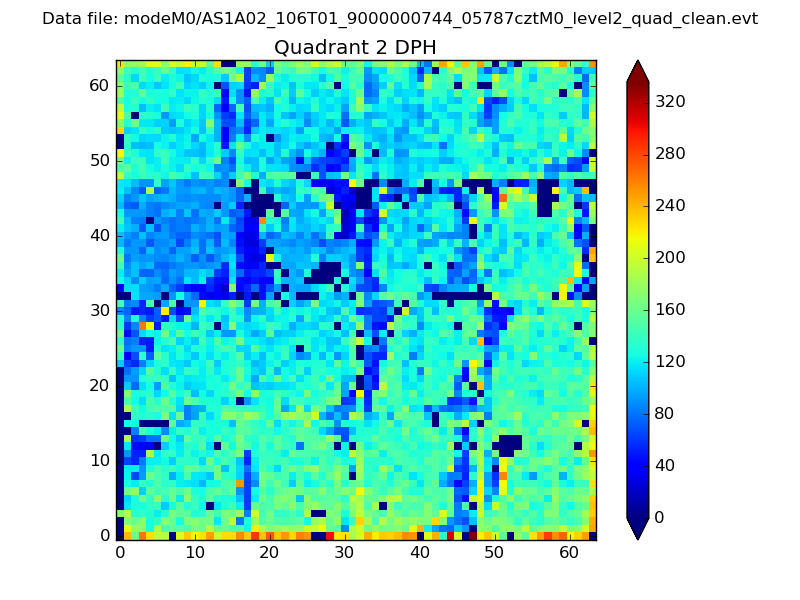 |
Quadrant C |
| Plot type | Count rate plots | Images |
|---|---|---|
| Comparison with Poisson distribution Blue bars denote a histogram of data divided into 1 sec bins. Red curve is a Poisson curve with rate = median count rate of data. |
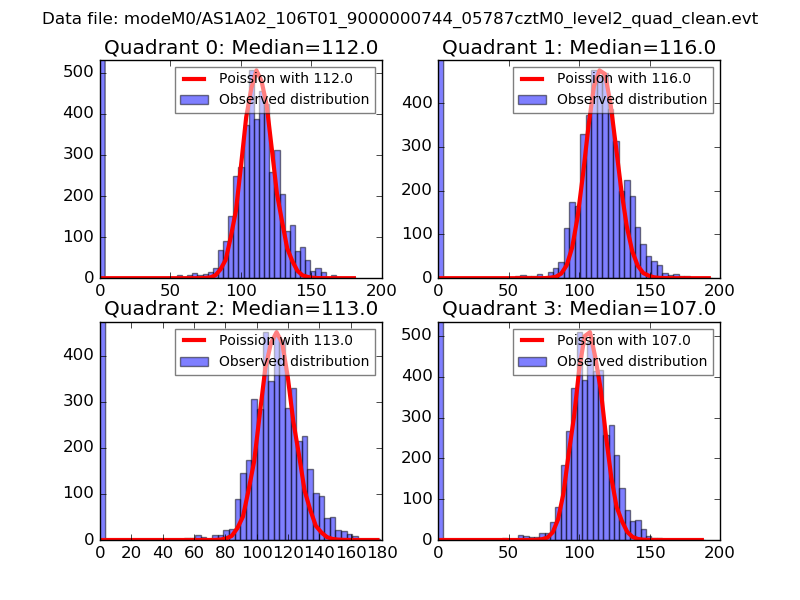 |
 |
| Quadrant-wise count rates Data is divided into 100 sec bins |
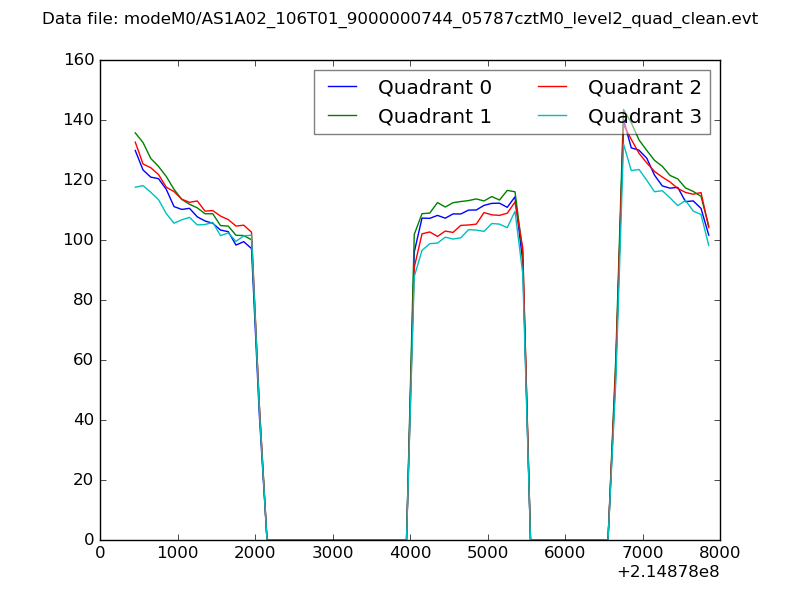 |
|
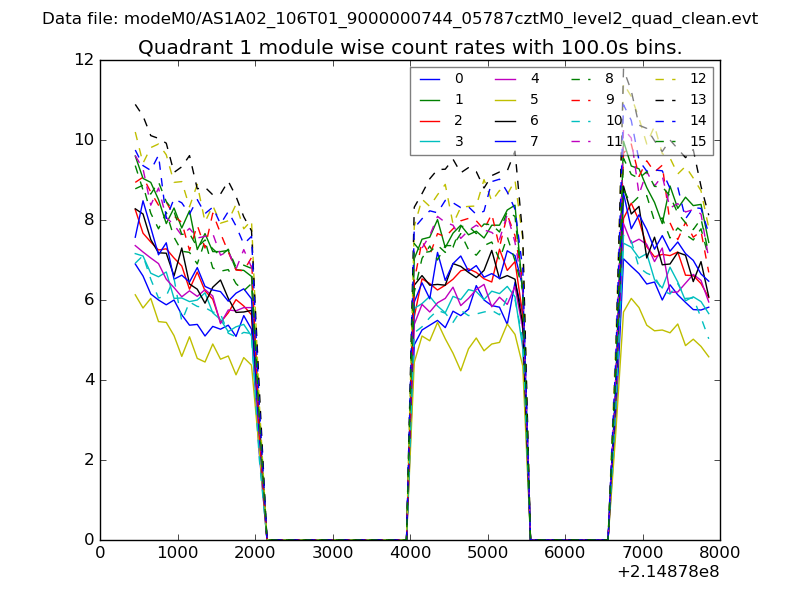
| Module-wise count rates for Quadrant A Data is divided into 100 sec bins |
 |
 |
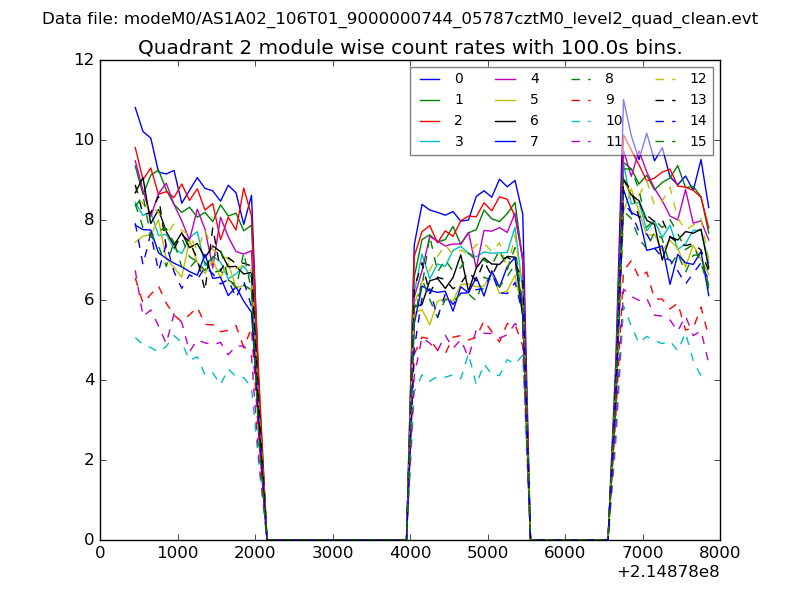
| Module-wise count rates for Quadrant B Data is divided into 100 sec bins |
 |
 |
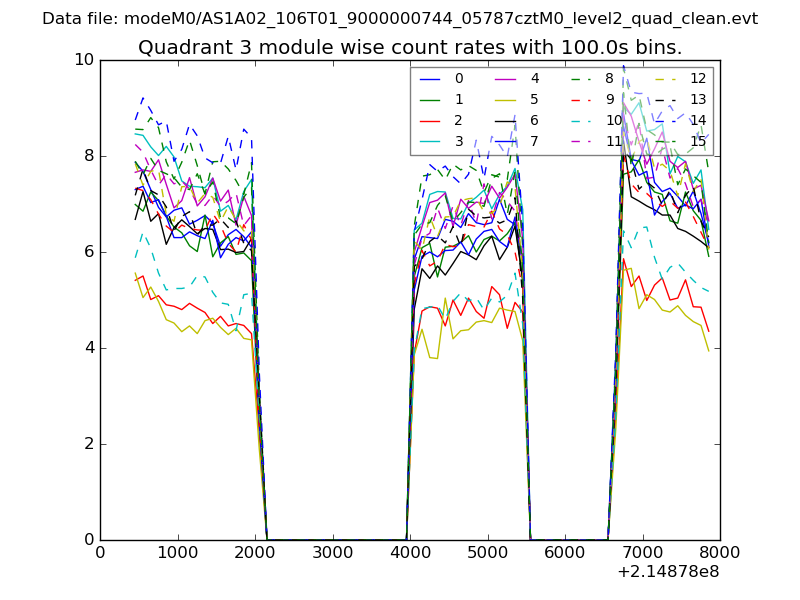
| Module-wise count rates for Quadrant C Data is divided into 100 sec bins |
 |
 |
| Module-wise count rates for Quadrant D Data is divided into 100 sec bins |
 |
 |
| Parameter | Plot |
|---|---|
| CZT HV Monitor | 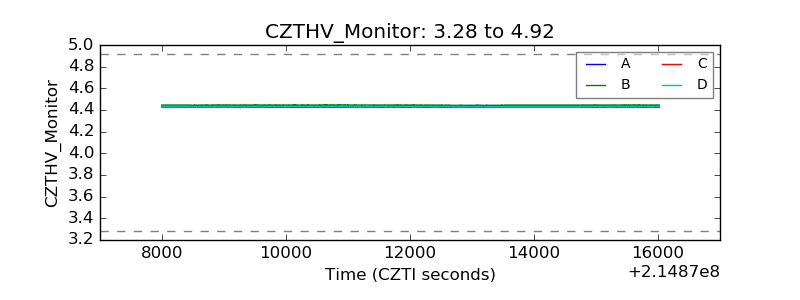 |
| D_VDD |  |
| Temperature 1 | 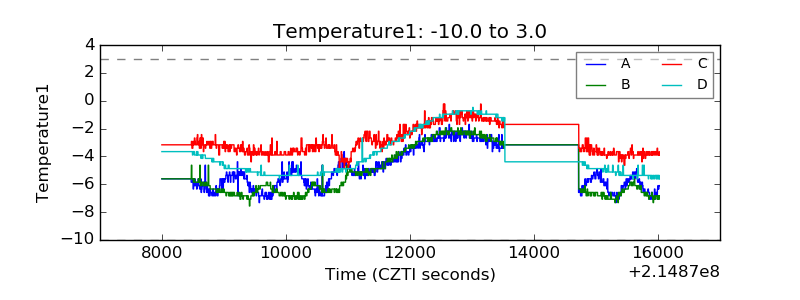 |
| Veto HV Monitor | 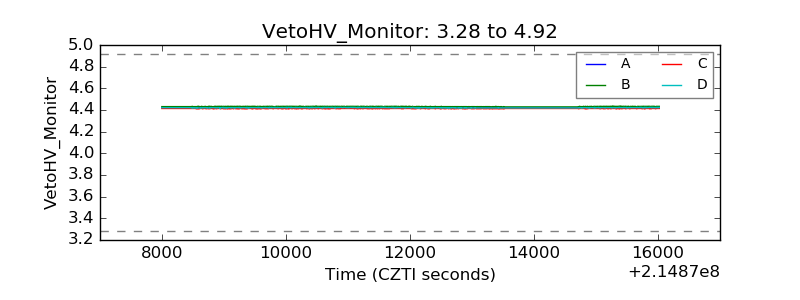 |
| Veto LLD |  |
| Alpha Counter | 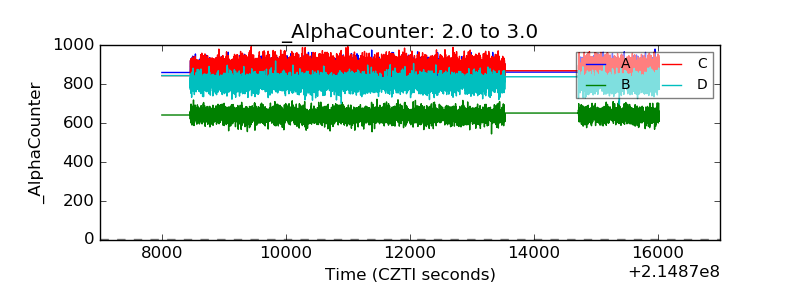 |
| _CPM_Rate | 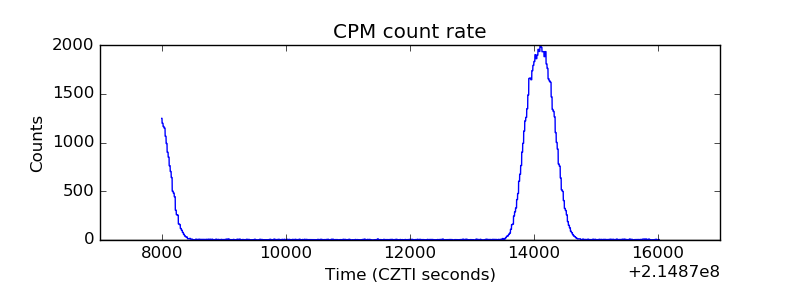 |
| CZT Counter | 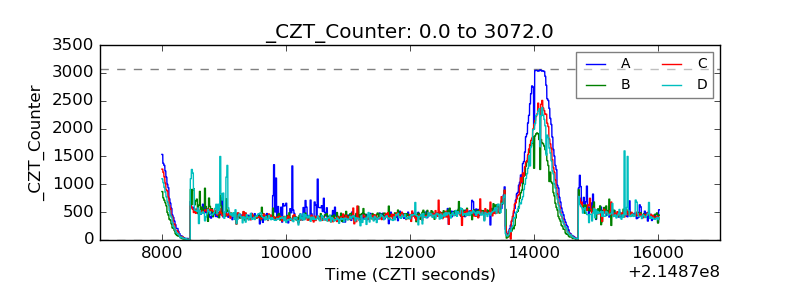 |
| +2.5 Volts monitor |  |
| +5 Volts monitor |  |
| _ROLL_ROT |  |
| _Roll_DEC | 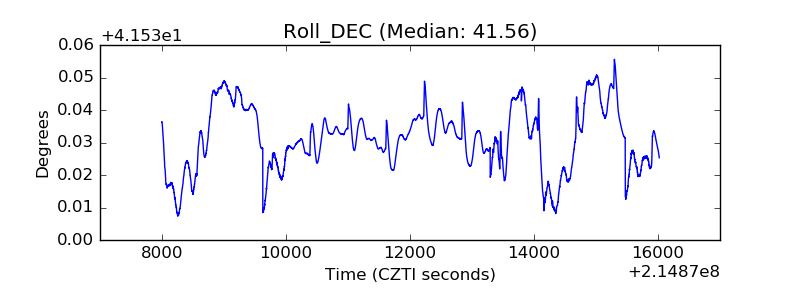 |
| _Roll_RA | 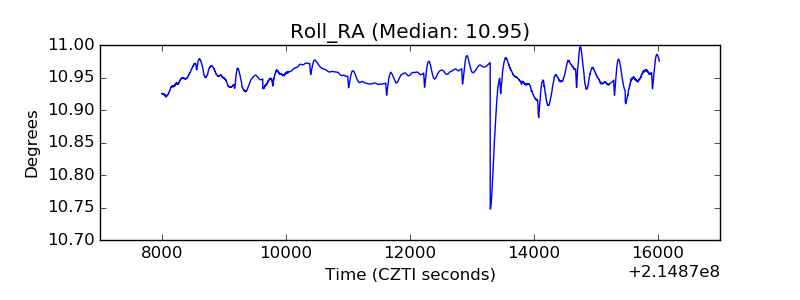 |
| Veto Counter |  |