| Param | Original file | Final file |
|---|---|---|
| Filename | modeM0/AS1A02_106T01_9000000744_05790cztM0_level2.evt | modeM0/AS1A02_106T01_9000000744_05790cztM0_level2_quad_clean.evt |
| Size (bytes) | 426,257,280 | 61,951,680 |
| Size | 406.5 MB | 59.1 MB |
| Events in quadrant A | 3,128,394 | 362,031 |
| Events in quadrant B | 3,323,816 | 370,740 |
| Events in quadrant C | 3,031,961 | 356,077 |
| Events in quadrant D | 2,988,916 | 339,257 |
| Mode M9 | |||
|---|---|---|---|
| Quadrant | BADHDUFLAG | Total packets | Discarded packets |
| A | 0 | 15 | 0 |
| B | 0 | 15 | 0 |
| C | 0 | 15 | 0 |
| D | 0 | 16 | 0 |
| Mode M0 | |||
|---|---|---|---|
| Quadrant | BADHDUFLAG | Total packets | Discarded packets |
| A | 0 | 13255 | 3 |
| B | 0 | 13706 | 2 |
| C | 0 | 13234 | 2 |
| D | 0 | 13268 | 2 |
| Mode SS | |||
|---|---|---|---|
| Quadrant | BADHDUFLAG | Total packets | Discarded packets |
| A | 0 | 130 | 0 |
| B | 0 | 130 | 0 |
| C | 0 | 130 | 0 |
| D | 0 | 130 | 0 |
| Quadrant | Total seconds | Saturated seconds | Saturation percentage |
|---|---|---|---|
| A | 6412 | 84 | 1.310044% |
| B | 6412 | 116 | 1.809108% |
| C | 6412 | 52 | 0.810979% |
| D | 6412 | 41 | 0.639426% |
Noise dominated data is calculated using 1-second bins in cleaned event files. If a bin has >2000 counts, and if more than 50% of those come from <1% of pixels, then it is considered to be noise-dominated and hence unusable.
| Quadrant | # 1 sec bins | Bins with >0 counts | Bins with >2000 counts | High rate bins dominated by noise | Noise dominated (total time) | Noise dominated (detector-on time) | Marked lightcurve |
|---|---|---|---|---|---|---|---|
| A | 7692 | 6413 | 0 | 0 | 0.00% | 0.00% | 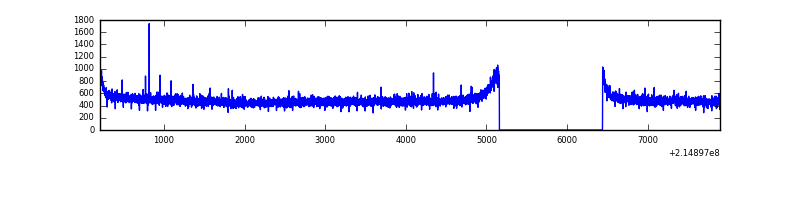 |
| B | 7692 | 6413 | 13 | 13 | 0.17% | 0.20% | 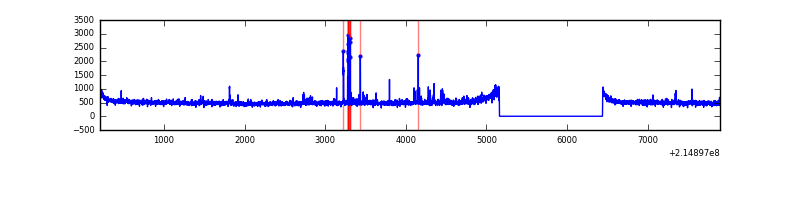 |
| C | 7692 | 6413 | 0 | 0 | 0.00% | 0.00% | 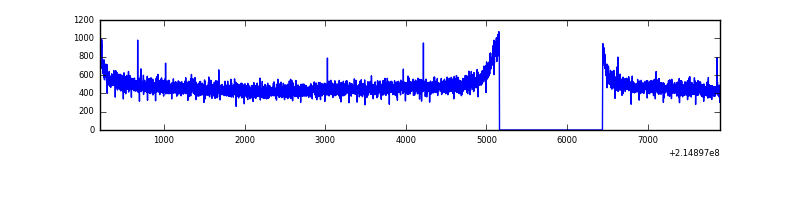 |
| D | 7692 | 6413 | 1 | 1 | 0.01% | 0.02% | 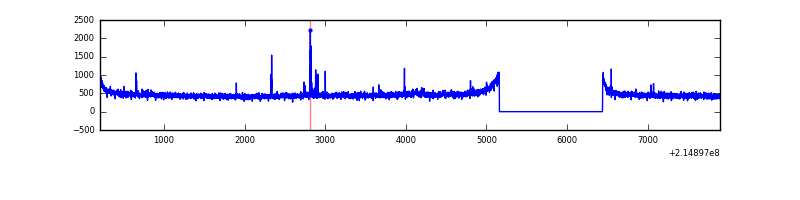 |
Top three noisy pixels from each quadrant. If the there are fewer than three noisy pixels in the level2.evt file, extra rows are filled as -1
| Pixel properties | Quadrant properties | ||||||
|---|---|---|---|---|---|---|---|
| Quadrant | DetID | PixID | Counts | Sigma | Mean | Median | Sigma |
| A | 8 | 15 | 11224 | 63.73 | 808 | 791 | 163.7 |
| A | 0 | 226 | 7840 | 43.06 | 808 | 791 | 163.7 |
| A | 12 | 194 | 7748 | 42.5 | 808 | 791 | 163.7 |
| B | 4 | 81 | 68380 | 437.42 | 818 | 799 | 154.5 |
| B | 15 | 54 | 45161 | 287.14 | 818 | 799 | 154.5 |
| B | 15 | 204 | 32467 | 204.97 | 818 | 799 | 154.5 |
| C | 13 | 61 | 6219 | 30.53 | 775 | 781 | 178.1 |
| C | 14 | 67 | 4273 | 19.6 | 775 | 781 | 178.1 |
| C | 1 | 16 | 2355 | 8.84 | 775 | 781 | 178.1 |
| D | 12 | 233 | 29155 | 150.43 | 774 | 750 | 188.8 |
| D | 11 | 241 | 15379 | 77.47 | 774 | 750 | 188.8 |
| D | 12 | 221 | 14112 | 70.76 | 774 | 750 | 188.8 |
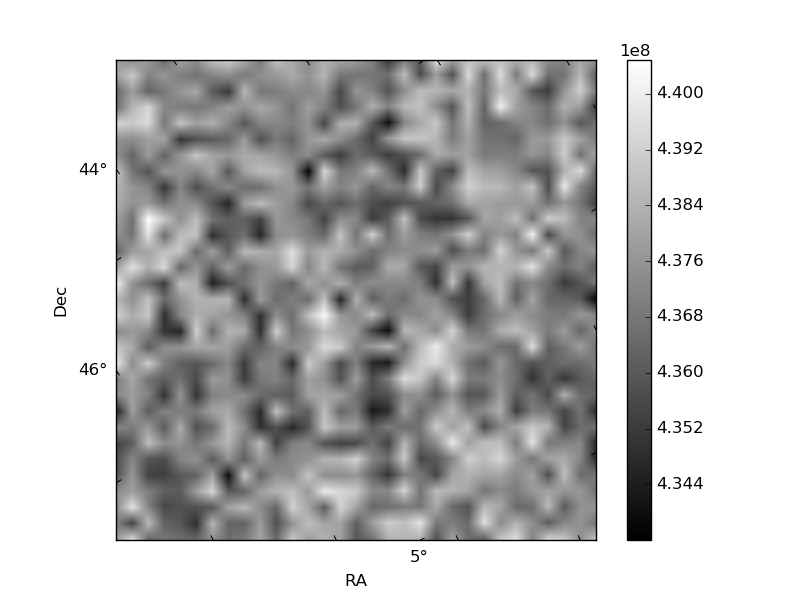
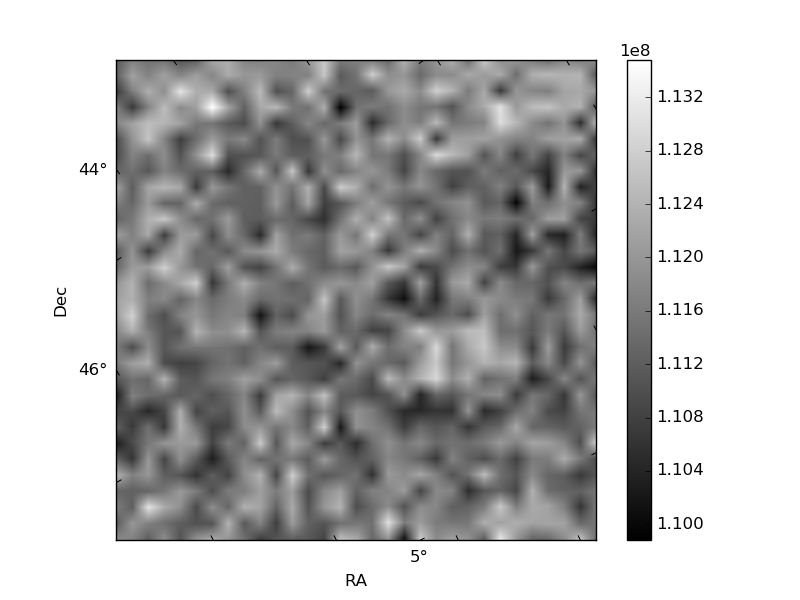
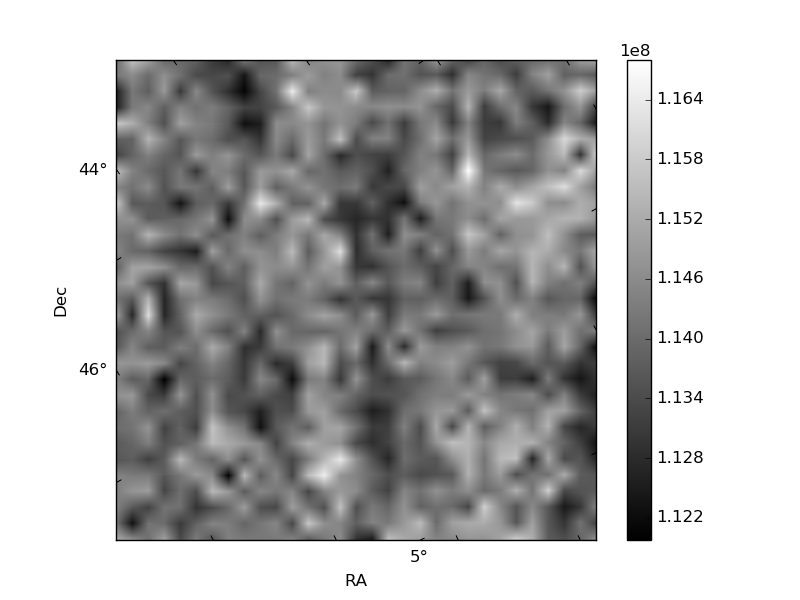
Histogram calculated using DETX and DETY for each event in the final _common_clean file
| Quadrant A | 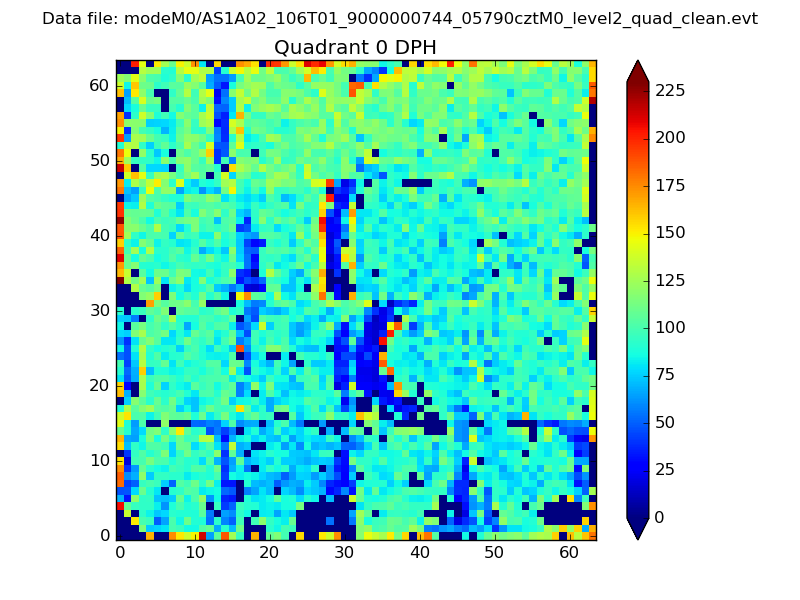 |
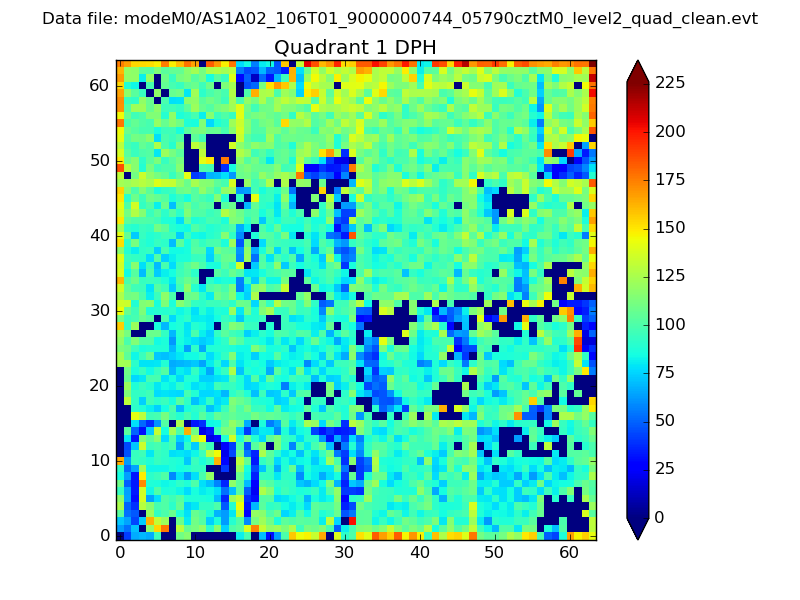 |
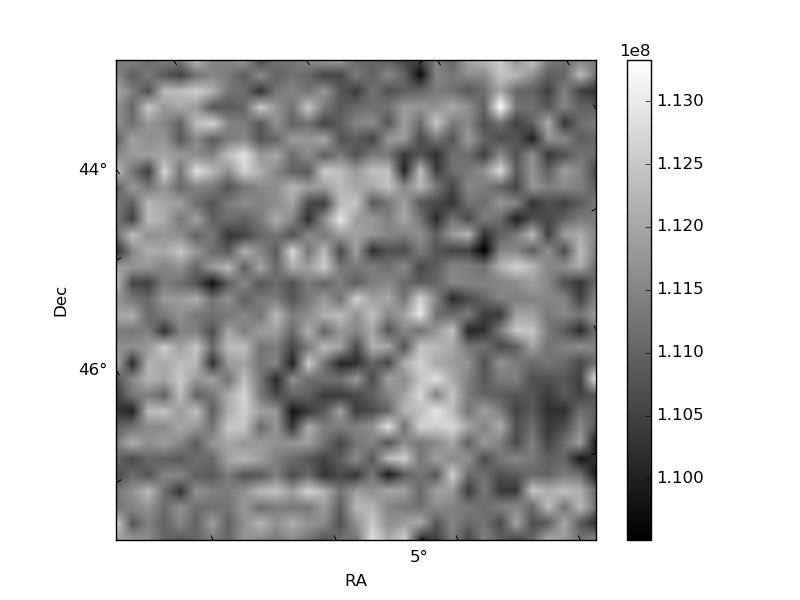
Quadrant B |
|---|---|---|---|
| Quadrant D | 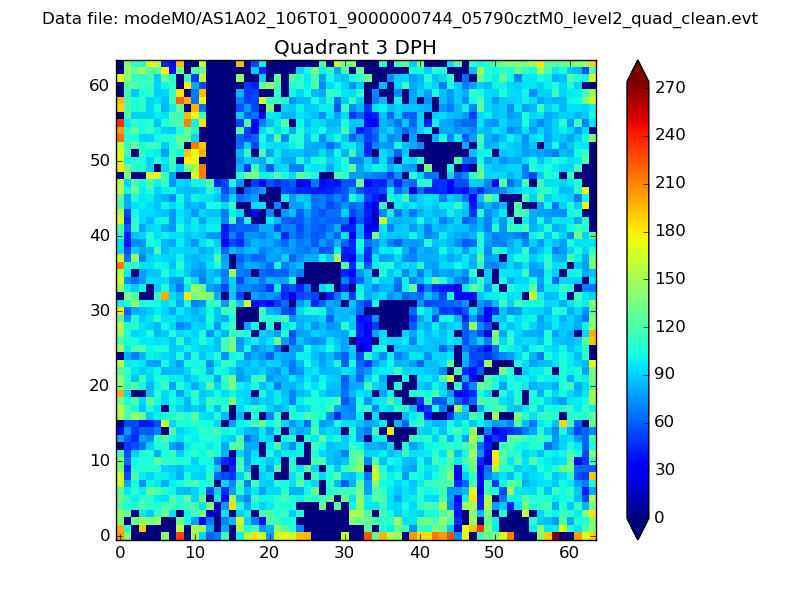 |
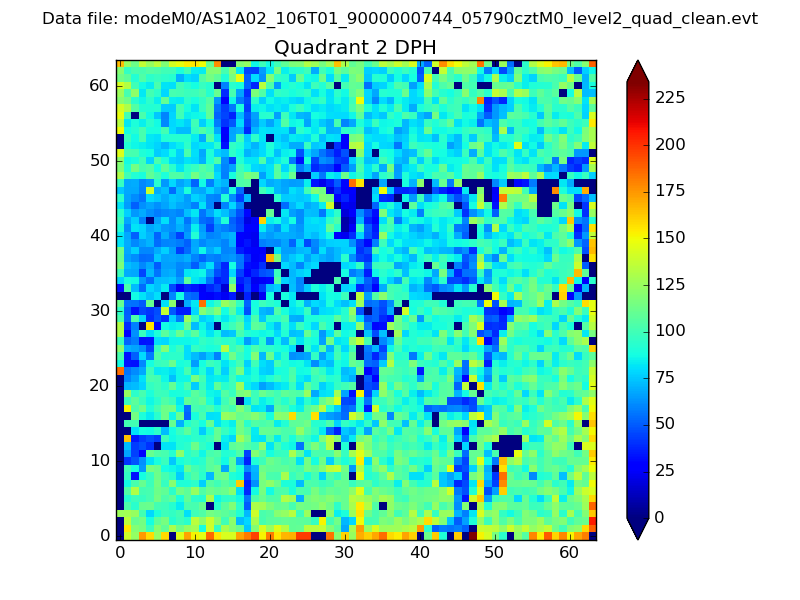 |
Quadrant C |
| Plot type | Count rate plots | Images |
|---|---|---|
| Comparison with Poisson distribution Blue bars denote a histogram of data divided into 1 sec bins. Red curve is a Poisson curve with rate = median count rate of data. |
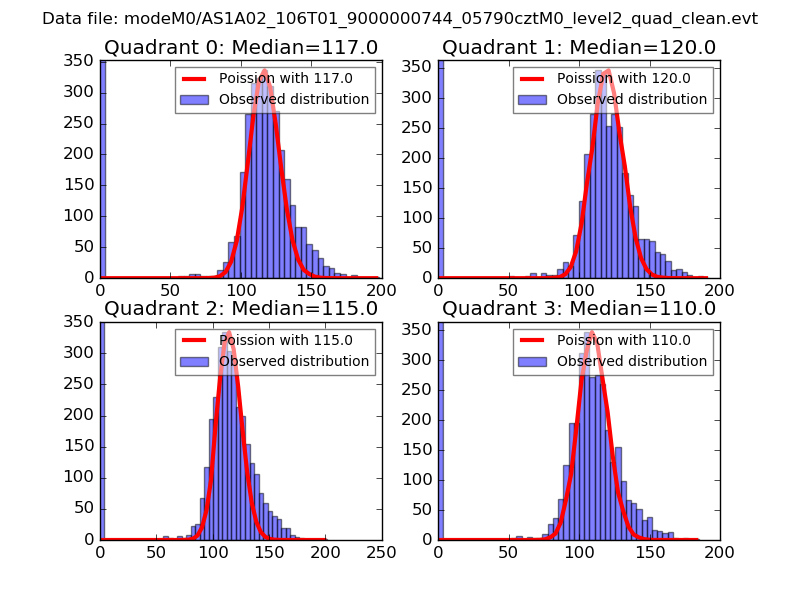 |
 |
| Quadrant-wise count rates Data is divided into 100 sec bins |
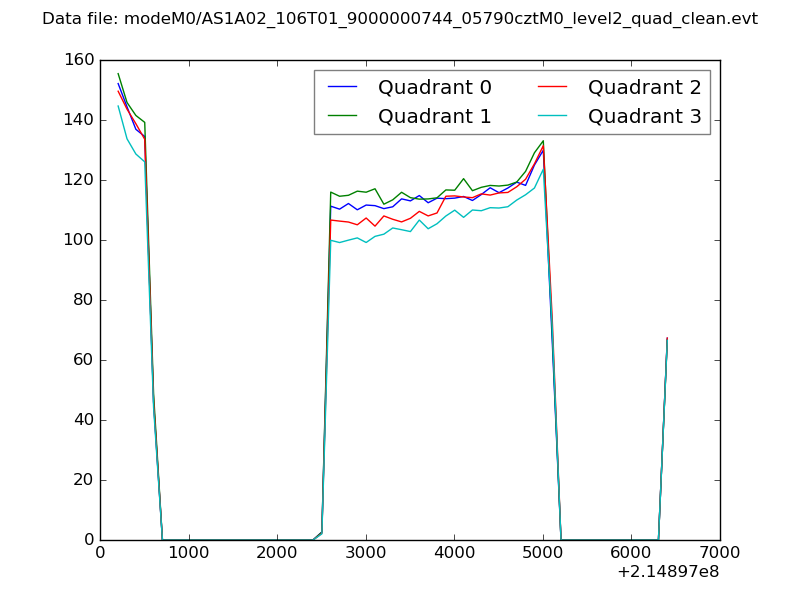 |
|
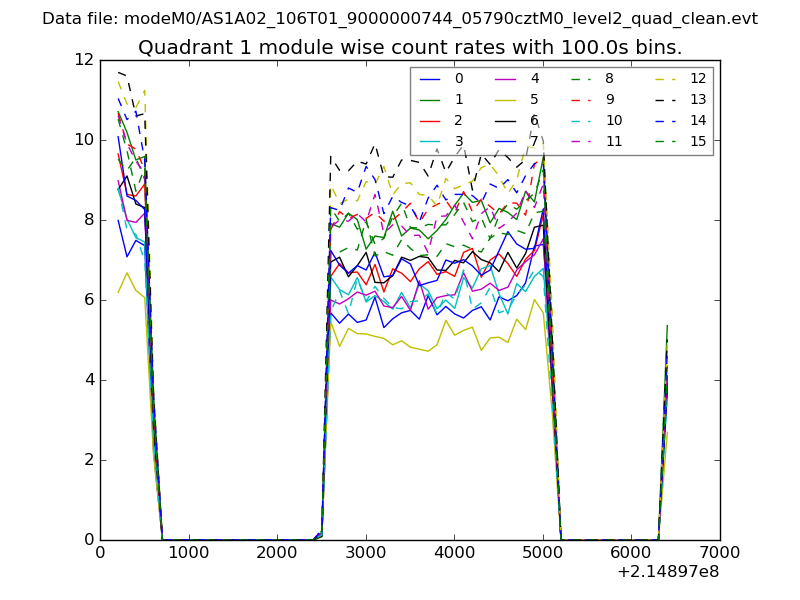
| Module-wise count rates for Quadrant A Data is divided into 100 sec bins |
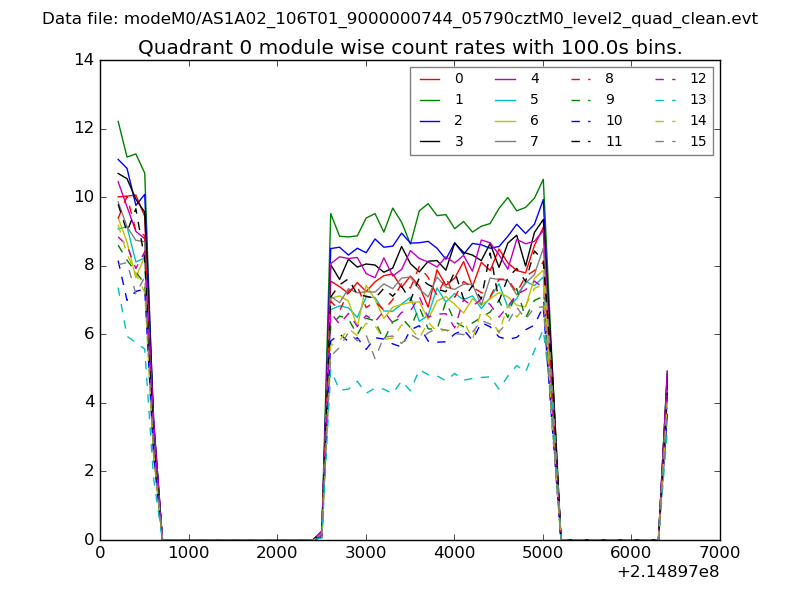 |
 |
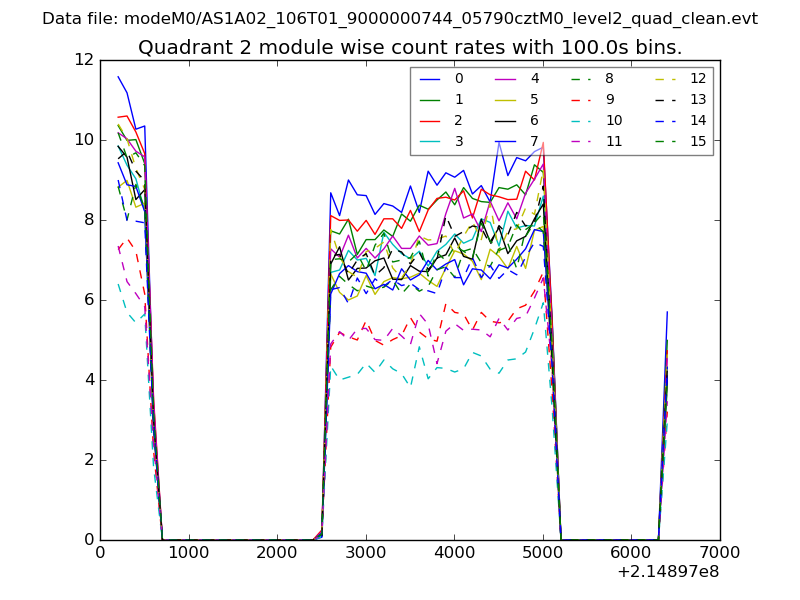
| Module-wise count rates for Quadrant B Data is divided into 100 sec bins |
 |
 |
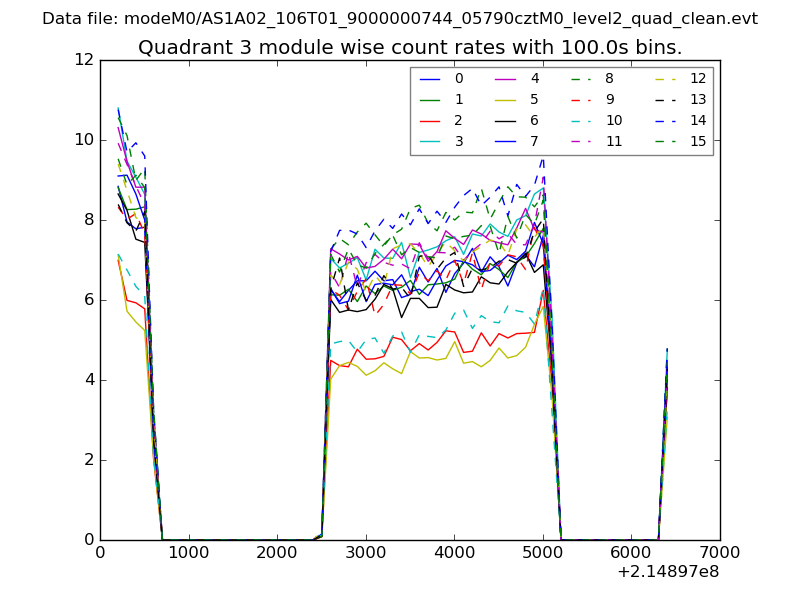
| Module-wise count rates for Quadrant C Data is divided into 100 sec bins |
 |
 |
| Module-wise count rates for Quadrant D Data is divided into 100 sec bins |
 |
 |
| Parameter | Plot |
|---|---|
| CZT HV Monitor |  |
| D_VDD | 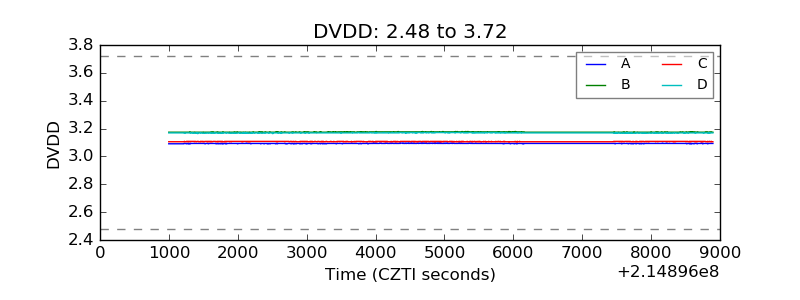 |
| Temperature 1 | 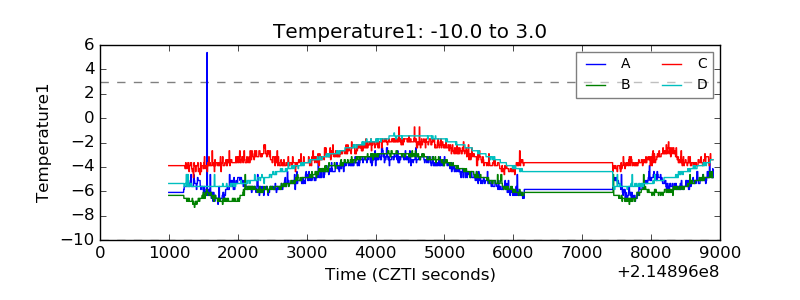 |
| Veto HV Monitor | 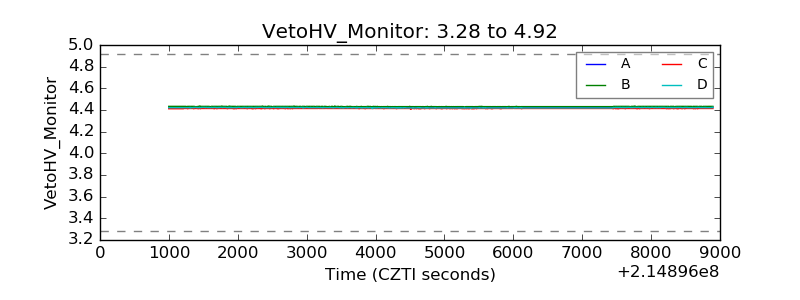 |
| Veto LLD | 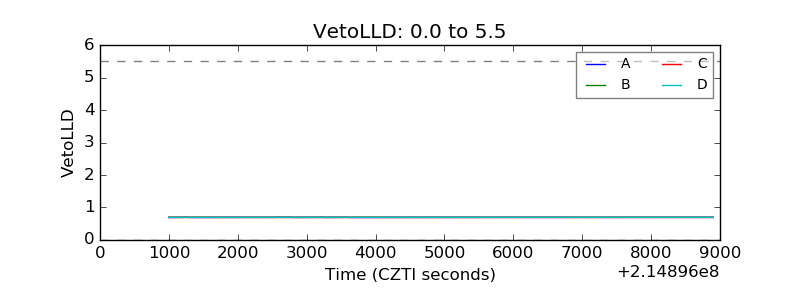 |
| Alpha Counter | 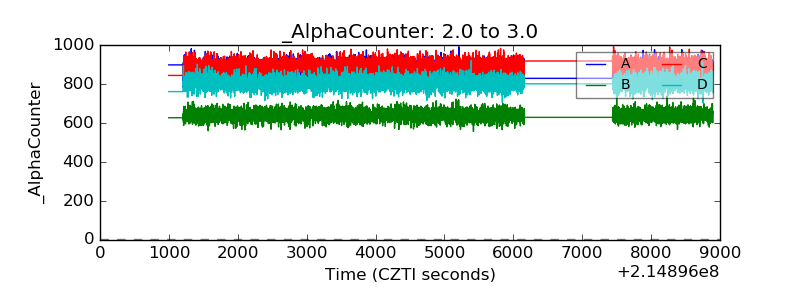 |
| _CPM_Rate | 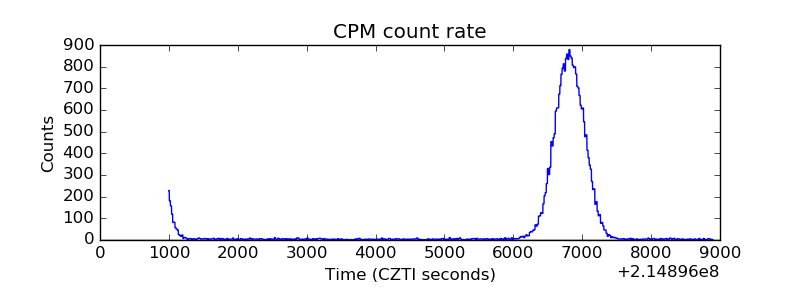 |
| CZT Counter | 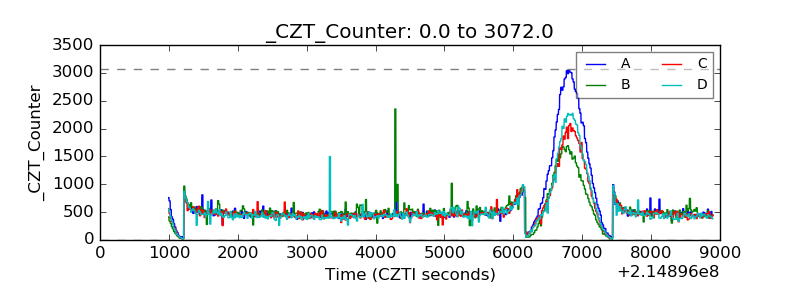 |
| +2.5 Volts monitor | 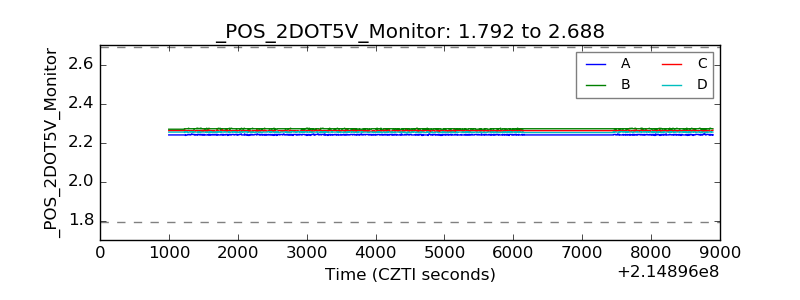 |
| +5 Volts monitor |  |
| _ROLL_ROT | 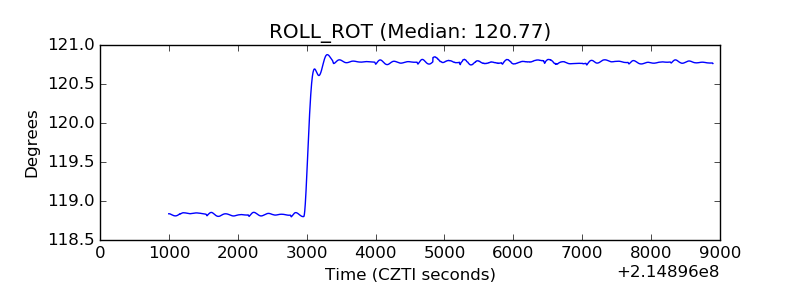 |
| _Roll_DEC | 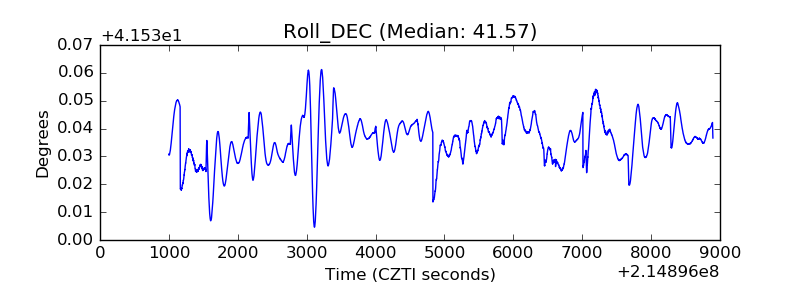 |
| _Roll_RA | 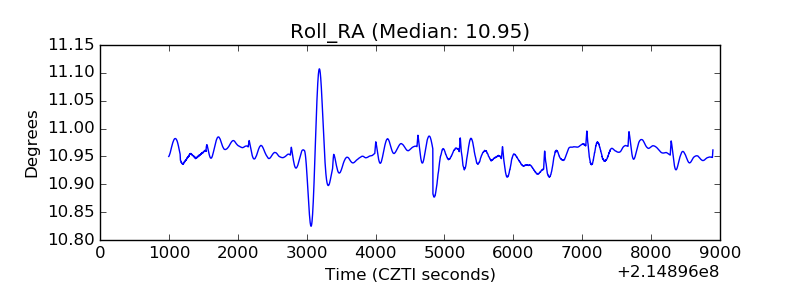 |
| Veto Counter | 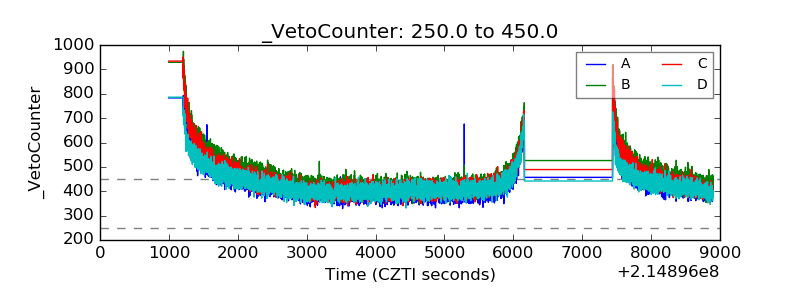 |