| Param | Original file | Final file |
|---|---|---|
| Filename | modeM0/AS1A02_106T01_9000000744_05791cztM0_level2.evt | modeM0/AS1A02_106T01_9000000744_05791cztM0_level2_quad_clean.evt |
| Size (bytes) | 450,328,320 | 61,493,760 |
| Size | 429.5 MB | 58.6 MB |
| Events in quadrant A | 3,143,618 | 355,198 |
| Events in quadrant B | 3,278,896 | 365,315 |
| Events in quadrant C | 3,040,909 | 350,721 |
| Events in quadrant D | 3,731,212 | 335,637 |
| Mode M9 | |||
|---|---|---|---|
| Quadrant | BADHDUFLAG | Total packets | Discarded packets |
| A | 0 | 19 | 0 |
| B | 0 | 19 | 0 |
| C | 0 | 19 | 0 |
| D | 0 | 20 | 0 |
| Mode M0 | |||
|---|---|---|---|
| Quadrant | BADHDUFLAG | Total packets | Discarded packets |
| A | 0 | 13551 | 3 |
| B | 0 | 13722 | 2 |
| C | 0 | 13483 | 2 |
| D | 0 | 15627 | 2 |
| Mode SS | |||
|---|---|---|---|
| Quadrant | BADHDUFLAG | Total packets | Discarded packets |
| A | 0 | 132 | 0 |
| B | 0 | 132 | 0 |
| C | 0 | 132 | 0 |
| D | 0 | 132 | 0 |
| Quadrant | Total seconds | Saturated seconds | Saturation percentage |
|---|---|---|---|
| A | 6524 | 122 | 1.870018% |
| B | 6524 | 126 | 1.931330% |
| C | 6524 | 90 | 1.379522% |
| D | 6524 | 294 | 4.506438% |
Noise dominated data is calculated using 1-second bins in cleaned event files. If a bin has >2000 counts, and if more than 50% of those come from <1% of pixels, then it is considered to be noise-dominated and hence unusable.
| Quadrant | # 1 sec bins | Bins with >0 counts | Bins with >2000 counts | High rate bins dominated by noise | Noise dominated (total time) | Noise dominated (detector-on time) | Marked lightcurve |
|---|---|---|---|---|---|---|---|
| A | 7634 | 6524 | 0 | 0 | 0.00% | 0.00% | 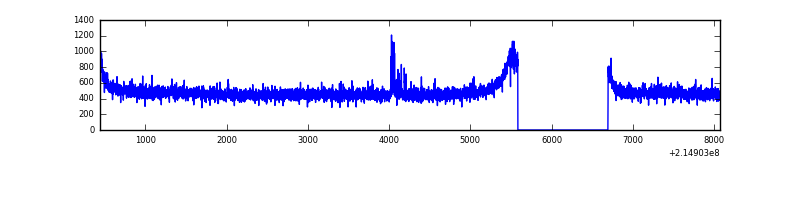 |
| B | 7634 | 6525 | 0 | 0 | 0.00% | 0.00% | 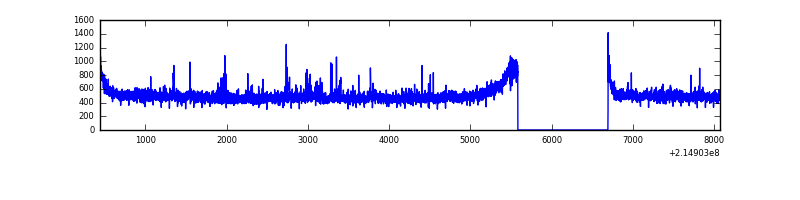 |
| C | 7634 | 6525 | 0 | 0 | 0.00% | 0.00% | 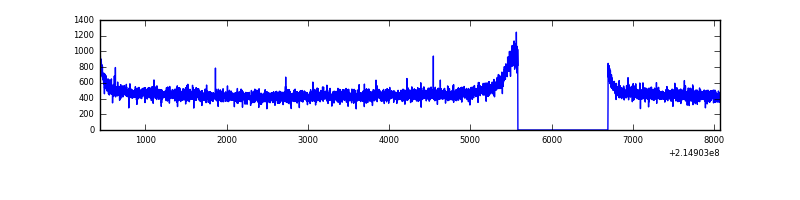 |
| D | 7634 | 6525 | 177 | 177 | 2.32% | 2.71% | 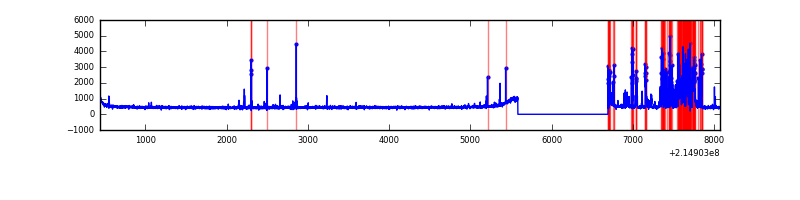 |
Top three noisy pixels from each quadrant. If the there are fewer than three noisy pixels in the level2.evt file, extra rows are filled as -1
| Pixel properties | Quadrant properties | ||||||
|---|---|---|---|---|---|---|---|
| Quadrant | DetID | PixID | Counts | Sigma | Mean | Median | Sigma |
| A | 7 | 16 | 24557 | 144.3 | 810 | 793 | 164.7 |
| A | 0 | 226 | 8007 | 43.8 | 810 | 793 | 164.7 |
| A | 12 | 194 | 7831 | 42.74 | 810 | 793 | 164.7 |
| B | 4 | 81 | 50022 | 313.52 | 817 | 798 | 157.0 |
| B | 15 | 204 | 48244 | 302.19 | 817 | 798 | 157.0 |
| B | 0 | 219 | 17349 | 105.42 | 817 | 798 | 157.0 |
| C | 13 | 61 | 6196 | 30.37 | 777 | 780 | 178.3 |
| C | 1 | 16 | 4021 | 18.17 | 777 | 780 | 178.3 |
| C | 14 | 67 | 3791 | 16.88 | 777 | 780 | 178.3 |
| D | 12 | 233 | 742707 | 3980.07 | 769 | 747 | 186.4 |
| D | 8 | 195 | 37898 | 199.29 | 769 | 747 | 186.4 |
| D | 7 | 55 | 18953 | 97.66 | 769 | 747 | 186.4 |
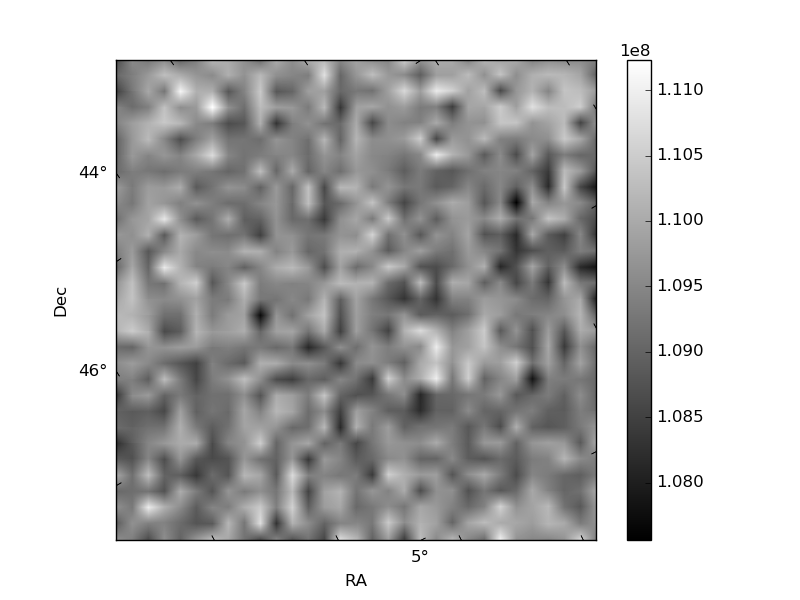
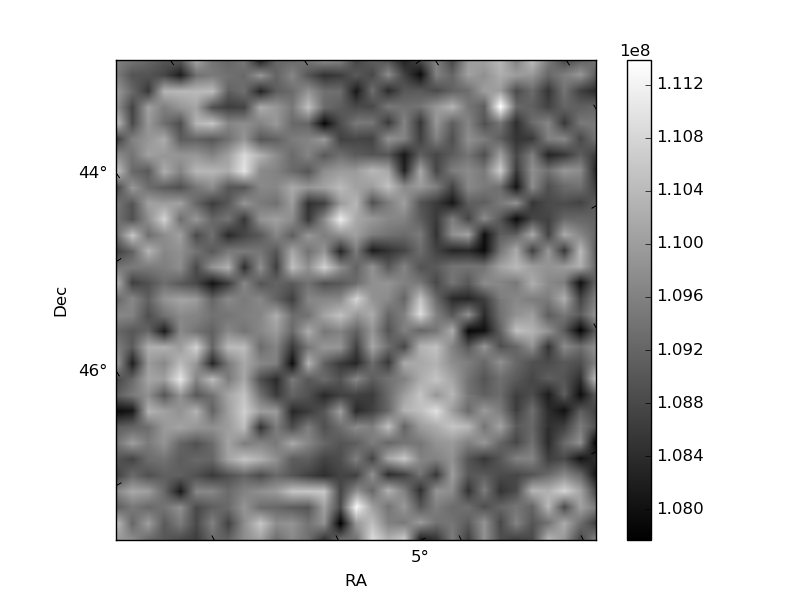
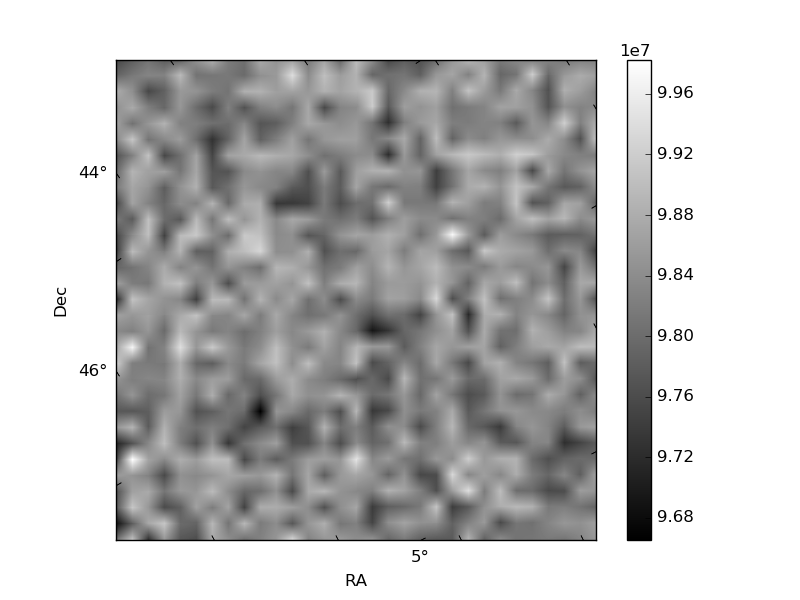
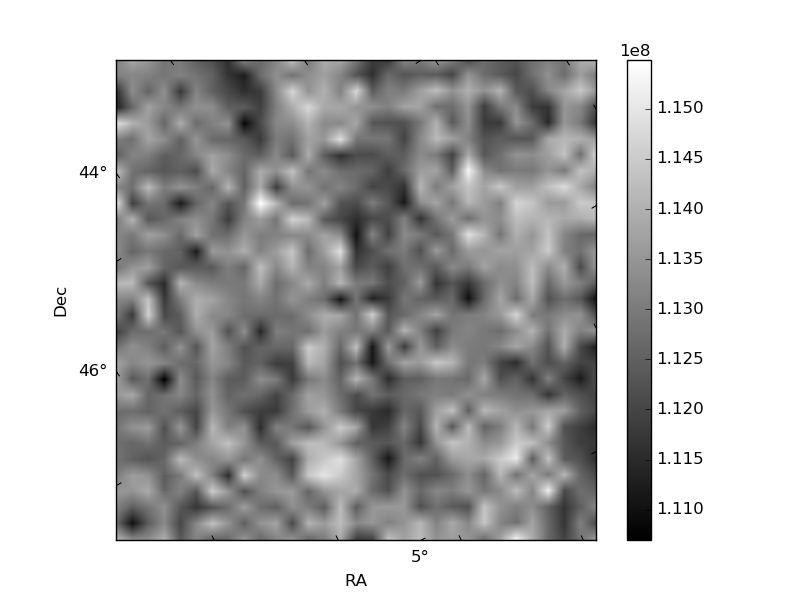
Histogram calculated using DETX and DETY for each event in the final _common_clean file
| Quadrant A |  |
 |
Quadrant B |
|---|---|---|---|
| Quadrant D |  |
 |
Quadrant C |
| Plot type | Count rate plots | Images |
|---|---|---|
| Comparison with Poisson distribution Blue bars denote a histogram of data divided into 1 sec bins. Red curve is a Poisson curve with rate = median count rate of data. |
 |
 |
| Quadrant-wise count rates Data is divided into 100 sec bins |
 |
|
| Module-wise count rates for Quadrant A Data is divided into 100 sec bins |
 |
 |
| Module-wise count rates for Quadrant B Data is divided into 100 sec bins |
 |
 |
| Module-wise count rates for Quadrant C Data is divided into 100 sec bins |
 |
 |
| Module-wise count rates for Quadrant D Data is divided into 100 sec bins |
 |
 |
| Parameter | Plot |
|---|---|
| CZT HV Monitor |  |
| D_VDD |  |
| Temperature 1 |  |
| Veto HV Monitor |  |
| Veto LLD |  |
| Alpha Counter |  |
| _CPM_Rate |  |
| CZT Counter |  |
| +2.5 Volts monitor |  |
| +5 Volts monitor |  |
| _ROLL_ROT |  |
| _Roll_DEC |  |
| _Roll_RA |  |
| Veto Counter |  |