| Param | Original file | Final file |
|---|---|---|
| Filename | modeM0/AS1A02_106T01_9000000744_05792cztM0_level2.evt | modeM0/AS1A02_106T01_9000000744_05792cztM0_level2_quad_clean.evt |
| Size (bytes) | 532,474,560 | 87,768,000 |
| Size | 507.8 MB | 83.7 MB |
| Events in quadrant A | 3,708,830 | 529,295 |
| Events in quadrant B | 3,889,240 | 544,580 |
| Events in quadrant C | 3,649,147 | 530,888 |
| Events in quadrant D | 4,346,905 | 508,484 |
| Mode M9 | |||
|---|---|---|---|
| Quadrant | BADHDUFLAG | Total packets | Discarded packets |
| A | 0 | 18 | 0 |
| B | 0 | 18 | 0 |
| C | 0 | 18 | 0 |
| D | 0 | 18 | 0 |
| Mode M0 | |||
|---|---|---|---|
| Quadrant | BADHDUFLAG | Total packets | Discarded packets |
| A | 0 | 16293 | 3 |
| B | 0 | 16549 | 2 |
| C | 0 | 16260 | 2 |
| D | 0 | 18475 | 2 |
| Mode SS | |||
|---|---|---|---|
| Quadrant | BADHDUFLAG | Total packets | Discarded packets |
| A | 0 | 162 | 0 |
| B | 0 | 162 | 0 |
| C | 0 | 162 | 0 |
| D | 0 | 162 | 0 |
| Quadrant | Total seconds | Saturated seconds | Saturation percentage |
|---|---|---|---|
| A | 7822 | 245 | 3.132191% |
| B | 7822 | 250 | 3.196114% |
| C | 7822 | 183 | 2.339555% |
| D | 7822 | 382 | 4.883661% |
Noise dominated data is calculated using 1-second bins in cleaned event files. If a bin has >2000 counts, and if more than 50% of those come from <1% of pixels, then it is considered to be noise-dominated and hence unusable.
| Quadrant | # 1 sec bins | Bins with >0 counts | Bins with >2000 counts | High rate bins dominated by noise | Noise dominated (total time) | Noise dominated (detector-on time) | Marked lightcurve |
|---|---|---|---|---|---|---|---|
| A | 9682 | 7824 | 1 | 1 | 0.01% | 0.01% |  |
| B | 9682 | 7825 | 4 | 4 | 0.04% | 0.05% | 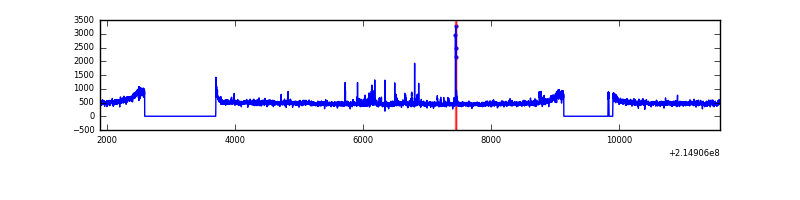 |
| C | 9682 | 7825 | 0 | 0 | 0.00% | 0.00% | 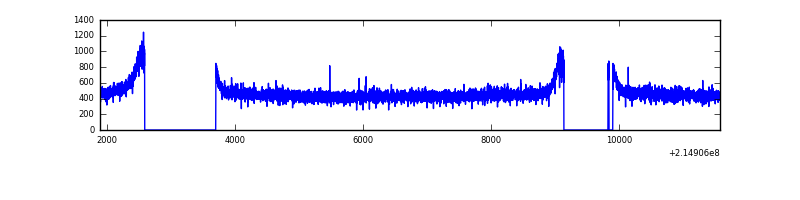 |
| D | 9682 | 7825 | 176 | 176 | 1.82% | 2.25% |  |
Top three noisy pixels from each quadrant. If the there are fewer than three noisy pixels in the level2.evt file, extra rows are filled as -1
| Pixel properties | Quadrant properties | ||||||
|---|---|---|---|---|---|---|---|
| Quadrant | DetID | PixID | Counts | Sigma | Mean | Median | Sigma |
| A | 7 | 16 | 16404 | 78.77 | 957 | 934 | 196.4 |
| A | 0 | 226 | 9328 | 42.74 | 957 | 934 | 196.4 |
| A | 12 | 194 | 9089 | 41.52 | 957 | 934 | 196.4 |
| B | 4 | 81 | 63722 | 336.77 | 970 | 946 | 186.4 |
| B | 15 | 204 | 35491 | 185.32 | 970 | 946 | 186.4 |
| B | 12 | 111 | 18698 | 95.23 | 970 | 946 | 186.4 |
| C | 13 | 61 | 7511 | 30.5 | 930 | 935 | 215.6 |
| C | 8 | 128 | 6901 | 27.67 | 930 | 935 | 215.6 |
| C | 14 | 67 | 5410 | 20.75 | 930 | 935 | 215.6 |
| D | 12 | 233 | 781209 | 3467.02 | 919 | 888 | 225.1 |
| D | 8 | 195 | 42343 | 184.19 | 919 | 888 | 225.1 |
| D | 11 | 241 | 17970 | 75.9 | 919 | 888 | 225.1 |
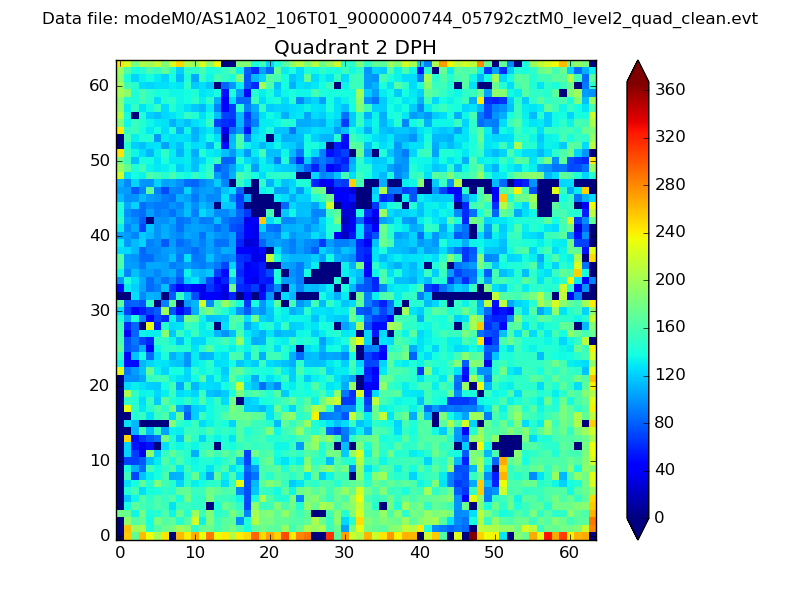
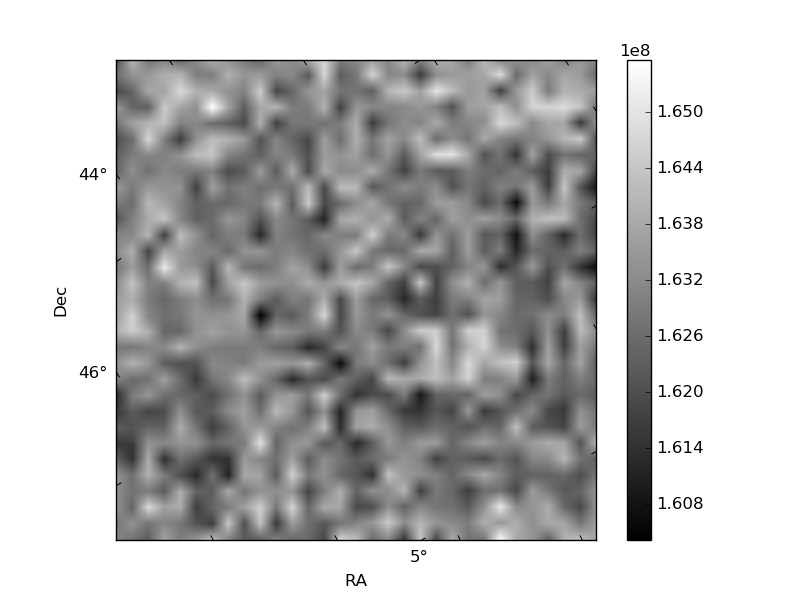
Histogram calculated using DETX and DETY for each event in the final _common_clean file
| Quadrant A | 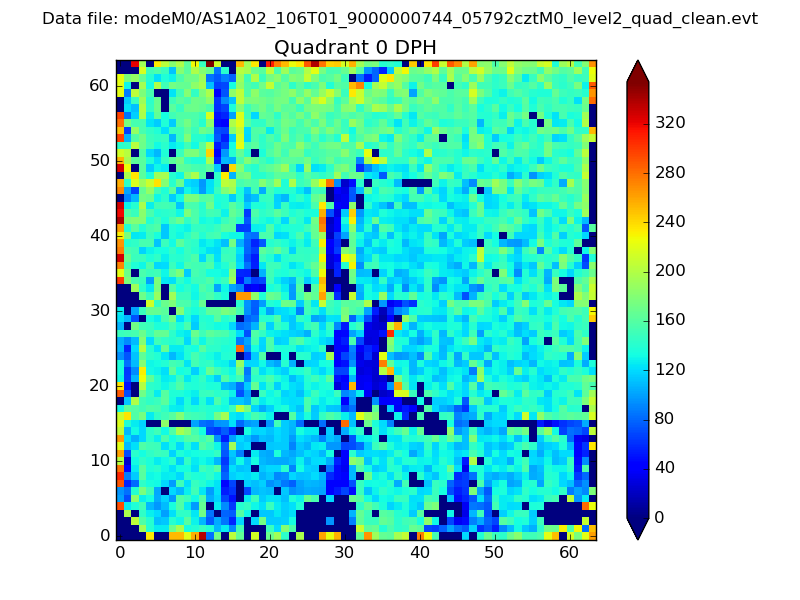 |
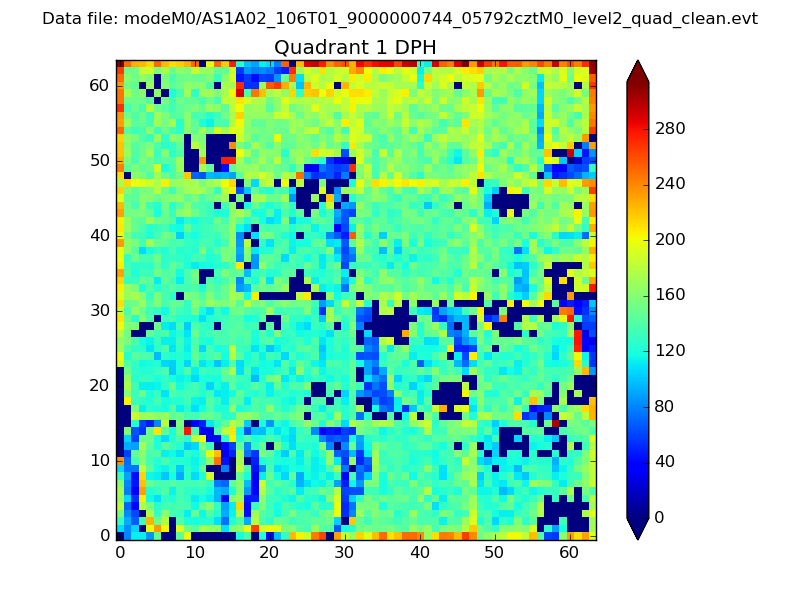 |
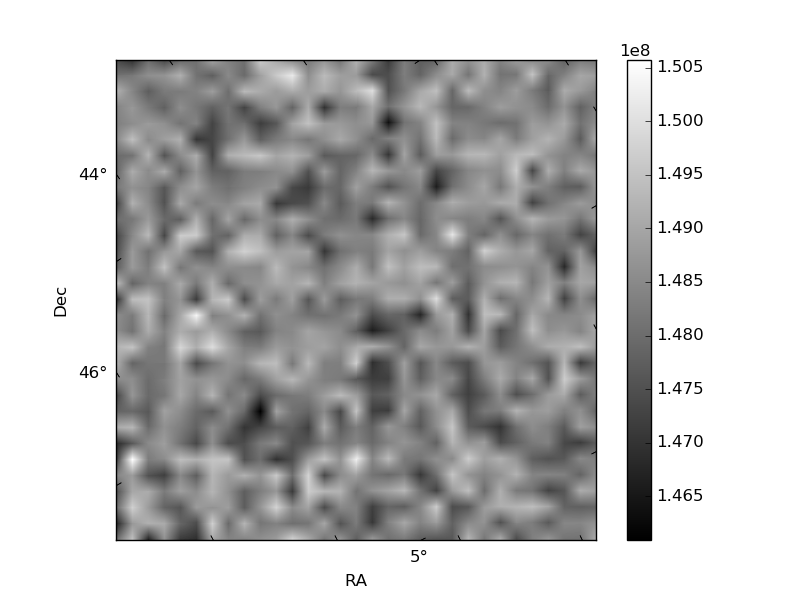
Quadrant B |
|---|---|---|---|
| Quadrant D | 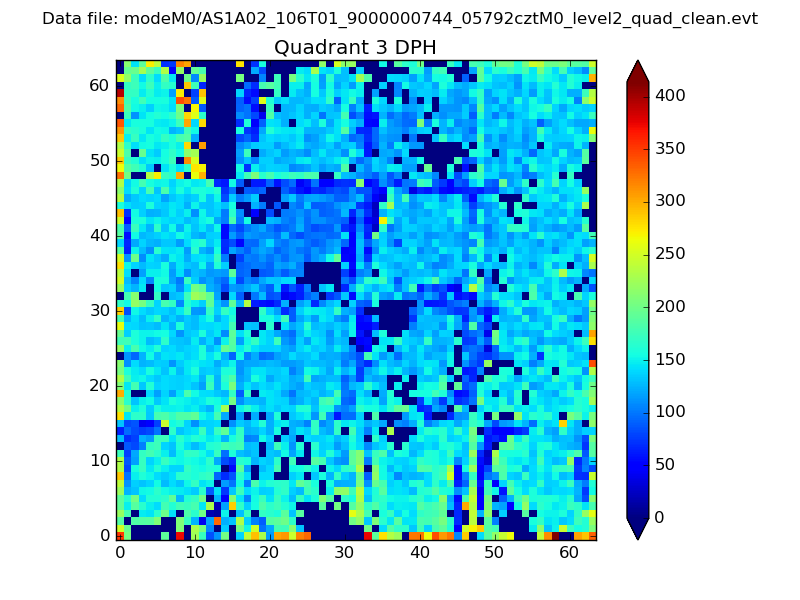 |
 |
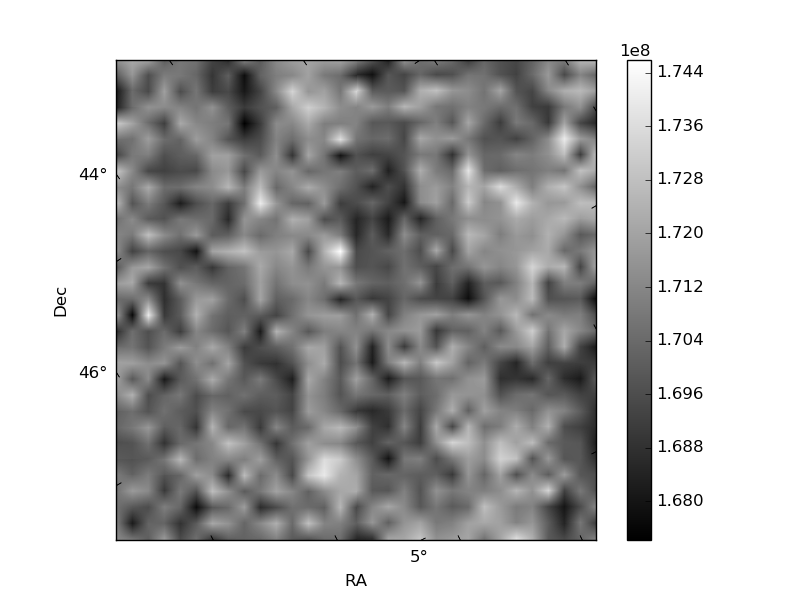
Quadrant C |
| Plot type | Count rate plots | Images |
|---|---|---|
| Comparison with Poisson distribution Blue bars denote a histogram of data divided into 1 sec bins. Red curve is a Poisson curve with rate = median count rate of data. |
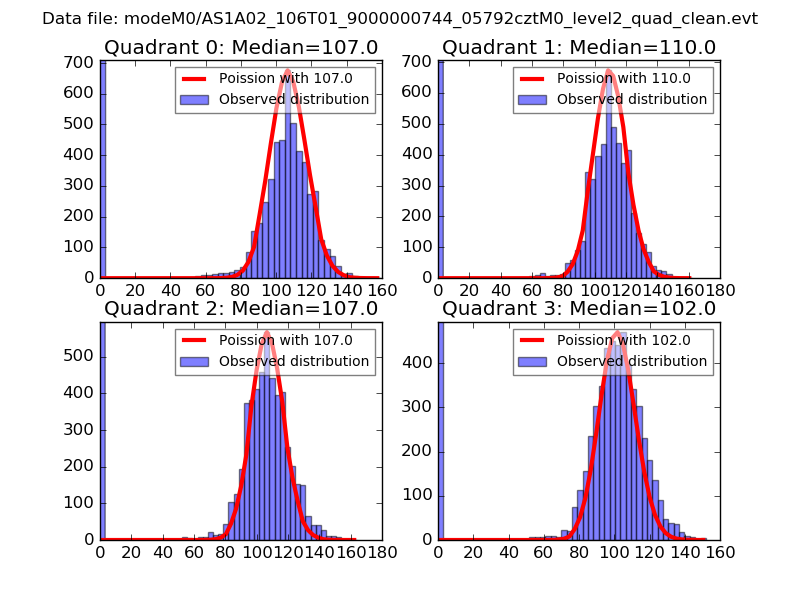 |
 |
| Quadrant-wise count rates Data is divided into 100 sec bins |
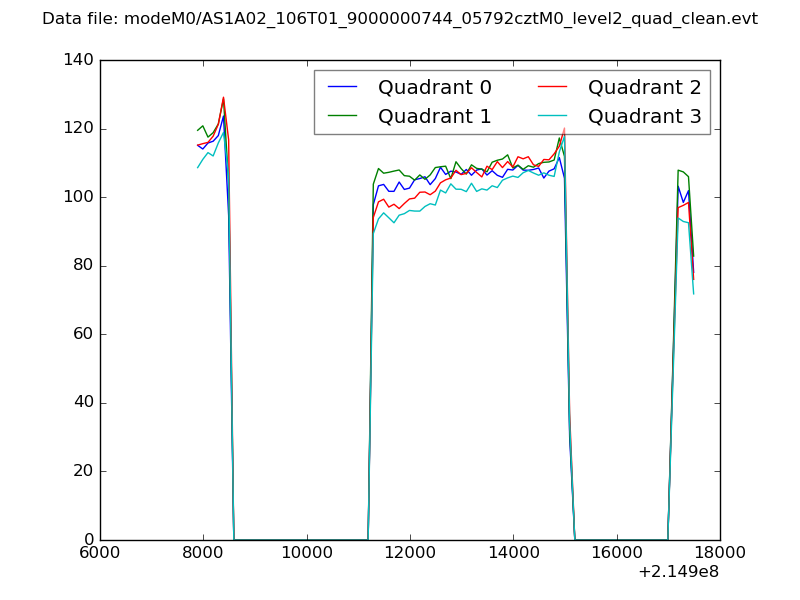 |
|
| Module-wise count rates for Quadrant A Data is divided into 100 sec bins |
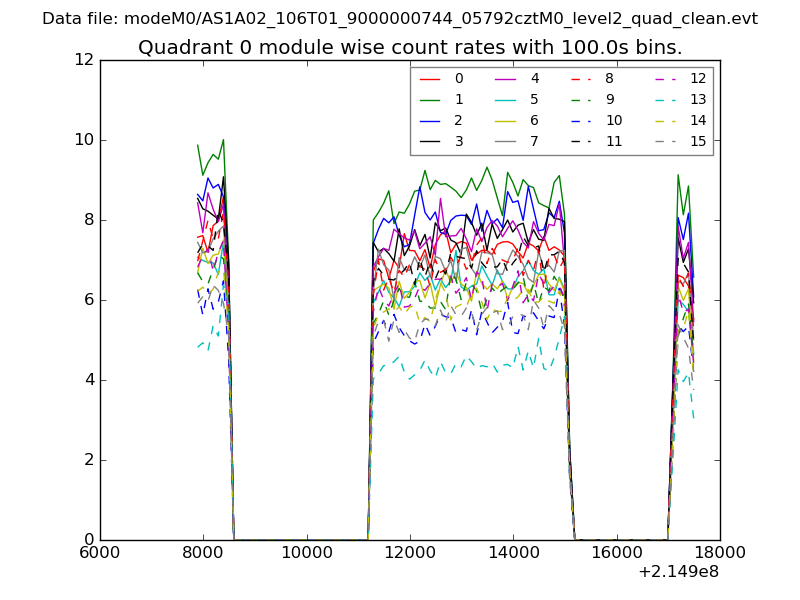 |
 |
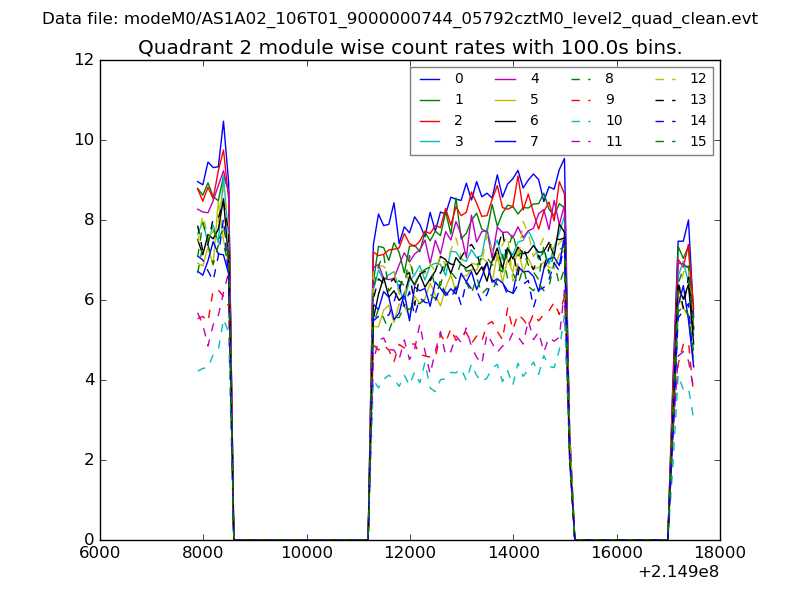
| Module-wise count rates for Quadrant B Data is divided into 100 sec bins |
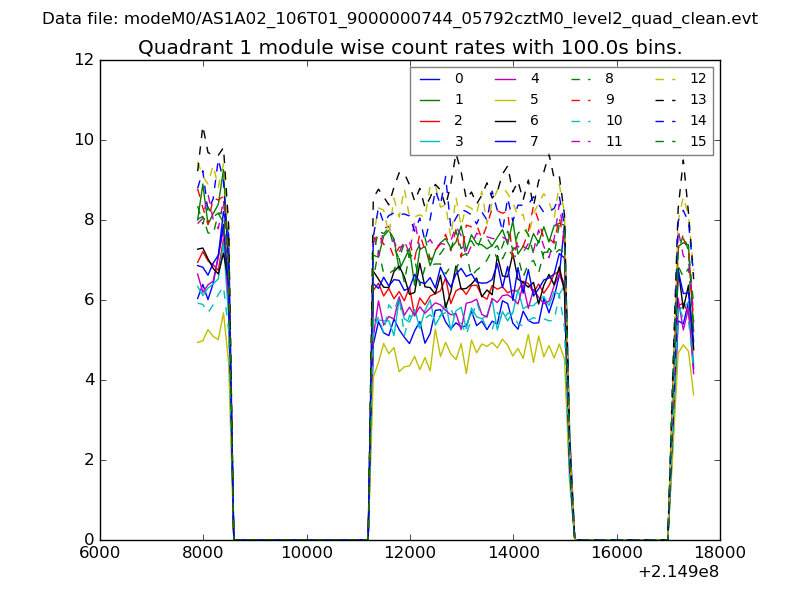 |
 |
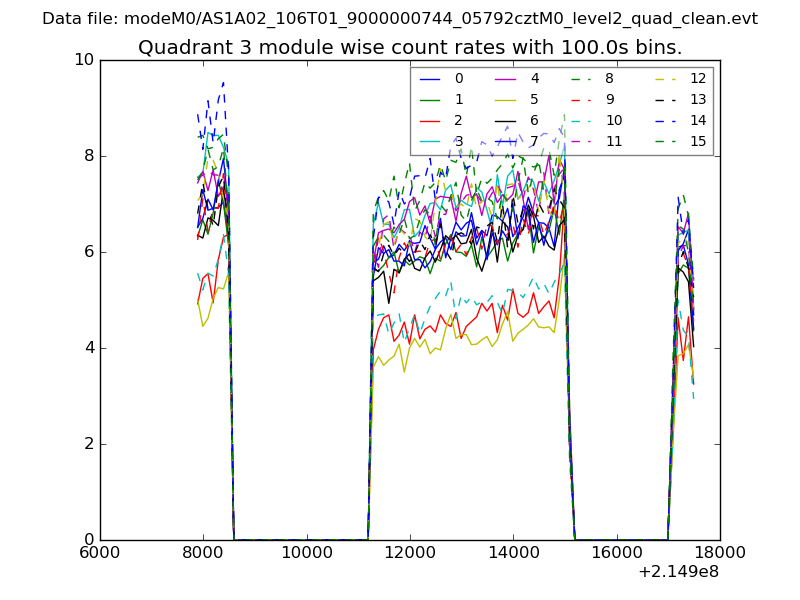
| Module-wise count rates for Quadrant C Data is divided into 100 sec bins |
 |
 |
| Module-wise count rates for Quadrant D Data is divided into 100 sec bins |
 |
 |
| Parameter | Plot |
|---|---|
| CZT HV Monitor | 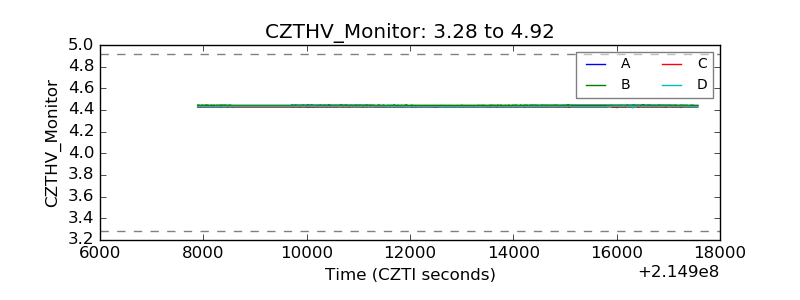 |
| D_VDD |  |
| Temperature 1 | 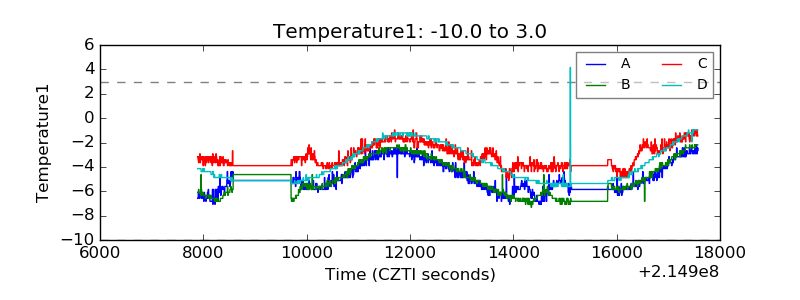 |
| Veto HV Monitor | 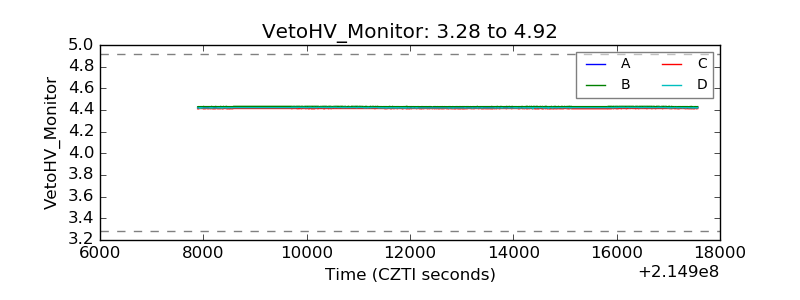 |
| Veto LLD | 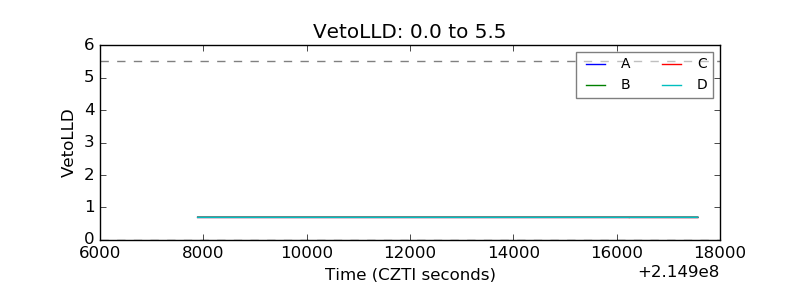 |
| Alpha Counter | 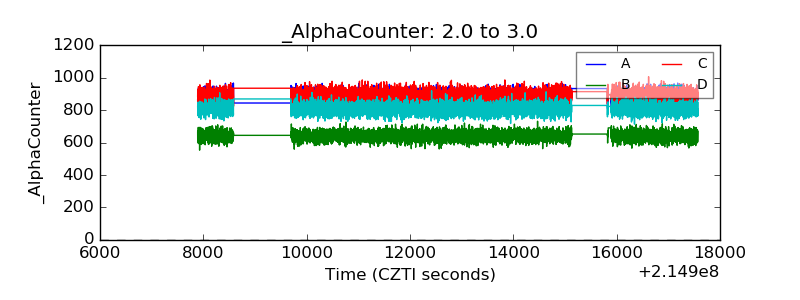 |
| _CPM_Rate | 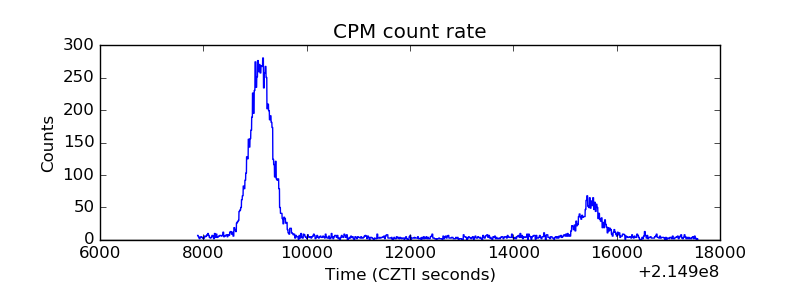 |
| CZT Counter | 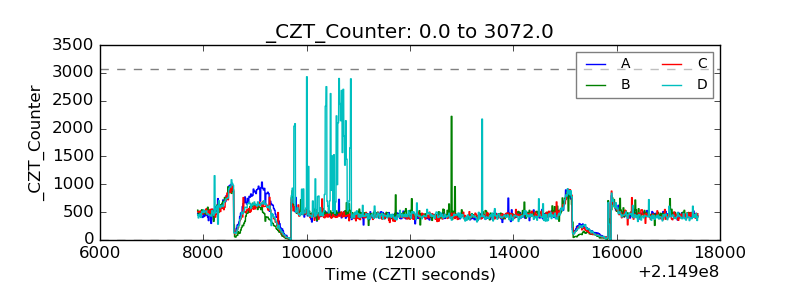 |
| +2.5 Volts monitor |  |
| +5 Volts monitor |  |
| _ROLL_ROT | 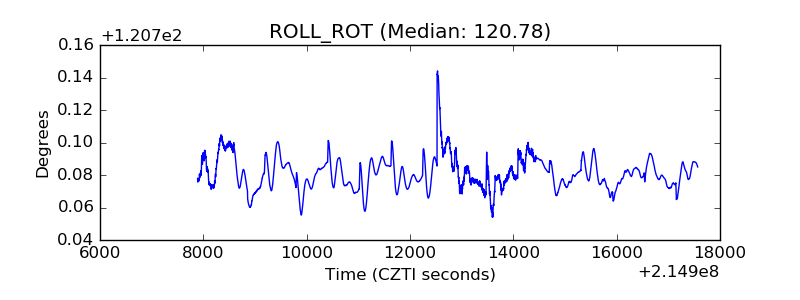 |
| _Roll_DEC | 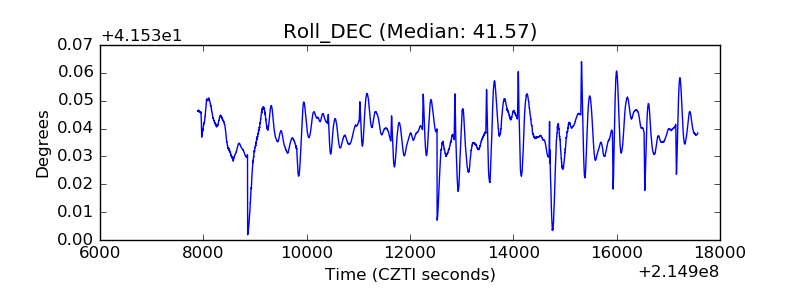 |
| _Roll_RA | 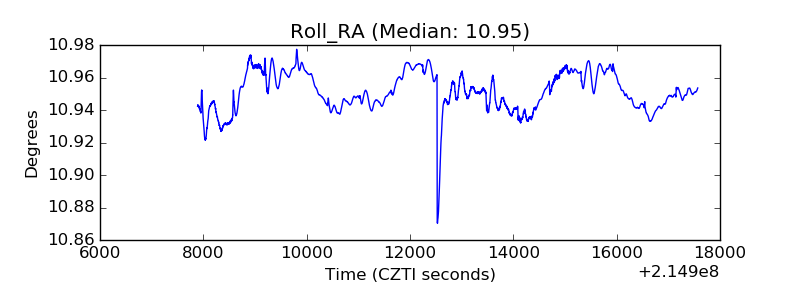 |
| Veto Counter | 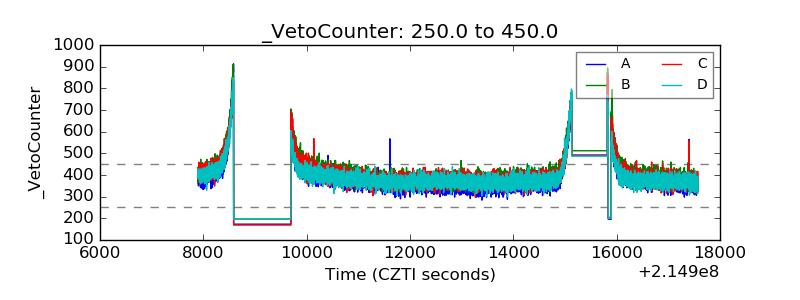 |